by Contributed | Nov 1, 2024 | Technology
This article is contributed. See the original author and article here.
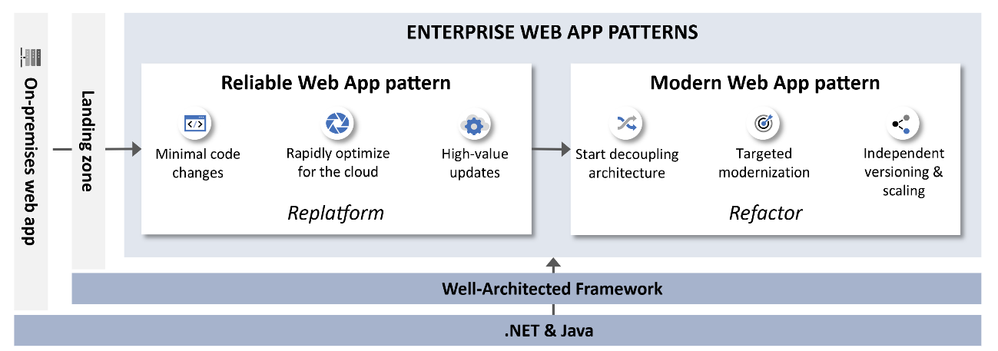
We are excited to introduce the Modern Web App (MWA) pattern for .NET. MWA is part of our Enterprise App Patterns (EAP), that offers guidance to accelerate app modernization to the cloud. MWA provides developer patterns, prescriptive architecture, reference implementation, and infrastructure guidance that aligns with the principles of the Azure Well-Architected Framework (WAF) and 12-factor app methodologies so you can be assured the guidance is real-world proven.
The Modern Web App (MWA) pattern marks the next stage in transforming monolithic web applications toward cloud-native architecture, with a focus on the Refactor modernization strategy. Building on the Reliable Web App (RWA) pattern, which helped organizations transition to cloud with minimal changes under a Replatform approach, MWA guides teams further by encouraging decoupling and decomposition of key functions into microservices. This enables high-demand areas to be optimized for agility and scalability, providing dedicated resources for critical components and enhancing reliability and performance. Decoupling also allows independent versioning and scaling, delivering cost efficiency and flexibility to evolve individual app components without affecting the entire system.
Key Features of Modern Web App pattern
The Modern Web App Pattern provides detailed guidance to decouple critical parts of a web application, enabling independent scaling, greater agility, and cost optimization. This decoupling approach ensures that high-demand components have dedicated resources and may be versioned and scaled independently, improving the reliability and performance of the application and agility to enhance features separately. By separating services, the risk of degradation in one part of the app affecting other parts is minimized. Here are some strategies MWA adopts:
- Modernization through Refactoring
Built on top of the Reliable Web App Pattern, MWA focuses on optimizing high-demand areas of web applications by decoupling critical components.
- Incremental modernization using strangler-fig pattern
Guidance for incremental refactoring from monolithic to decoupled services, reducing risks during modernization and improving agility for new features.
- Embracing Cloud-Native architectures
Leverages Azure services such as Azure App Services, Azure Container Apps, Azure Container Registry, Azure Service Bus, Azure Monitor and more to build independently scalable, resilient cloud-native applications.
- Independent scaling using Azure Container Apps
Allows key parts of the app to scale independently, optimizing resource usage and reducing costs.
- Enhanced security and availability
Hub and Spoke architecture for production infrastructure improves security and isolates workloads, and multi-region deployment supports a 99.9% business srvice-level objectives (SLO).
What’s covered in the reference implementation?

In this context, we use a fictional company, Relecloud’s, evolving business needs to illustrate the Modern Web App (MWA) pattern, which takes scalability further through decoupling and refactoring of monolithic line-of-business web app. This architecture enables independent scaling via microservices for high demand, supporting Relecloud’s growth while enhancing security, agility and reliability meeting the 99.9% business SLO uptime requirement.
Azure Services |
Developer Patterns |
Best Practices |
Patterns from RWA |
Other awesomeness! |
- Azure Front Door
- Microsoft Entra ID
- Azure App Service
- Azure Container Apps
- Azure Container Registry
- Azure Cache for Redis
- Azure SQL
- Azure Storage
- Azure Key Vault
- Azure App Configuration
- Azure Service Bus
- Azure Monitor and App Insights
|
- Strangler Fig
- Queue-based Load Leveling
- Competing Consumers
- Health Endpoint Monitoring
|
- Feature rollouts using Feature Flags
- Distributed Tracing
- Managed Identities
- Private endpoints
- Hub and Spoke network architecture
|
- Retry
- Circuit-breaker
- Cache-aside
|
- Azure Developer CLI (azd)
- Reusable modular IaC assets (Bicep)
- Resource Tagging
- Multi-region support with 99.9% business SLO
- Dev and Prod Environments & SKUs
- .. and more!
|
Get started
- We created a full production-grade application that you can deploy easily to Azure to see all of the principles of MWA in action. Visit the MWA GitHub repo for more information.
- Check out all of the in-depth documentation on Microsoft Learn.
- Try out the patterns included in MWA and share your feedback in comments.
by Contributed | Nov 1, 2024 | Technology
This article is contributed. See the original author and article here.
Introduction
When gathering SharePoint data through Microsoft Graph Data Connect, you are billed through Azure. As I write this blog, the price to pull 1,000 objects from Microsoft Graph Data Connect in the US is $0.75, plus the cost for Azure infrastructure like Azure Storage and Azure Synapse.
That is true for all datasets except the SharePoint Files dataset, which has a different billing rate. Because of its typical high volume, the SharePoint Files dataset is billed at $0.75 per 50,000 objects.
I wrote a blog about what counts as an object, but I frequently get questions about how to estimate the overall Azure bill for the Microsoft Graph Data Connect for SharePoint for a specific project. Let me try to clarify things…
Before we start, here are a few notes and disclaimers:
- These are estimates and your specific Azure bill will vary.
- Check the official Azure links provided. Rates may vary by country and over time.
- These are Azure pay-as-you-go list prices in the US as of October 2024.
- You may benefit from Azure discounts, like savings using a pre-paid plan.
How many objects?
To estimate the number of objects, you start by finding out the number of sites in the tenant. This should include all sites (not just active sites) in your tenant. You can find this number easily in the SharePoint Admin Center. That will be the number of objects in your SharePoint Sites dataset.
Finding the number of SharePoint Groups and SharePoint Permissions will require some estimation. I recently collected some telemetry and saw that the average number of SharePoint Groups per Site for a sample of large tenants was around 31. The average SharePoint permissions per site was around 61. The average number of files per site was 2,874.
Delta pulls (gathering just what changed) will be smaller, but that also varies depending on how much collaboration happens in your tenant (in the Delta numbers below, I am estimating a 5% change for an average collaboration level).
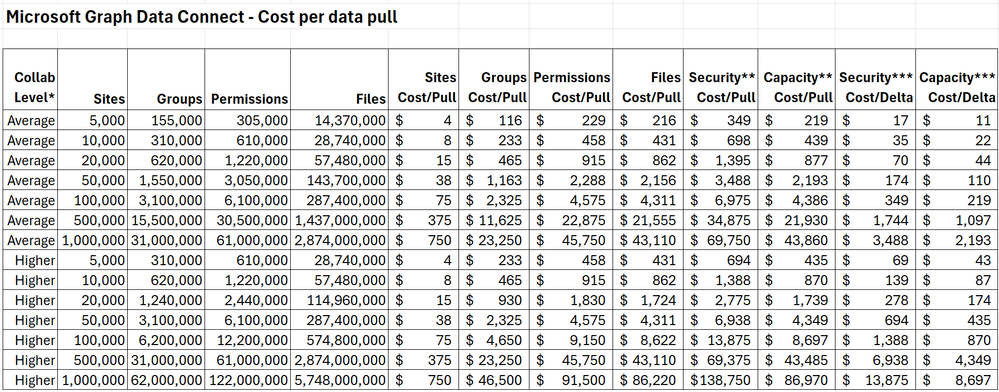
Here’s a table to help you estimate your Microsoft Graph Data Connect for SharePoint costs:
Notes for the table above:
* Higher collaboration level assumes twice the average in terms of groups, permissions and files.
** Security scenario includes Sites, Groups and Permissions. Capacity Scenario includes Sites and Files.
*** Delta assumes 5% change for average collaboration and 10% change for high collaboration. These are on the high side for one week’s worth of changes. Your numbers will likely be smaller.
As you can see, smaller tenants with an average collaboration will see costs below $10 for the smaller Sites dataset and below $1,000 for larger datasets like Permissions or Files.
If you want to estimate the number of SharePoint objects more precisely, there is an option to sample the dataset and get a total object count without pulling the entire dataset. For more information, see MGDC for SharePoint FAQ: How can I sample or estimate the number objects in a dataset?
The official information about Microsoft Graph Data Connect pricing is at https://azure.microsoft.com/en-us/pricing/details/graph-data-connect/
How much storage?
The SharePoint information you get from Microsoft Graph Data Connect will be stored in an Azure Storage account. That also incurs some cost, but it’s usually small when compared to the Microsoft Graph Data Connect costs for data pulls. The storage will be proportional to the number of objects and to the size of these objects.
Again, this will vary depending on the amount of collaboration in the tenant. More sharing means more members in groups and more people in the permissions, which will result in more objects and also larger objects.
I also did some estimating of object size and arrived at around 2KB per SharePoint Site object, 20KB per SharePoint Group object, 3KB per Permission object and 1KB per file object. There are several Azure storage options including Standard vs. Premium, LRS vs. GRS, v1 vs. v2 and Hot vs. Cool. For Microsoft Graph Data Connect, you can go with a Standard + LRS + V2 + Cool blob storage account, which costs $0.01 per GB per month.
Here’s a table to help you estimate your Azure Storage costs:

The same notes from the previous table apply here.
As you can see, smaller tenants with average collaboration will see storage costs below $1000/month, most of it going to storing the larger Files dataset. The cost for delta dataset storage is also fairly small, even for the largest of tenants. There are additional costs per storage operation like read and write but those are negligible at this scale (for instance, $0.065 per 10,000 writes and $0.005 per 10,000 reads).
The official information about Azure Storage pricing is at https://azure.microsoft.com/en-us/pricing/details/storage/blobs/
What about Synapse?
You will also typically use Azure Synapse to move the SharePoint data from Microsoft 365 to your Azure account. You could run a pipeline daily to get the information and do some basic processing, like computing deltas or creating aggregations.
Here are a few of the items that are billed for Azure Synapse when running Microsoft Graph Data Connect pipelines:
- Azure Hosted – Integration Runtime – Data Movement – $0.25/DIU-hour
- Azure Hosted – Integration Runtime – Pipeline Activity (Azure Hosted) – $0.005/hour
- Azure Hosted – Integration Runtime – Orchestration Activity Run – $1 per 1,000 runs
- vCore – $0.15 per vCore-hour
As with Azure Storage, the costs here are small. You will likely need one pipeline run per day and it will typically run in less than one hour for a small tenant. Large tenants might need a few hours per run to gather all their SharePoint datasets. You should expect less than $10/month for smaller tenants and less than $100/month for larger and/or more collaborative tenants.
The official information about Azure Synapse pricing is at https://azure.microsoft.com/en-us/pricing/details/synapse-analytics/
Closing notes
These are the main meters in Azure to get you started with costs related to Microsoft Graph Data Connect for SharePoint. I suggest experimenting with a small test/dev tenant to get familiar with Azure billing.
For more information about Microsoft Graph Data Connect for SharePoint, see the links at https://aka.ms/SharePointData.
by Contributed | Nov 1, 2024 | Technology
This article is contributed. See the original author and article here.
We previously announced that support would end for retired Azure classic storage accounts on 31 August 2024. Now that we are past the retirement date and Azure classic storage accounts are not supported, we have some updates to share on our plans and the considerations for customers who have not migrated their remaining classic storage accounts to Azure Resource Manager.
On or after 1 November 2024:
- Your ability to perform write operations using the classic service model APIs, including PUT and PATCH, will be limited. You will only be able to perform read and list operations using the classic service model APIs.
- Your remaining classic storage accounts will be migrated to Azure Resource Manager on your behalf on a rolling schedule. Your data will continue to be stored, but any applications that use the classic service model APIs to perform management plane operations will experience disruptions if you’re actively using any write operations. Write operations will only be available through the Azure Resource Manager APIs after your account(s) have been migrated.
- Note: There are no impacts on the availability of the data plane APIs before, during, or after the migration of classic storage accounts.
Azure storage accounts under Azure Resource Manager provides the same capabilities as well as new features, including:
- A management layer that simplifies deployment by enabling you to create, update, and delete resources.
- Resource grouping, which allows you to deploy, monitor, manage, and apply access control policies to resources as a group.
To avoid service disruptions, you’ll need to migrate your classic storage accounts to Azure Resource Manager as soon as possible. Our recommendation is that customers self-service their migrations using the existing migration capabilities instead of waiting for Azure Storage to migrate any remaining classic storage accounts on your behalf. This ensures that you can migrate on your schedule and minimize impacts. We cannot guarantee that you will not experience service interruptions if you further delay your migration.
Required action
To avoid service disruptions, migrate your classic storage accounts as soon as possible. Additionally, update any management operations in code or applications that target the classic deployment model. Read our FAQ and migration guidance for more information.
Help and support
If you have questions, get answers from community experts in Microsoft Q&A. If you have a support plan and you need technical help, open the Azure portal and select the question mark icon at the top of the page.
FAQ
Q: I want to delete my account, but the operation is blocked. How do I delete my account if write operations are blocked on the classic control plane?
A: You can delete your account using the Azure Resource Manager APIs for Azure Storage after your account has been migrated from the classic service model.
Q: Will I be able to use the legacy PowerShell cmdlets to manage my classic storage accounts?
A: No. After your accounts have been migrated, they can be managed with the modern PowerShell cmdlets for Azure Storage and Azure Resource Manager.
Q: What resource group will my migrated resources appear in?
A: Any classic storage accounts that are migrated on your behalf will be placed in a new resource group. The name of the new resource group follows the pattern -Migrated. For more information on the migration process, visit Understand storage account migration from the classic deployment model to Azure Resource Manager.
by Contributed | Oct 31, 2024 | Technology
This article is contributed. See the original author and article here.
We’re excited and honored to be positioned in the Leaders Category in the IDC MarketScape: Worldwide SIEM (security information and event management) for Enterprise 2024 Vendor Assessment (doc #US51541324, September 2024)—our third major analyst report in SIEM to name Microsoft as a Leader. We were recognized in the most recent reports as a Leader in the 2024 Gartner® Magic Quadrant™ for Security Information and Event Management and as a Leader in The Forrester Wave™: Security Analytics Platforms, Q4 2022. We believe this position validates our vision and continued investments in Microsoft Sentinel, making it a best-in-class, cloud-native SIEM solution. It’s always a rewarding experience when trusted analysts recognize the continued work we’ve put into helping our customers modernize their operations, improve their security posture, and work more efficiently.
A Leader in the market with an innovative solution for the SOC
Microsoft Sentinel provides a unique experience for customers to help them act faster and stay safer while managing the scaling costs of security. Customers choose our SIEM in order to:
- Protect everything with a comprehensive SIEM solution. Microsoft Sentinel is a cloud-native solution that supports detection, investigation, and response across multi-cloud and multi-platform data sources with 340+ out-of-the-box connectors A strength of Microsoft’s offering is its breadth, which includes user entity and behavior analytics (UEBA), threat intelligence and security orchestration, automation, and response (SOAR) capabilities, along with native integrations into Microsoft Defender threat protection products.
- Enhance security with a unified security operations platform. Customers get the best protection when pairing Microsoft Sentinel with Defender XDR in Microsoft’s unified security operations platform. The integration not only brings the two products together into one experience but combines functionalities across each to maximize efficiency and security. One example is the unified correlation engine which delivers 50% faster alerting between first- and third-party data, custom detections and threat intelligence.3 Customers can stay safer with a unified approach, with capabilities like automatic attack disruption—which contains attacks in progress, limiting their impact at machine speed.
- Address any scenario. As the first cloud-native SIEM, Microsoft Sentinel helps customers observe threats across their digital estate with the flexibility required for today’s challenges. Our content hub offerings include over 200 Microsoft- created solutions and over 280 community contributions. The ability to adapt to the unique use cases of an organization is something called out in both the Forrester and Gartner reports.
- Scale your security coverage with cloud flexibility. Compared with legacy, on-premises SIEM solutions, Microsoft Sentinel customers see up to a 234% return on investment (ROI).1 This makes it an attractive option for customers looking for a scalable offering to meet the evolving needs of their business while managing the costs of data. We’ve recently launched a new, low-cost data tier called Auxiliary Logs to help customers increase the visibility of their digital environment, while keeping their budgets in check. In addition, Microsoft’s SOC Optimizations feature, a first of its kind offering, provides targeted recommendations to users on how to better leverage their security data to manage costs and maximize their protection, based on their specific environment and using frameworks like the MITRE attack map
- Respond quickly to emergent threats with AI. Security Copilot is a GenAI tool that can help analysts increase the speed of their response, uplevel their skills, and improve the quality of their work. 92% of analysts reported using Copilot helped make them more productive and 93% reported an improvement in the quality of their work.
What’s next in Microsoft Security
Microsoft is dedicated to continued leadership in security through ongoing investment to provide customers with the intelligence, automation, and scalability they need to protect their businesses and work efficiently. New and upcoming enhancements include more unified features across SIEM and XDR, exposure management and cloud security in the unified security operations platform, and our SIEM migration tool—which now supports conversion of Splunk detections to Microsoft Sentinel analytics rules and additional Copilot skills to help analysts do their job better.
To learn more about Microsoft Security solutions, visit our website. Bookmark the Security blog to keep up with our expert coverage on security matters. Also, follow us on LinkedIn (Microsoft Security) and X (@MSFTSecurity) for the latest news and updates on cybersecurity.
by Contributed | Oct 30, 2024 | Technology
This article is contributed. See the original author and article here.
Today, cybersecurity is everyone’s job. Although specialized engineers are vital, the best defense is from the ground up and from end to end.
You’re not imagining it—the number of major cybersecurity incidents is increasing. And according to Forbes Advisor Cybersecurity Stats: Facts And Figures You Should Know, “The repercussions of cyberattacks are far-reaching and costly. A data breach costs $4.88 million on average in 2024. In 2023, compromised business emails accounted for more than $2.9 billion in losses. These alarming figures emphasize the danger of cyber vulnerabilities and highlight the need for skilled cybersecurity professionals.”
Even small and medium-sized organizations can inadvertently provide cybercriminals with a pathway to bigger targets, which means that every organization needs to skill up its teams to protect against ransomware, data breaches, and other security incidents.
National Cybersecurity Awareness Month is an ideal time for organizations of all sizes to refocus and make a plan to build strong, year-round defenses. Microsoft Learn for Organizations can help your teams build skills to protect and secure your data, information, and systems.
Apply security first, across the board
Even the most sophisticated cyber defense is built on the basics. The US Federal Trade Commission’s (FTC’s) Cybersecurity Basics include using strong passwords and multifactor authentication, keeping all software and systems updated, securing backups, and of course, remaining on the alert against phishing.
Another good start is Microsoft Security 101, which explains security-related vocabulary, core concepts, and best practices. Or check out the Security hub on Microsoft Learn, which offers technical guidance and resources for aspiring and experienced cybersecurity professionals.
Beyond these foundations, organizations should cultivate a true security-first culture, as embodied by the Microsoft Security First Initiative (SFI). Upskilling across all roles and teams can minimize weak links in the protective chain, empowering your entire organization to prevent, detect, and mitigate issues.
Microsoft Learn for Organizations includes Plans on Microsoft Learn that cover security training for various job roles, such as:
Build skills with cybersecurity training from Microsoft Learn
Microsoft Learn offers self-paced, on-demand security training for many roles, skill levels, and products, and Microsoft Learn for Organizations curates this content for you and your teams to make it easier to reach your goals. The new Microsoft Security Technical Training poster highlights key offerings—whether you’re just starting out or you want to earn an expert Certification.
Get started with cybersecurity basics
Begin your learning journey with self-paced training on the essentials:
Build core skills
The core security training on the new poster dives deeper with self-paced offerings that help you skill up to earn Microsoft Certifications:
- Course SC-200: Microsoft Security Operations Analyst teaches you to investigate, search for, and mitigate threats using Microsoft Sentinel, Microsoft Defender for Cloud, and Microsoft 365 Defender.
- Course SC-300: Microsoft Identity and Access Administrator covers configuring and managing identities for users, devices, Azure resources, and applications. Use Microsoft Entra to design, implement, and operate your organization’s identity and access management.
- Course SC-400: Administering Information Protection and Compliance in Microsoft 365 teaches the skills needed to fill the role of information protection and compliance administrator.
- Course AZ-500: Microsoft Azure Security Technologies prepares you to fill the role of Azure security engineer, as you implement security controls, maintain your organization’s security posture, and identify and remediate security vulnerabilities.
- Learning path SC-100: Design solutions that align with security best practices and priorities offers expert training for real-world cybersecurity skills to protect your organization’s assets, business, and operations.
Earn scenario-based credentials
Microsoft Applied Skills credentials focus on validating in-demand technical skills in specific scenarios, proving your readiness to take on new tasks and projects for your team. Security-focused Applied Skills scenarios include:
Be cybersmart—always vigilant and always learning
Technology is ever evolving, and so is cybercrime. And building a strong cybersecurity defense is a journey. You and your teams can build your skills anytime—not just during National Cybersecurity Awareness Month! The resources, offerings, and opportunities on Microsoft Learn—curated for teams on Microsoft Learn for Organizations—can help you and your organization build the skills needed to address today’s security requirements and empower your teams to better meet tomorrow’s cybersecurity challenges.

Recent Comments