by Contributed | Sep 15, 2023 | Technology
This article is contributed. See the original author and article here.
We are very happy to announce the private preview of Data Virtualization in Azure SQL Database. Data Virtualization in Azure SQL Database enables working with CSV, Parquet, and Delta files stored on Azure Storage Account v2 (Azure Blob Storage) and Azure Data Lake Storage Gen2. Azure SQL Database will now support: CREATE EXTERNAL TABLE (CET), CREATE EXTERNAL TABLE AS SELECT (CETAS) as well as enhanced OPENROWSET capabilities to work with the new file formats.
The list of capabilities available in private preview are:
Metadata functions:
Just like in SQL Server 2022 (Data Virtualization with PolyBase for SQL Server 2022 – Microsoft SQL Server Blog) and Azure SQL Managed Instance (Data virtualization now generally available in Azure SQL Managed Instance – Microsoft Community Hub), Data Virtualization in Azure SQL Database also supports updated metadata functions, wildcard search mechanism, and procedures that enables the users to query across different folders and leverage partition pruning, commands like:
- Filename();
- Filepath();
- sp_describe_first_result_set.
Benefits:
Major benefits of Data Virtualization in Azure SQL Database are:
- No data movement: Access real-time data where it is.
- T-SQL language: Ability to leverage all the benefits of the T-SQL language, its commands, enhancements, and familiarity.
- One source for all your data: Users and applications can use Azure SQL Database as a data hub, accessing all the required data in a single environment.
- Security: Leverage SQL security capabilities to simplify permissions, credential management, and control
- Export: Easily export data as CSV or Parquet to any Azure Storage location, either to empower other applications or reduce cost.
Getting started:
For simplicity, we are going to use publicly available NYC Taxi dataset (NYC Taxi and Limousine yellow dataset – Azure Open Datasets | Microsoft Learn) that allows anonymous access.
-- Create data source for NYC public dataset:
CREATE EXTERNAL DATA SOURCE NYCTaxiExternalDataSource
WITH (LOCATION = 'abs://nyctlc@azureopendatastorage.blob.core.windows.net');

-- Query all files with .parquet extension in folders matching name pattern:
SELECT TOP 1000 *
FROM OPENROWSET(
 BULK 'yellow/puYear=*/puMonth=*/*.parquet',
 DATA_SOURCE = 'NYCTaxiExternalDataSource',
 FORMAT = 'parquet'
) AS filerows;

-- Schema discovery:
EXEC sp_describe_first_result_set N'
 SELECT
 vendorID, tpepPickupDateTime, passengerCount
 FROM
 OPENROWSET(
  BULK ''yellow/*/*/*.parquet'',
  DATA_SOURCE = ''NYCTaxiExternalDataSource'',
  FORMAT=''parquet''
 ) AS nyc';

-- Query top 100 files and project file path and file name information for each row:
SELECT TOP 100 filerows.filepath(1) as [Year_Folder],
filerows.filepath(2) as [Month_Folder],
filerows.filename() as [File_name],
filerows.filepath() as [Full_Path]
FROM OPENROWSET(
 BULK 'yellow/puYear=*/puMonth=*/*.parquet',
 DATA_SOURCE = 'NYCTaxiExternalDataSource',
 FORMAT = 'parquet') AS filerows;

-- Create external file format for Parquet:
CREATE EXTERNAL FILE FORMAT DemoFileFormat
WITH ( FORMAT_TYPE=PARQUET );

-- Create external table:
CREATE EXTERNAL TABLE tbl_TaxiRides(
 vendorID VARCHAR(100) COLLATE Latin1_General_BIN2,
 tpepPickupDateTime DATETIME2,
 tpepDropoffDateTime DATETIME2,
 passengerCount INT,
 tripDistance FLOAT,
 puLocationId VARCHAR(8000),
 doLocationId VARCHAR(8000),
 startLon FLOAT,
 startLat FLOAT,
 endLon FLOAT,
 endLat FLOAT,
 rateCodeId SMALLINT,
 storeAndFwdFlag VARCHAR(8000),
 paymentType VARCHAR(8000),
 fareAmount FLOAT,
 extra FLOAT,
 mtaTax FLOAT,
 improvementSurcharge VARCHAR(8000),
 tipAmount FLOAT,
 tollsAmount FLOAT,
 totalAmount FLOAT
)
WITH (
 LOCATION = 'yellow/puYear=*/puMonth=*/*.parquet',
 DATA_SOURCE = NYCTaxiExternalDataSource,
 FILE_FORMAT = DemoFileFormat
);

-- Query the external table:
SELECT TOP 1000 * FROM tbl_TaxiRides;
Private Preview Sign-up form:
Data Virtualization in Azure SQL Database is in active development, Private Preview users will help shape the future of the feature, with regular interactions with Data Virtualization product team. If you want to be part of the private preview a sign-up form is required and can be found here.
by Contributed | Sep 14, 2023 | Technology
This article is contributed. See the original author and article here.
Our Microsoft Learn community, along with the rest of the world, has experienced a time of great change over the last few years—the pandemic, a sudden shift to remote work, economic volatility, and huge leaps in the capabilities and implementation of AI, to name just a few. Times of change like these cause us all to reevaluate our priorities, how we operate, and what’s most important across all areas of our lives. Careers are no small part of that equation. We must continuously adapt to these new realities, whether we’re employees, employers, job seekers, educators, or leaders of organizations. Because of that impact, Microsoft Learn remains committed to leading the way with resources to help equip our learners and customers with technical skills to not only meet but thrive through the challenges of that ever-changing landscape.
What does ‘skills-first’ mean and why are we talking about it?
We’re always on the lookout for emerging trends so that we can bring you insights to help you succeed. The latest and most significant of these trends is a direct response to the massive global shifts we alluded to above, what the World Economic Forum refers to as “an accelerated shift towards a skills-based operating model for talent.” Simply put: whether you’re focused on your own career or on finding the right talent, a skills-centric mentality is becoming more essential.
How does this impact you? There are all sorts of reasons to engage with skilling content—you might have one or more of the following goals (featuring some great Microsoft Learn blogs on the subject!):
Whatever your objective, knowing how to find and feature the right skills is a game-changer, and we want to be part of your journey.
What to expect from Microsoft Learn through the end of October
Our ‘Skill-it-forward’ content throughout September and October will be focused on understanding the skills-first trend and why it’s important. We’ll also be highlighting the tools and resources you need to build your technical skills and expertise. You can expect the inside scoop about what’s new with Microsoft Learn (hint: we might have a few announcements to make…). We’ll offer resources across Microsoft Learn and beyond to help you not only navigate this skills-centric shift but use it to achieve your goals. And of course, we can’t leave out Tips & Tricks – we always have a few up our sleeve!
Make sure you’re following us on Twitter and LinkedIn, and are subscribed to “The Spark,” our recently enhanced LinkedIn newsletter so you don’t miss any of the exciting stuff we have planned!
by Contributed | Sep 13, 2023 | Technology
This article is contributed. See the original author and article here.
In a previous blog, we introduced Continuous Access Evaluation (CAE) – a product that brings Zero Trust principles to session management. Today we would like to discuss securing cross-tenant access with a focus on preventing data exfiltration.
It’s impossible to imagine a successful modern organization that doesn’t collaborate with partners across organizational boundaries. While cross-company collaboration empowers employees and enables partnerships, it also lowers barriers for both accidental and malicious data exfiltration. Microsoft Cross-Tenant Access Settings is designed to address security of cross-company exchange.
Outbound and Inbound Cross-Tenant Access Settings offer fine grain security controls for cross-company collaboration using user’s home identity, while Tenant Restriction v2 (TRv2) can be used to prevent data exfiltration using foreign identity.
Some of the hardest-to-prevent data leaks happen when users inside your organization use foreign identities to connect to external tenants. Let’s consider one such attack. A malicious insider creates a Microsoft Entra tenant. Then they authenticate to their malicious tenant from your organization’s device. Now the attacker can leak your files via email using the Exchange Online account of the malicious tenant. These types of attacks can be described as creating a “USB dongle in a cloud.” Regular security methods do not work against such attacks. Your tenant’s policies do not apply to external identities that attackers use. Blocking Microsoft Entra ID or Exchange Online URIs in the firewall would block your legitimate users along with the attacker. These types of attack need special defenses that TRv2 provides.
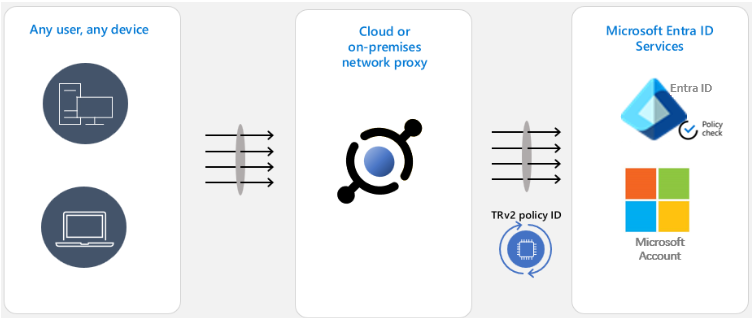
TRv2 works by sending special signals to Entra ID, Microsoft Account and other Microsoft resources. These signals point to Cross-Tenant Access Settings’ TRv2 policy that you created. Microsoft resources evaluate the policy and block unsanctioned access. We have two major flavors of TRv2.
Auth Plane TRv2 can block logins with external identities based on policy. To configure it you need to deploy a network proxy in your organization and configure that proxy to set TRv2 signals on all traffic to Entra ID and Microsoft Account. In the above example of a malicious insider leaking data over external email, the attacker will not be able to login to their malicious tenant and therefore will not be able to send email. Auth Plane TRv2 is now generally available.
Universal TRv2 as part of Microsoft Entra Global Secure Access goes one step further to protect against more sophisticated attacks where an attacker bypasses authentication by allowing anonymous access to the malicious tenant’s apps, such as anonymous meeting join in Teams. Or the attacker can import to your organizational device an access token lifted from a device in the malicious tenant. All these attack vectors bypass login to Entra ID. Since Universal TRv2 sends TRv2 signals on authentication plane (Entra ID and Microsoft Account) and data plane (Microsoft cloud applications), these attacks will be prevented. Universal TRv2 is currently in public preview.

We have another flavor of TRv2 in public preview – TRv2 on Windows. It’s a partial solution that protects the authentication and data planes but only for some scenarios. It only works on managed Windows devices and does not protect .NET stack, Chrome, or Firefox. We have heard from customers that it is difficult to deploy and does not provide adequate security. The Windows solution was meant to provide temporary protection until Universal TRv2 is released and we’re planning to retire it after Universal TRv2 is generally available.
Anna Barhudarian
Principal Product Manager, Identity Division
Learn more about Microsoft Entra:

by Contributed | Sep 13, 2023 | Azure, Business, Gartner Magic Quadrant, Hybrid Work, Microsoft 365, Technology
This article is contributed. See the original author and article here.
Microsoft recognized as a Leader in the Gartner DaaS Magic Quadrant with a global presence, the largest partner ecosystem, and unparalleled integration.
The post Microsoft recognized as a Leader in 2023 Gartner® Magic Quadrant™ for Desktop as a Service appeared first on Microsoft 365 Blog.
Brought to you by Dr. Ware, Microsoft Office 365 Silver Partner, Charleston SC.
by Contributed | Sep 12, 2023 | Technology
This article is contributed. See the original author and article here.
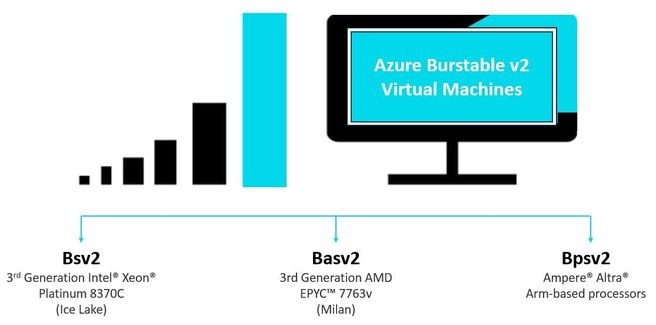
Today, we are announcing the general availability of the latest generations of Azure Burstable virtual machine (VM) series – the new Bsv2, Basv2, and Bpsv2 VMs based on the Intel® Xeon® Platinum 8370C, AMD EPYC™ 7763v, and Ampere® Altra® Arm-based processors respectively.
The new generation of Azure burstable B-series v2 VMs are the lowest priced amongst general purpose VMs in Azure and now include native support for Arm-based workloads with the Bpsv2 series. B-series v2 VMs offer up to 15% better price-performance, up to 5x higher network bandwidth, and 10x higher remote storage throughput compared to the previous generation B-series VMs.
Azure customers today can select from a diverse range of Azure virtual machines that are tailored to meet the high CPU performance and utilization needs of their workloads. However, certain categories of workload do not require high levels of CPU utilization and performance on a continuous basis and can be run more cost-effectively on VMs optimized for burstable performance. With B-series v2 VMs, you can balance high CPU utilization and cost savings that automatically meets your workload’s real-time requirements. Burstable virtual machines provide high CPU utilization when applications need it and run at a baseline CPU utilization to save cost when high CPU utilization and performance are not required.
B-series v2 VMs are ideal for workloads that experience unpredictable spikes in demand and require occasional bursts of high CPU utilization. This capability makes burstable VMs ideal candidates for a variety of workloads such as web applications, small and medium databases, micro services, code repositories, CI/CD pipelines for development and test environments, and servers for proof-of-concept development that don’t require full CPU performance all the time, but occasionally need to burst to complete tasks quickly.
With the new Arm-based Bpsv2 VMs now available alongside x86-based Bsv2 and new AMD-based Basv2 burstable VMs, customers can now tailor their infrastructure for specific performance and price-performance requirements across CPU architectures. Arm-Based Bpsv2 VMs, with one physical core per vCPU, are ideal for many workloads like microservices, web apps, containers, and small to medium databases. While Bsv2 and Bav2 VMs can run these workloads, they also offer capabilities and infrastructure for monolithic, vectorized workloads, and others that don’t have affinity to Arm-based VMs.
You can choose from multiple memory ratios for a given vCPU size, giving you the flexibility to select the configuration and architecture that is ideal for your workload. Bsv2-series and Basv2-series offer up to 32 vCPUs and 128 GiB of RAM, and the Bpsv2-series offers up to 16 vCPUs with 64 GiB of RAM. All sizes support accelerated networking and network bandwidth up to 6.25 Gbps. To learn more about the pricing of Arm64-based and x86-based VMs, please visit the Azure Virtual Machines pricing pages.
The new Azure B-series v2 VMs support various Linux OS distributions including Canonical Ubuntu, Red Hat Enterprise Linux, CentOS, Debian, SUSE Enterprise Linux and more. Windows Server and Windows Client are supported on x86-based B-series VMs. Client application developers can take advantage of Azure’s highly available, scalable, and secure platform to run cloud-based software, build and test workflows. To help developers increase their agility and support their work, we’ve made Insider Preview releases of Windows 11 Pro and Enterprise available on Arm-based Azure B-series VMs. Access the full list of images in the Azure Marketplace.
The new virtual machines support all remote disk types such as Standard SSD, Standard HDD, Premium SSD and Ultra Disk storage. To learn more about various disk types and their regional availability, please refer to Azure managed disk type. Disk storage is billed separately from virtual machines and to learn more on disk pricing please see pricing for disks.
Learn more about these new B-series v2 VMs by visiting the Bsv2, Basv2, and Bpsv2 documentation, reading about the regional availability at Azure product availability page, and following this simple migration guide.
You can also take advantage of Spot Virtual Machines, Reserved Instances and Saving Plan that are available for all new B-series VM families to potentially save even more. You can significantly reduce costs and improve your budget forecasting with Reserved VM Instances through upfront one-year or three-year commitments. With the Azure Savings Plan, you have the flexibility to save across multiple Azure Services, including this one. For workloads that can tolerate interruptions and have flexible execution time, using Spot Virtual Machines can significantly reduce the cost of running in Azure and further optimize your cloud spend. Eligible new Azure customers can sign up for an Azure free account and receive $200 Azure credit.
Start running your applications on Azure B-series v2 VMs today. We can’t wait to hear about the amazing workloads you will build with these new VMs.
Learn what our partners have to say about Azure’s latest burstable VMs:
Azure-Ampere-Bpsv2-Burstable-Virtual-Machines
Demonstrating new Arm-based Azure Burstable VMs – Infrastructure Solutions blog – Arm Community blogs – Arm Community
Have questions? Please reach us at Azure Support Options | Microsoft Azure and our experts will be there to help you with your Azure journey.

Recent Comments