
by Contributed | Sep 26, 2023 | Business, Hybrid Work, Microsoft 365, Technology
This article is contributed. See the original author and article here.
We are re-imagining the way employees come together with Microsoft Mesh, a new three-dimensional (3D) immersive experience and, we are excited to announce Mesh public preview availability in October.
The post Microsoft Mesh enters preview in October, including a new Teams experience appeared first on Microsoft 365 Blog.
Brought to you by Dr. Ware, Microsoft Office 365 Silver Partner, Charleston SC.
by Contributed | Sep 25, 2023 | Technology
This article is contributed. See the original author and article here.
In the fall of 2018, we announced the general availability (GA) of Azure Database for MariaDB. Since that release five years ago, we’ve invested time and resources in Azure Database for MariaDB to further extend our commitment to the open-source community by providing valuable, enterprise-ready features of Azure for use on open-source database instances.
In November 2021 we released Flexible Server, the next-generation deployment option for Azure Database for MySQL. As we continue to invest in Azure Database for MySQL and focus our efforts on Flexible Server to make it the best destination for your open-source MySQL workloads, we’ve decided to retire the Azure Database for MariaDB service in two years (September 2025). This will help us focus on Azure Database for MySQL – Flexible Server to ensure that we are providing the best user experience for our customers.
Azure Database for MySQL – Flexible Server has enhanced features, performance, an improved architecture, and more controls to manage costs across all service tiers when compared to Azure Database for MariaDB. As a result, we encourage you to migrate to Azure Database for MySQL – Flexible Server before the Azure MariaDB retirement to experience the new capabilities of the service, including:
- More ways to optimize costs, including support for burstable tier compute options.
- Improved performance for business-critical production workloads that require low latency, high concurrency, fast failover, and high scalability.
- Improved uptime with the ability to configure a hot standby on the same or a different zone, and a one-hour time window for planned server maintenance.
For more information about Flexible Server, see the article Azure Database for MySQL – Flexible Server.
Migrate from Azure Database for MariaDB to Azure Database for MySQL – Flexible Server
For information about how you can migrate your Azure Database for MariaDB server to Azure Database for MySQL – Flexible Server, see the blog post Migrating from Azure Database for MariaDB to Azure Database for MySQL.
Retirement announcement FAQs
We understand that you may have a lot of questions about what this announcement means for your Azure Database for MariaDB workloads. As a result, we’ve added several “frequently asked questions” in the article What’s happening to Azure Database for MariaDB?
For quick reference, we’ve included a few key questions and answers below.
Q. Why am I being asked to migrate to Azure Database for MySQL – Flexible Server
A. There’s a high application compatibility between Azure Database for MariaDB and Azure Database for MySQL, as MariaDB was forked from MySQL. Azure Database for MySQL – Flexible Server is the best platform for running all your MySQL workloads on Azure. MySQL- Flexible Server is economical and provides better performance across all service tiers, together with more ways to control your costs for less costly and faster disaster recovery.
Q. After the Azure Database for MariaDB retirement announcement, can I still create new MariaDB servers to meet my business needs?
A. As part of this retirement, we’ll no longer support the ability to create new MariaDB instances by using Azure portal beginning on December 19, 2023. If you do still need to create MariaDB instances to meet business continuity needs, you can use the Azure CLI to do so until March 19, 2024.
Q. Can I choose to continue running Azure Database for MariaDB beyond the sunset date?
A. Unfortunately, we don’t plan to support Azure Database for MariaDB beyond the sunset date of September 19, 2025. As a result, we advise you to start planning your migration as soon as possible.
Q. I have additional questions about the retirement. How can I find out more?
A. If you have questions, get answers from community experts in Microsoft Q&A. If you have a support plan and you need technical help, create a support request that includes the following information:
- For Issue type, select Technical.
- For Subscription, select your subscription.
- For Service, select My services.
- For Service type, select Azure Database for MariaDB.
- For Resource, select your resource.
- For Problem type, select Migration.
- For Problem subtype, select Migrating from Azure for MariaDB to Azure for MySQL Flexible Server.
If you have questions about the information in this post, please don’t hesitate to reach out to us at AskAzureDBforMariaDB@service.microsoft.com. Thank you!
by Contributed | Sep 24, 2023 | Technology
This article is contributed. See the original author and article here.
This blog is a deep dive into the future of requirement gathering. This blog explores how Azure DevOps and Azure OpenAI are joining forces to transform the way we manage project requirements. From automated requirement generation to intelligent analysis, learn how these powerful tools are reshaping the landscape of project management. Stay tuned for an enlightening journey into the world of AI-powered requirement gathering!
Setting up environment
Pre-requisite
– Visual studio code
Please install below extension
– Jupyter (Publisher- Microsoft)
– Python (Publisher- Microsoft)
– Pylance (Publisher- Microsoft)
– Semantic Kernel Tools (Publisher- Microsoft)
– Python
Please install below python packages
– PIP
– Semantic-kernel
Define the Semantic Function to generate feature description-
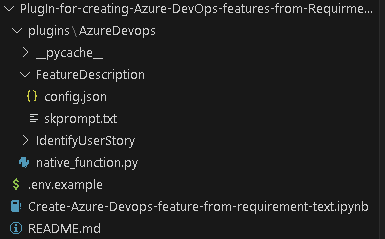
Now that you have below mentioned folder structure.
Create semantic function for generating Feature description.
The first step is to define a semantic function that can interpret the input string and map it to a specific action. In our case, the action is to generate feature description from title. The function could look something like this:
1. Create folder structure
– Create /plugins folder
– Create folder for semantic plugins inside Plugins folder, in this case its “AzureDevops”. (For more details on plugins)
– Create Folder for semantic function inside the skills folder ie ‘/plugin/AzureDevops’, in this case “FeatureDescription” (For more details on functions)
2. Define semantic function
– Once we have folder structure in place lets define the function by having
‘config.json’ with below JSON content for more details on content refer here.
{
  "schema": 1,
  "description": "get standard feature title and description",
  "type": "completion",
  "completion": {
    "max_tokens": 500,
    "temperature": 0.0,
    "top_p": 0.0,
    "presence_penalty": 0.0,
    "frequency_penalty": 0.0
  },
     "input": {
          "parameters": [
               {
               "name": "input",
               "description": "The feature name.",
               "defaultValue": ""
               }
          ]
     }
}
In above file, we are defining semantic function which accept ‘input’ parameter to perform “get standard feature title and description” as mentioned in Description section.
– Now, let’s put the single shot prompt for our semantic function in ‘skprompt.txt’. where ‘{{input}}’ where our input ask would be replaced.
Create feature title and description for {{$input}}  in below format
Feature Title:"[Prodive a short title for the feature]"
Description: "[Provide a more detailed description of the feature's purpose, the problem it addresses, and its significance to the product or project.]

User Needs-
[Outline the specific user needs or pain points that this feature aims to address.]

Functional Requirements:-
- [Requirement 1]
- [Requirement 2]
- [Requirement 3]
- ...

Non-Functional Requirements:-
- [Requirement 1]
- [Requirement 2]
- [Requirement 3]
- ...

Feature Scope:
[Indicates the minimum capabilities that feature should address. Agreed upon between Engineering Leads and Product Mangers] "
Execute above semantic function in action.
– Rename “.env.example’ as ‘.env’ and update the parameters with actual values
– Open notebook “Create-Azure-Devops-feature-from-requirement-text” in visual studio code and follow the steps mentioned to test
– Step 1 Install all python libraries
!python -m pip install semantic-kernel==0.3.10.dev0
!python -m pip install azure-devops
– Step 2 Import Packages required to prepare a semantic kernel instance first.
import os
from dotenv import dotenv_values
import semantic_kernel as sk
from semantic_kernel import ContextVariables, Kernel # Context to store variables and Kernel to interact with the kernel
from semantic_kernel.connectors.ai.open_ai import AzureChatCompletion, OpenAIChatCompletion # AI services
from semantic_kernel.planning.sequential_planner import SequentialPlanner # Planner

kernel = sk.Kernel() # Create a kernel instance
kernel1 = sk.Kernel() #create another kernel instance for not having semanitc function in the same kernel

useAzureOpenAI = True

# Configure AI service used by the kernel
if useAzureOpenAI:
    deployment, api_key, endpoint = sk.azure_openai_settings_from_dot_env()
    kernel.add_chat_service("chat_completion", AzureChatCompletion(deployment, endpoint, api_key))
    kernel1.add_chat_service("chat_completion", AzureChatCompletion(deployment, endpoint, api_key))
else:
    api_key, org_id = sk.openai_settings_from_dot_env()
    kernel.add_chat_service("chat-gpt", OpenAIChatCompletion("gpt-3.5-turbo", api_key, org_id))
– Step 3 Importing skills and function from folder
# note: using skills from the samples folder
plugins_directory = "./plugins"

# Import the semantic functions
DevFunctions=kernel1.import_semantic_skill_from_directory(plugins_directory, "AzureDevOps")
FDesFunction = DevFunctions["FeatureDescription"]
– Step 4 calling the semantic function with feature title to generate feature description based on predefined template
resultFD = FDesFunction("Azure Resource Group Configuration Export and Infrastructure as Code (IAC) Generation")
print(resultFD)
Create native function to create features in Azure DevOps
– Create file “native_function.py” under “AzureDevOps” or download the file from repo.
– Copy the code base and update Azure Devops parameter. you can access this as context parameter but for simplicity of this exercise, we kept it as hardcoded. Please find below code flow
– Importing python packages
– Defining class ‘feature‘ and native function as “create” under “@sk_function”.
– Call semantic function to generate feature description.
– Use this description to create Azure DevOps feature.
from semantic_kernel.skill_definition import (
    sk_function,
    sk_function_context_parameter,
)

from semantic_kernel.orchestration.sk_context import SKContext
from azure.devops.v7_1.py_pi_api import JsonPatchOperation

from azure.devops.connection import Connection
from msrest.authentication import BasicAuthentication
import base64
from semantic_kernel import ContextVariables, Kernel
import re
class feature:
    def __init__(self, kernel: Kernel):
        self._kernel = kernel
    _function(
        description="create a Azure DevOps feature with description",
        name="create",
    )
    _function_context_parameter(
        name="title",
        description="the tile of the feature",
    )
    _function_context_parameter(
        name="description",
        description="Description of the feature",
    )
    async def create_feature(self, context: SKContext) -> str:
        feature_title = context["title"]
        get_feature = self._kernel.skills.get_function("AzureDevOps", "FeatureDescription")
        fdetails = get_feature(feature_title)
        # Define a regular expression pattern to match the feature title
        pattern = r"Feature Title:s+(.+)"
        # Search for the pattern in the input string
        match = re.search(pattern, str(fdetails))
        # Check if a match was found
        if match:
            feature_title = match.group(1)
        # Define a regular expression pattern to match the feature description
        # Split the string into lines
        lines = str(fdetails).split('n')
        lines = [line for index, line in enumerate(lines) if index not in [0]]
        description = 'n'.join(lines)
        jsonPatchList = []
        #description=context["description"]
        targetOrganizationName= "XXX"
        targetProjectName= "test"
        targetOrganizationPAT = "XXXXXX"
        workItemCsvFile= "abc"
        teamName = "test Team"
        areaName = teamName
        iterationName ="Sprint 1"
        targetOrganizationUri='https://dev.azure.com/'+targetOrganizationName
        credentials = BasicAuthentication('', targetOrganizationPAT)
        connection = Connection(base_url=targetOrganizationUri, creds=credentials)
        userToken = "" + ":" + targetOrganizationPAT
        base64UserToken = base64.b64encode(userToken.encode()).decode()
        headers = {'Authorization': 'Basic' + base64UserToken}
        core_client = connection.clients.get_core_client()
        targetProjectId = core_client.get_project(targetProjectName).id
        workItemObjects = [
                {
                    'op': 'add',
                    'path': '/fields/System.WorkItemType',
                    'value': "Feature"
                },
                {
                    'op': 'add',
                    'path': '/fields/System.Title',
                    'value': feature_title
                },
                {
                    'op': 'add',
                    'path': '/fields/System.State',
                    'value': "New"
                },
                {
                    'op': 'add',
                    'path': '/fields/System.Description',
                    'value': description
                },
                {
                    'op': 'add',
                    'path': '/fields/Microsoft.VSTS.Common.AcceptanceCriteria',
                    'value': "acceptance criteria"
                },
                {
                    'op': 'add',
                    'path': '/fields/System.IterationPath',
                    'value': targetProjectName+""+iterationName
                }
            ]
        jsonPatchList = JsonPatchOperation(workItemObjects)
        work_client = connection.clients.get_work_item_tracking_client()
        try:
            WorkItemCreation = work_client.create_work_item(jsonPatchList.from_, targetProjectName, "Feature")
        except Exception as e:
            return feature_title+"Feature created unsuccessfully"
        return feature_title+" Feature created successfully"
Let’s execute native function
Let’s go back to notebook.
– Step 5 Importing native function
from plugins.AzureDevops.native_function import feature
math_plugin = kernel.import_skill(feature(kernel1), skill_name="AzureDevOps")
variables = ContextVariables()
– Step 6 Executing native function by putting natural language queries in title field
variables["title"] = "creating a nice pipelines"
variables["description"] = "test"
result = await kernel.run_async(
                math_plugin["create"], input_vars=variables
            )
print(result)
Use of Sequential planner to dynamical create N number of features.
– Step 6 Initiate sequential planner with semantic kernel
from plugins.AzureDevops.native_function import feature
planner = SequentialPlanner(kernel)
# Import the native functions
AzDevplugin = kernel.import_skill(feature(kernel1), skill_name="AzureDevOps")
ask = "create two Azure DevOps features for one with title creating user and one with creating work items with standard feature title and description"
plan = await planner.create_plan_async(goal=ask)
for step in plan._steps:
        print(step.description, ":", step._state.__dict__)
This would generate a plan to meet the goal which is above case is “create two Azure DevOps features for one with title creating user and one with creating work items with standard feature title and description” using available function in kernel.
– Step 7 once the plan is created, we can use this plan and execute it to create multiple features.
print("Plan results:")
result = await plan.invoke_async(ask)
for step in plan._steps:
        print(step.description, ":", step._state.__dict__)
This will create two features one for user and one for work item. Using this block, you can create a semantic function-based solution that can interpret natural language requirement document or transcript of reequipment call and use it to create features in azure DevOps. You can increase the accuracy of this solution by brining multi-shot prompt and historical data using collections.
by Contributed | Sep 22, 2023 | Technology
This article is contributed. See the original author and article here.
We’ve got several new capabilities to announce with our September service release (2309), including Microsoft Intune Suite Remote Help expanding to macOS and enhancements to Remote Help for Windows. We’re releasing the Zebra Lifeguard Over-the-Air integration with Intune, which we offered for public preview in May, and we’ve added more than 30 settings for Apple devices, part of our ongoing effort to ensure Intune has Day zero support for the latest Apple releases. Finally, we’ve released Microsoft Intune Endpoint Privilege Management for Windows 365 devices so customers can facilitate elevations for users on Cloud PC devices.
Your feedback is important! Please let us know your thoughts on these new developments by commenting on this post or connecting with me on LinkedIn.
Advancing Remote Help
This month, we’re expanding the capabilities of Remote Help to make it easier for helpdesk agents to assist users and solve issues remotely.
Firstly, Remote Help is now available on macOS! We’ve heard from customers that this is an essential feature of the Microsoft Intune Suite, and we’re excited to expand this capability to macOS. Helpdesk staff on macOS can now connect in view-only sessions to assist macOS users remotely.
Additionally, we’re now offering the ability to launch Remote Help for Windows from the Intune admin center. With this capability, helpdesk agents can seamlessly launch Remote Help on both their device and the user’s. Previously, both the helpdesk and the user had to launch Remote Help on their devices manually. With the new capability, the user receives a notification on their device that the helpdesk agent wants to begin a Remote Help session making it a more streamlined experience.
Intune integration with Zebra LifeGuard OTA
This month, as part of our efforts to improve the experience for frontline workers, the Zebra LifeGuard Over-the-Air (LG OTA) integration with Intune moves from public preview to generally available. With this firmware over-the-air (FOTA) solution, IT admins can update ruggedized Zebra Android devices securely and efficiently without physical access to the devices.
Zebra device updates are managed from the Intune admin center and distributed wirelessly. This makes it easier to keep devices up to date, prevents compatibility issues for users, and reduces security risks. Customers have been asking for the ability to use Intune to manage Zebra devices, and we’re happy to deliver!
New Apple features and iOS/iPadOS 17 and macOS 14 release
We’re always working to improve the Intune experience for Apple users—including for the latest operating systems. With the Apple release of iOS 17.0 and macOS 14.0, our goal is to ensure that Microsoft Intune can provide Day zero support so that features work seamlessly. As part of this effort, we’ve improved the settings catalog and simplified and expedited settings updates for IT admins and users.
To prepare for the releases, we’ve provided many additional settings for Apple devices. We’re aiming to speed up response time and bring these settings in as quickly as possible. Now, we can provide them in a matter of hours instead of months, which is critical as features and capabilities are added to address new Apple releases. The latest batch includes more than 30 additional settings. The settings catalog for macOS, iOS, and iPadOS lists all the settings admins can configure in a device policy.
EPM for Windows 365 devices
Microsoft Intune Endpoint Privilege Management (EPM), part of the Microsoft Intune Suite, enables IT admins to selectively allow applications to run with administrative privileges. Organizations can now facilitate elevations for users on Cloud PC devices via EPM enabling users to easily elevate approved applications without the need for full administrative rights on their Windows device. This means greater efficiency and security for your organization.
Let us know how we’re doing!
Your comments help us improve. Let us know how our new features are working for you by commenting on this post or connect with me on LinkedIn. Stay tuned for more announcements next month!
by Contributed | Sep 21, 2023 | Technology
This article is contributed. See the original author and article here.
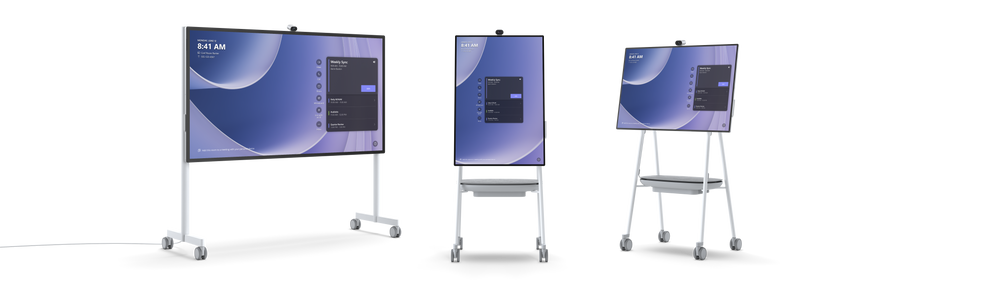
In the constantly evolving landscape of modern work, success involves effective meetings and a collaborative workforce. Microsoft understands this well and has introduced Surface Hub 3, an all-in-one hybrid meeting and collaboration device set to transform the way we work.
With this device – the only collaboration board designed end-to-end by Microsoft – we are offering consistency and simplicity to organizations that have Surface Hubs and other Microsoft Teams Rooms in their spaces, while delivering the most options for active collaboration so that teams can get more done.
Learn more about Surface Hub 3 from Sonia and me in our YouTube video!
Unified Microsoft Teams Rooms Experience
Surface Hub 3 is joining the Microsoft Teams Rooms family as an all-in-one Teams Rooms board running Teams Rooms on Windows. This means that with a consistent experience across all meeting spaces now, your team can effortlessly transition from one room to another, whether the space features the streamlined, touch-first interface on Surface Hub 3 or the traditional console-based Teams Rooms setup. This also means Surface Hub 3 now supports long-requested features by Hub customers—including persistent chat, the Front Row layout (which looks particularly beautiful on the 85” screen), and more. And, going forward, customers can look forward to newly released Teams Rooms features now also coming to Surface Hub on Day 1.
Immersive Meeting Experience
Surface Hub 3 brings a wave of new capabilities.
- Smart Rotation and Portrait: physically rotate Surface Hub 3 50” between Portrait or Landscape at any time to adapt the screen layout to suit your needs, whether for a natural Whiteboarding session or a more personable one-on-one call.
- Mobility and Versatility: The Surface Hub 3 50” is fully mobile on a Steelcase Roam Stand* , offering flexibility in deployment. Choose from a variety of stands and wall-mounting solutions from Steelcase and our Designed for Surface partners. With the APCTM Charge Mobile Battery* , the Surface Hub 3 50” can be taken virtually anywhere in the building.
- Premium Design: Surface Hub 3 prioritizes inclusive meetings with clear audio and visuals. The high-resolution, 4K PixelSense display with an anti-glare coating makes content visible in any lighting condition.
- Intelligent Audio: The Surface Hub 3 50” features two microphone arrays and speaker pairings. Smart AV optimizes audio based on device orientation, delivering the best stereo experience whether in Portrait or Landscape.
- Seamless Integration: Surface Hub 3 pairs with Microsoft Teams Rooms certified peripherals in larger conference rooms, thanks to the Microsoft Teams Rooms on Windows platform. This creates a world of possibilities for different meeting spaces, from traditional setups to large classrooms, with external microphones, speakers, cameras, and more.
- Enhanced Collaboration: Surface Hub 3 supports active inking with up to two Surface Hub Pens or Surface Slim pens, providing 20 points of multitouch for immersive on-device collaboration. Built-in palm rejection ensures a natural interaction experience.
- Faster Performance: with a 60% CPU performance increase, and a 160% GPU graphics performance increase gen-on-gen, Surface Hub 3 customers will enjoy a more powerful system that is also primed to capitalize on future software innovation. With these capabilities and more, Surface Hub 3 revolutionizes meetings, offering a versatile and inclusive solution for modern workspaces.

1:1 video chat in Portrait on Surface Hub 3 50”
AI-Powered Meetings and Brainstorming
Surface Hub 3 enables customers to leverage AI more than ever to enhance hybrid meetings and collaboration sessions. For example, Cloud IntelliFrame** allows remote attendees to see in-person Surface Hub users more clearly through a smart video feed that separates participants into individual boxes and helps remove distractions. Video segmentation with a unified background in Front Row uses AI to foster inclusion by removing backgrounds and adjusting video sizes, so remote attendees are literally on the same level with each other.** And in the future, Surface Hub 3 will take brainstorming to a new level with AI-powered features from Microsoft Copilot. Copilot in Whiteboard on Surface Hub will help generate and organize ideas efficiently, freeing up time for your team to focus on creative ideation. Stay tuned for more details.

Copilot in Whiteboard, and video segmentation with a unified background, both in Front Row on Surface Hub 3 85”
Streamlined IT Management
As an IT professional, managing devices in your organization can be a complex task. Surface Hub 3 reduces IT complexity with a streamlined management experience through Microsoft Teams admin center and the new Microsoft Teams Rooms Pro Management Portal**. This allows you to manage all devices seamlessly, making your job easier and ensuring a hassle-free experience for your users.

Microsoft Teams admin center, managing Teams Rooms on Windows
Easy Transition and Support
In-market Surface Hub 2S devices can upgrade to the full Surface Hub 3 experience with the Surface Hub 3 Pack. Starting next year, software migration will also be available for Surface Hub 2S devices to move to Microsoft Teams Rooms on Windows. For those customers continuing to run Windows 10 Team edition on their Surface Hub 2S devices, support for that OS will continue until October 14, 2025.

The Surface Hub 3 Pack is easy to swap into both 50” & 85” Surface Hub 2S devices
Innovation is at the heart of our journey, from our origins over a decade ago with Perceptive Pixel and PixelSense to Surface Hub 3. As we continue to push the limits of what’s possible in meetings and teamwork, Surface Hub 3 stands ready to empower your organization for the modern workplace.
Preorder now to elevate your meeting room experience to new heights and embrace the future of collaboration!
*Steelcase Mobile Roam Stand and Schnieder Electric, APC Charge Mobile Battery sold separately
**Software license required. Sold separately.

Recent Comments