This article is contributed. See the original author and article here.
If you are looking for a step-by-step guide on how to enable authentication for your Azure Kubernetes Service (AKS) cluster, you may have encountered some challenges. The documentation on this topic is scarce and often outdated or incomplete. Moreover, you may have specific requirements for your use case that are not covered by the existing resources. That is why I have created this comprehensive guide using the latest Azure cloud resources.
In this guide, you will learn how to set up an AKS cluster and provide authentication to that cluster using NGINX and the OAuth2 proxy. This guide is intended for educational purposes only and does not guarantee proper authentication as certified by NIST. It is also not a complete solution for securing your AKS cluster, which involves more than just authentication. Therefore, this guide should be used as a learning tool to help you understand how authentication works and how to implement it using Azure.
By following this guide, you will be able to set up an AKS cluster with authentication using NGINX, OAuth2 Proxy, and Microsoft Entra ID. You will not need a domain name as we will use a fully qualified domain name (FQDN). However, you can also use a domain name if you prefer. Additionally, we will use Let’s Encrypt for TLS certificates so that our application will use HTTPS.
Additionally, I have broken this guide into several parts. This is the first part where you will be guided through the creation of your AKS cluster and the initial NGINX configuration. I will provide the remaining parts in future posts.
To learn how to use NGINX with Oauth2 Proxy, I conducted thorough online research and consulted various tutorials, guides, and other sources of information. The following list contains some of the most helpful references that I used to create this guide. You may find them useful as well if you need more details or clarification on any aspect of this topic.
Before you begin, you will need to meet the following prerequisites:
Azure CLI or Azure PowerShell
An Azure subscription
An Azure Resource Group
Create an Azure Container Registry (ACR)
To create an Azure container registry, you can follow the steps outlined in the official documentation here Create a new ACR. An Azure container registry is a managed Docker registry service that allows you to store and manage your private Docker container images and related artifacts. For now I’ll set up an ACR using PowerShell:
The command above will configure the appropriate AcrPull role for the managed identity and allows you to authorize an existing ACR in your subscription. A managed identity from Microsoft Entra ID allows your app to easily access other Microsoft Entra protected resources.
Validate the Deployment
We will verify the deployment using the Kubernetes command line client. Ensure that you have this tool installed by running the following command.
Install-Module Az.Aks
Configure the kubectl client to connect to your Kubernetes cluster. The following command downloads credentials and configures the Kubernetes CLU to use them.
Verify the connection to your cluster by running the following command.
kubectl get nodes
You should see some output with the name of the nodes on your cluster.
NGINX Ingress controller configuration
Now that we have our AKS cluster up and running with an attached ACR we can configure our ingress controller NGINX. The NGINX ingress controller provides a reverse proxy for configurable traffic routing and TLS termination. We will utilize NGINX to fence off our AKS cluster providing a public IP address accessible through the load balancer which we can then assign a FQDN for accessing our applications. Additionally, we can configure NGINX to integrate with Microsoft Entra ID for authenticating users via an OAuth2 Proxy. Those details will be shared in a later post. You can follow the basic configuration for an ingress controller on the official documentation here Create an unmanaged ingress controller.
Before configuration begins, make sure you have Helm installed. Then run the following commands.
Now that you have configured and installed the NGINX ingress controller you can check the load balancer. Run the following command.
kubectl get services --namespace ingress-basic -o wide -w ingress-nginx-controller
You should see some output. When Kubernetes creates the load balancer service a public IP address is assigned. You can view the IP address under the column EXTERNAL-IP. Make note of this IP address. If you browse to that IP address you should get a 404 Not Found.
This wraps up the first part of this series. In the next part I will go over deploying two applications and creating the ingress routes to route to the applications. Then we will move on to setting up cert manager and getting things ready for our OAuth2 Proxy provider.
This article is contributed. See the original author and article here.
Developers across the world are building innovative generative AI solutions since the launch of Azure OpenAI Service in January 2023. Over 53,000 customers globally harness the capabilities of expansive generative AI models, supported by the robust commitments of Azure’s cloud and computing infrastructure backed by enterprise grade security.
Today, we are thrilled to announce many new capabilities, models, and pricing improvements within the service. We are launching Assistants API in public preview, new text-to-speech capabilities, upcoming updated models for GPT-4 Turbo preview and GPT-3.5 Turbo, new embeddings models and updates to the fine-tuning API, including a new model, support for continuous fine-tuning, and better pricing. Let’s explore our new offerings in detail.
Build sophisticated copilot experiences in your apps with Assistants API
We are excited to announce, Assistants, a new feature in Azure OpenAI Service, is now available in public preview. Assistants API makes it simple for developers to create high quality copilot-like experiences within their own applications. Previously, building custom AI assistants needed heavy lifting even for experienced developers. While the chat completions API is lightweight and powerful, it is inherently stateless, which means that developers had to manage conversation state and chat threads, tool integrations, retrieval documents and indexes, and execute code manually. Assistants API, as the stateful evolution of the chat completion API, provides a solution for these challenges.
Building customizable, purpose-built AI that can sift through data, suggest solutions, and automate tasks just got easier. The Assistants API supports persistent and infinitely long threads. This means that as a developer you no longer need to develop thread state management systems and work around a model’s context window constraints. Once you create a Thread, you can simply append new messages to it as users respond. Assistants can access files in several formats – either while creating an Assistant or as part of Threads. Assistants can also access multiple tools in parallel, as needed. These tools include:
Code Interpreter: This Azure OpenAI Service-hosted tool lets you write and run Python code in a sandboxed environment. Use cases include solving challenging code and math problems iteratively, performing advanced data analysis over user-added files in multiple formats and generating data visualization like charts and graphs.
Function calling: You can describe functions of your app or external APIs to your Assistant and have the model intelligently decide when to invoke those functions and incorporate the function response in its messages.
Support for new features, including an improved knowledge retrieval tool, is coming soon.
Assistants API is built on the same capabilities that power OpenAI’s GPT product and offers unparalleled flexibility for creating a wide range of copilot-like applications. Use cases range AI-powered product recommender, sales analyst app, coding assistant, employee Q&A chatbot, and more. Start building on the no-code Assistants playground on start building with the API.
As with the rest of our offerings, data and files provided by you to the Azure OpenAI Service are not used to improve OpenAI models or any Microsoft or third-party products or services, and developers can delete the data as per their needs. Learn more about data, privacy and security for Azure OpenAI Service here. We recommend using Assistants with trusted data sources. Retrieving untrusted data using Function calling, Code Interpreter with file input, and Assistant Threads functionalities could compromise the security of your Assistant, or the application that uses the Assistant. Learn about mitigation approaches here.
Fine-tuning: New model support, new capabilities, and lower prices
Since we announced Azure OpenAI Service fine-tuning for OpenAI’s Babbage-002, Davinci-002 and GPT-35-Turbo on October 16, 2023, we’ve enabled AI builders to build custom models. Today we’re releasing fine-tuning support for OpenAI’sGPT-35-Turbo 1106, a next gen GPT-3.5 Turbo model with improved instruction following, JSON mode, reproducible outputs, parallel function calling, and more. Fine-tuning with GPT-35-Turbo 1106 supports 16k context length in training data, allowing you to fine-tune with longer messages and generate longer and more coherent texts.
In addition, we are introducing two new features to enable you to create more complex custom models and easily update them. First, we are launching support for fine-tuning with function calling that enables you to teach your custom model when to make function calls and improve the accuracy and consistency of the responses. Second, we are launching support for continuous fine-tuning, which allows you to train a previously fine-tuned model with new data, without losing the previous knowledge and performance of the model. This lets you add additional training data to an existing custom model without starting from scratch and lets you experiment more iteratively.
Besides new model support and features, we are making it more affordable for you to train and host your fine-tuned models on Azure OpenAI Service, including decreasing the cost of training and hosting GPT-35-Turbo by 50%.
Coming soon: New models and model updates
The following models and model updates are coming this month to Azure OpenAI Service. You can review the latest model availability here.
Updated GPT-4 Turbo preview and GPT-3.5 Turbo models
We are rolling out an updated GPT-4 Turbo preview model, gpt-4-0125-preview, with improvements in tasks such as code generation and reduced cases of “laziness” where the model doesn’t complete a task. The new model fixes a bug impacting non-English UTF-8 generations. Post-launch, we’ll begin updating Azure OpenAI deployments that use GPT-4 version 1106-preview to use version 0125-preview. The update will start two weeks after the launch date and complete within a week. Because version 0125-preview offers improved capabilities,customers may notice some changes in the model behavior and compatibility after the upgrade. Pricing for gpt-4-0125-preview will be same as pricing for gpt-4-1106-preview.
In addition to the updated GPT-4 Turbo, we will also be launching GPT-3.5-turbo-0125, a new GPT-3.5 Turbo model with improved pricing and higher accuracy at responding in various formats. We will reduce input prices for the new model by 50% to $0.0005 /1K tokens and output prices by 25% to $0.0015 /1K tokens.
New Text-to-Speech (TTS) models
Our new text-to-speech model generates human-quality speech from text in six preset voices, each with its own personality and style. The two model variants include tts-1, the standard voices model variant, which is optimized for real-time use cases, and tts-1-hd, the high-definition (HD) equivalent, which is optimized for quality. This new includes capabilities such as building custom voices and avatars already available in Azure AI and enables customers to build entirely new experiences across customer support, training videos, live-streaming and more. Developers can now access these voices through both services, Azure OpenAI Service and Azure AI Speech.
A new generation of embeddings models with lower pricing
Azure OpenAI Service customers have been incorporating embeddings models in their applications to personalize, recommend and search content. We are excited to announce a new generation of embeddings models that are significantly more capable and meet a variety of customer needs. These models will be available later this month.
text-embedding-3-small is a new smaller and highly efficient embeddings model that provides stronger performance compared to its predecessor text-embedding-ada-002. Given its efficiency, pricing for this model is $0.00002 per 1k tokens, a 5x price reduction compared to that of text-embedding-ada-002. We are not deprecating text-embedding-ada-002 so you can continue using the previous generation model, if needed.
text-embedding-3-large is our new best performing embeddings model that creates embeddings with up to 3072 dimensions. This large embeddings model is priced at $0.00013 / 1k tokens.
Both embeddings models offer native support for shortening embeddings (i.e. remove numbers from the end of the sequence) without the embedding losing its concept-representing properties. This allows you to make trade-off between the performance and cost of using embeddings.
What’s Next
It has been great to see what developers have built already using Azure OpenAI Service. You can further accelerate your enterprise’s AI transformation with the products we announced today. Explore the following resources to get started or learn more about Azure OpenAI Service.
Get started with Azure OpenAI Assistants (preview)
Speed up developing with the Assistants API with the code samples in the Assistants GitHub repo
This article is contributed. See the original author and article here.
We are thrilled to announce that this newsletter edition officially marks one full year of Logic Apps’ Ace Aviators! From our initial newsletter and livestream in February of last year, it’s been an incredible journey witnessing this community take flight. Of course, none of this smooth flying would have been possible without YOU! So, to all our aviators, thank you for reading, watching, and participating this past year. Make sure to keep sharing and posting to #LogicAppsAviators so we can continue to navigate the skies of innovation together.
What is your role and title? What are your responsibilities associated with your position?
Although my title is Solution Architect, my role is of Practice/Competency Lead, and I lead the Microsoft Integration practice (I’m responsible for leading and growing our expertise) within Birlasoft Limited. My role is multifaceted, encompassing strategic leadership, team development, client engagement, and operational excellence.
Below is a breakdown of my responsibilities:
Strategic Leadership:
Defining the vision and direction for the practice, aligning it with the overall organizational strategy.
Identifying and pursuing growth opportunities, including new markets, services, and partnerships.
Staying abreast of industry trends and innovations to ensure our practice remains competitive (I’m not at my best now, but I’m taking steps to improve).
Team Development:
Building and nurturing a high-performing team of experts in our practice area.
Providing mentorship and coaching to help team members develop their skills and expertise.
Fostering a collaborative and innovative work environment.
Client Engagement:
Building strong relationships with clients and understanding their needs and challenges.
Developing and delivering high-quality solutions that meet client requirements.
Managing client expectations and ensuring their satisfaction.
Operational Excellence:
Establishing and maintaining efficient processes and workflows within the practice.
Managing budgets and resources effectively.
Measuring and monitoring key performance indicators (KPIs) and driving continuous improvement.
Overall, my goal is to lead the Microsoft Integration Practice to success by delivering exceptional value to our clients, developing our team, and contributing to the growth of the organization.
Can you provide some insights into your day-to-day activities and what a typical day in your role looks like?
Typical days begin with a coffee-fueled review of emails, calendar, and upcoming meetings, deadlines, and calls. A substantial portion of the day is then dedicated to collaborative meetings with project teams and clients, focusing on progress updates, challenge resolution, and recommendation presentations. Drafting proposals for new RFPs/RFIs or executing ongoing project plans occupies another significant segment of the workday. As the practice lead, I am also prepared to address any ad-hoc requests or situations that may arise within the practice.
The positive response to our proposals, built on strong customer focus and industry best practices, has ignited growth in the Birlasoft Integration Practice. To capitalize on this momentum, I’m busy interviewing and assembling a team of exceptional individuals. It’s an honor to be part of this thriving practice (and I can’t wait to see what we achieve together)!
So, my day involves doing development work, working on POC/RFP/RFI, solution designing, Interviews, handling escalations, mentoring team, resources, and project planning etc.
What motivates and inspires you to be an active member of the Aviators/Microsoft community?
I am a very strong believer in The Value of Giving Back and by nature I like helping people (as much as I can).
What Inspired: When I had started learning BizTalk, I took lot of help from the community written articles and Microsoft documentation. I will be very honest, although Microsoft documentation is very apt but the articles written by community members were more easy to understand, had a different perspective, simple ways to explain etc.
And that’s how I started with an intention of helping people like me by sharing whatever limited knowledge I have in a simplified manner (at least I try to) by various means – answering on forums, writing articles etc. I maintain a blog Techfindings…by Maheshkumar Tiwari through which I share my findings/learnings and it’s been over a decade I am doing it, over LinkedIn/Facebook answering individuals to their questions, also sometimes on groups.
What Motivates: When you receive mail/message/thank you note from someone you don’t know, saying that the content really helped them – to solve the problem, to crack the interview, to clear the understanding etc. — It warms my heart more than any award. It’s the fuel that keeps me creating, knowing I’m truly touching lives.
Looking back, what advice do you wish you would have been told earlier on that you would give to individuals looking to become involved in STEM/technology?
While theoretical knowledge is important, prioritize developing practical skills like coding, data analysis, project management, and problem-solving. Don’t wait for the “perfect” moment or project to begin. Try mini-projects, tinker with code, participate in online challenges. While doing this embrace failures as learning opportunities and steppingstones to improvement.
No one knows everything, and reaching out for help is a sign of strength, not weakness. Seek guidance from seniors, peers, online communities, or any available resources.
Focus on the joy of learning, exploring, and problem-solving, not just achieving a specific degree or job title. Curiosity and a love for understanding how things work will fuel your passion and resilience through challenges.
What are some of the most important lessons you’ve learned throughout your career?
The only thing which is constant is Change – the sooner we accept it and develop/have a mindset to adapt, the better it is.
Survival of the fittest is applicable to every phase of personal/professional life. You really can’t blame others.
Maintaining a healthy balance between work and personal life (unfortunately I am failing in this), practicing self-care, and managing stress are crucial for long-term success.
Building a successful career takes time, dedication, and perseverance. Set realistic goals, celebrate milestones, and don’t get discouraged by setbacks.
Enjoy the process, keep learning, and adapt to the ever-changing field.
Imagine you had a magic wand that could create a feature in Logic Apps. What would this feature be and why?
Without a second thought, following is what I would have created – A wizard which asks me questions about my workflow requirement and once the questionnaire ends, complete workflow should be presented.
Well, that’s from magic wand perspective :smiling_face_with_smiling_eyes:, but above is very much doable.
But, as of now following are the things which we can do at present (few points are from my team – want to share maximum ideas to make Logic app more robust)
Logic Apps should have a feature of disabling the actions from designer. This will help developers in unit testing the code efficiently. We can achieve this by commenting out Json in code view or by creating a backup workflow but that’s a tedious task.
Versioning missing in Azure standard Logic Apps
Breakpoint option should be enabled, so that it will help in debugging.
Retry from the failed step should be extended to loops and parallel branches as well
Need out of box support for Liquid Map debugging, Intellisense support would be also good to have
For now only Json schema is supported in http trigger, if xml support can be added to it.
CRON expression support in Logic app recurrence trigger
Reference documentation as to which WS plan should one choose based on number of workflows, volume of messages processed etc.(will help to justify the cost to clients)
Exact error capture for actions within loop/action within a scope inside a scope etc.
Support for partial deployment of workflows in a single logic app (adding only the new workflows and not overwrite all)
Check out this customer success story about Datex leveraging Microsoft Azure Integration Services to transform its infrastructure for a more modern solution. Azure Integration Services played a crucial role in enabling flexible integrations, data visualization through Power BI, and efficient electronic data integration (EDI) processes using Azure Logic Apps. Read more in this article about how AIS helped provide Datex with a low-code environment, faster time-to-market, cost savings, and enhanced capabilities.
Take a deeper dive into the new target-based scaling for Azure Logic Apps Standard update and how it can help you manage your application’s performance with asynchronous burst loads.
Read more on how Azure Logic Apps can unlock scenarios where it’s required to integrate with IBM i applications in another Mission Critical Series episode.
Struggling to manage your application settings during development and testing, especially when switching between local and cloud environments? Watch Sri’s video to learn how to efficiently manage your app settings.
This article is contributed. See the original author and article here.
Microsoft Defender for Cloud
Monthly news
February2024 Edition
This is our monthly “What’s new” blog post, summarizing product updates and various new assets we released over the past month. In this edition, we are looking at all the goodness from January 2024.
Legend:
Product videos
Webcasts (recordings)
Docs on Microsoft
Blogs on Microsoft
GitHub
External content
Product improvements
Announcements
Microsoft Defender for Cloud
We’re announcing the release of Defender for Cloud’s agentless malware detection for Azure virtual machines (VM), AWS EC2 instances and GCP VM instances, as a new feature included in Defender for Servers Plan 2. Agentless malware detection for VMs is now included in our agentless scanning platform. Agentless malware scanning utilizes Microsoft Defender Antivirus anti-malware engine to scan and detect malicious files. Any detected threats, trigger security alerts directly into Defender for Cloud and Defender XDR, where they can be investigated and remediated. The Agentless malware scanner complements the agent-based coverage with a second layer of threat detection with frictionless onboarding and has no effect on your machine’s performance.
We’re announcing the general availability (GA) of the integration between Defender for Cloud and Microsoft Defender XDR (formerly Microsoft 365 Defender). The integration brings competitive cloud protection capabilities into the Security Operations Center (SOC) day-to-day. With Microsoft Defender for Cloud and the Defender XDR integration, SOC teams can discover attacks that combine detections from multiple pillars, including Cloud, Endpoint, Identity, Office 365, and more.
Container security is an integral part of Microsoft Defender for Cloud, a Cloud Native Application Platform (CNAPP) as it addresses the unique challenges presented by containerized environments, providing a holistic approach to securing applications and infrastructure in the cloud-native landscape. As organizations embrace multicloud, the silos between cloud environments can become barriers for a holistic approach to container security. Defender for Cloud continues to adapt, offering new capabilities that resonate with the fluidity of multicloud architecture. Our latest additions to AWS and GCP seamlessly traverse cloud silos and provide a comprehensive and unified view of container security posture.
In this blog we dive deep into agentless container security for AWS and GCP.
We have added nine new Azure security recommendations aligned with the Microsoft Cloud Security Benchmark. These new recommendations are currently in public preview.
Cybersecurity risks pose a significant threat to organizations of all sizes. As a result, security teams must be diligent in their efforts to protect their networks and data from potential breaches. However, with the increasing complexity of the digital environment and the expanding attack surface, security teams are faced with more and more tasks to improve the organization’s posture as well as investigating potential incidents. This can lead to critical security risks being overlooked or delayed, leaving organizations vulnerable to cyber-attacks. It becomes increasingly more important to estimate the risk created by the security issues in the environment’s configuration and to prioritize their mitigation correctly.
Prioritized cyber risks allow security teams to focus their efforts and resources on the most critical threats, ensuring that they are addressed promptly and effectively, which ultimately helps to reduce the organization’s overall risk profile.
In this article we discuss a new feature in Defender CSPM helping customers to rank the security issues in their environment configuration and fix them accordingly. This feature is based on the presented framework and enhances the risk prioritization capabilities of Defender CSPM.
While containers have revolutionized modern software development, the complexity of dependencies in containerized environments and the expanded attack surface they present are still significant hurdles for security professionals. The initial step in securing these environments involves identifying vulnerabilities within container images. Yet, the most time-consuming task can often be identifying the right development team to address these vulnerabilities, particularly the mission-critical ones. Microsoft Defender for Cloud addresses this critical need with its container mapping feature. This blog post explores how Defender for Cloud streamlines the process of tracing vulnerabilities in container images back to their origins in CI/CD pipelines, specifically within Azure DevOps and GitHub environments. This functionality is key to facilitating effective developer remediation workflows, thereby enhancing the security posture of cloud-native applications.
This blog post explores how Defender for Cloud streamlines the process of tracing vulnerabilities in container images back to their origins in CI/CD pipeline to facilitate the vulnerability remediation process.
Microsoft Defender for Servers plans require Azure Arc deployment on AWS/GCP machines. This interactive workbook provides an overview of machines in your environment showing their Azure Arc Connected Machine agent deployment status.
Note: If you want to stay current with Defender for Cloud and receive updates in your inbox, please consider subscribing to our monthly newsletter: https://aka.ms/MDCNewsSubscribe
This article is contributed. See the original author and article here.
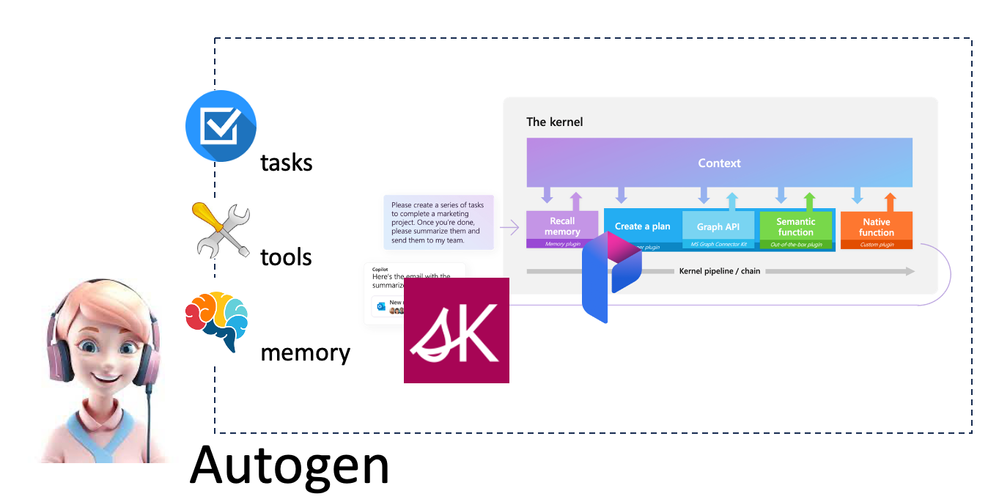
Do you know about AI Agents? How to apply AI Agents in different scenarios? For AI Agents, Microsoft released the open source framework Autogen. But what is its relationship with Semantic Kernel and Prompt flow? I hope this series can answer your questions. Let everyone have a clear understanding of AI Agents, how to combine Autogen, Semantic Kernel, and Prompt flow to build intelligent applications
Around artificial intelligence, humans have made many attempts in different industries and different application scenarios. With the emergence of LLMs, we have transitioned from traditional chatbots with process predefinition plus semantic matching to Copilot applications that interact with LLMs through natural language. In the past year or so, everyone has mainly focused on basic theories based on LLMs. In 2024 we should enter the application scenario of LLMs. We have a lot of papers, application frameworks, and practices from large companies to support the implementation of LLMs applications. So what is the final form of our so-called artificial intelligence applications? What you can think of is GitHub Copilot for programming assistance, Microsoft 365 Copilot for office scenarios, and Microsoft Copilot on Windows or Bing, etc. But think about the application of Copilot, which relies more on individuals to guide or correct through prompt words, and does not achieve fully intelligent applications. In the 1980s, we began to try to do fully intelligent work, and AI Agent is a fully intelligent best practice.
The agent interacts with the scene where it is located, receives instructions or data in the application scene, and decides different responses based on the instructions or data to achieve the final goal. Intelligent agents not only have human thinking capabilities, but can also simulate human behavior. They can be simple systems based on business processes, or they can be as complex as machine learning models. Agents use pre-established rules or models trained through machine learning/deep learning to make decisions, and sometimes require external control or supervision.
Characteristics of the AI agent:
Planning, divide steps based on tasks, and have a chain of though. With LLMs, it can be said that the planning ability of the agent is greatly enhanced, and the understanding of the task can be more accurate.
Memorythe ability to remember behavior and part of logic, the ability to store experiences, and the ability to self-reflect.
Tool Chain, such as code execution capabilities, search capabilities, and computing capabilities. It can be said that he has strong mobility
perceive and obtain informationsuch as pictures, sounds, temperatures, etc. based on the scene, thus providing better conditions for execution.
Technical support for realizing intelligent agents
There is considerable application practice in the application of LLMs.
There are many frameworks for implementing intelligent agents. The previously mentioned Semantic Kernel or Autogen can implement intelligent agents. The Assitants API has also been added under OpenAI to enhance the model’s capabilities in agents. Now OpenAI’s Assitants API opens up the capabilities of code interpretation, retrieval, and function calling.Assitants APIof Azure OpenAI Service is also coming soon, which can be said to provide enough wisdom for the application capabilities of agents.
Many people pay more attention to the application layer framework. People often compare Semantic Kernel and Autogen. After all, both are from Microsoft and have good task or plan orchestration capabilities. However, some people always feel that the two have many similarities.
Semantic Kernel vs Autogen
Semantic Kernel focuses on effectively dividing individual tasks into steps in Copilot applications. This is also the charm of the Semantic Kernel Planner API. Autogen, on the other hand, focuses more on the construction of agents, dividing tasks to complete goals and assigning tasks to different agents. Each agent executes individually or interactively according to the assigned tasks. Behind each agent’s task can be a streaming task arrangement, or an extended method for solving problems, or skills triggered by corresponding prompts, which can be organized in conjunction with Semantic Kernel plugins. When we want to have a stable task output, we can also add prompt flow to evaluate the output.
Use Semantic Kernel to implement AI agents.
Semantic Kernel has added support for agents in the Experimental library, introduced AgentBuilder, and combined with the Assistant API to complete the brain configuration of the agent. The corresponding planning, memory and tools are defined using different plugins.
WithOpenAIChatCompletionrequires OpenAI/Azure OpenAI Service models that support Assistants API (soon to be released). Currently supported OpenAI models are GPT-3.5 or GPT-4 models.
WithInstructionsWe need to give clear task instructions and inform the agent how to execute it. This is equivalent to a process. You need to describe it clearly, otherwise the accuracy will be reduced.
.FromTemplatecan also use Template to describe task instructions
.WithNameThe name is required to make the call more clear.
.WithPluginis based on different skills and tool chains for the agent to complete tasks. This corresponds to the content of Semantic Kernel.
Let’s take a simple scenario and hope to build a .NET console application through an agent, compile and run it, and require it to be completed through an agent. From this scenario, we need two agents – the agent that generates the .NET CLI script and the agent that runs the .NET CLI script. In Semantic Kernel, we use different plugins to define the required planning, memory and tools. The following is the relevant structure diagram.
AI Agents are an important scenario for LLMs applications, and building agent applications will be an important technical field in 2024. We currently have three main forms of intelligence, such as single AI agent, multi- AI agents, and hybrid AI agent.
Single AI Agent
Work completed in specific task scenarios, such as the agent workspace under GitHub Copilot Chat, is an example of completing specific programming tasks based on user needs. Based on the capabilities of LLMs, a single agent can perform different actions based on tasks, such as requirements analysis, project reading, code generation, etc. It can also be used in smart homes and autonomous driving.
Multi-AI agents
This is the work of mutual interaction between AI agents. For example, the above-mentioned Semantic Kernel agent implementation is an example. The AI agent generated by the script interacts with your AI agent that executes the script. Multi-agent application scenarios are very helpful in highly collaborative work, such as software industry development, intelligent production, enterprise management, etc.
Hybrid AI Agent
This is human-computer interaction, making decisions in the same environment. For example, smart medical care, smart cities and other professional fields can use hybrid intelligence to complete complex professional work.
At present, the application of intelligent agents is still very preliminary. Many enterprises and individual developers are in the exploratory stage. Taking the first step is very critical. I hope you can try it more. I also hope that everyone can use Azure OpenAI Service to build more agent applications.


Recent Comments