Video Transcript:
-Is Azure the right place to run your Red Hat Enterprise Linux workloads? Well, let’s start by addressing the question at the heart of it all, and that’s how well does Azure support Linux as an operating system overall? Especially considering Microsoft’s own strength with Windows Server workloads?
-Well, it may surprise you to know that the majority, more than 60% of customer cores in Azure, run Linux workloads. Azure’s service platform and its hypervisor layer, in fact, is fully optimized for Linux, to ensure peak performance, security and compatibility.
-Linux is a first class operating system in Azure, with many of Microsoft’s most popular cloud services, like the Azure OpenAI service, Azure Kubernetes Service, App Service, Cosmos DB, Postgres and more, all running on it. And if we look specifically at Red Hat Enterprise Linux workloads, there’s even more synergy with Azure. 95% of the Fortune 500 companies use Azure. And 90% of the Fortune Global 500 rely on Red Hat. Meaning the majority of the world’s largest companies run on both. Azure, in fact, is deeply integrated with Red Hat technologies and services.
-Including tools for the migration, management, and modernization of your RHEL workloads. And today, we’ll focus on the three areas that make Azure a great choice to run them: Integration, efficiency, and flexibility. Starting with integration. If you’re not in the cloud yet, Azure Migrate tooling can help you bring your running on-premises Linux VMs fully configured to Azure to run natively in the cloud, or run hybrid together with your on-premises or edge site infrastructure.
-Then, when it comes to provisioning RHEL virtual machines, Azure has a huge gallery of pre-configured images, which are maintained to always include the latest updates. And beyond the portal experience, you also have the choice of automated scripting or code-based options. You can leverage Azure Resource Manager templates to define your infrastructure using JSON code. Use Terraform to scale your RHEL workloads. Take advantage of the numerous Ansible playbooks on the Ansible Automation Platform for the orchestration and automation of your workloads.
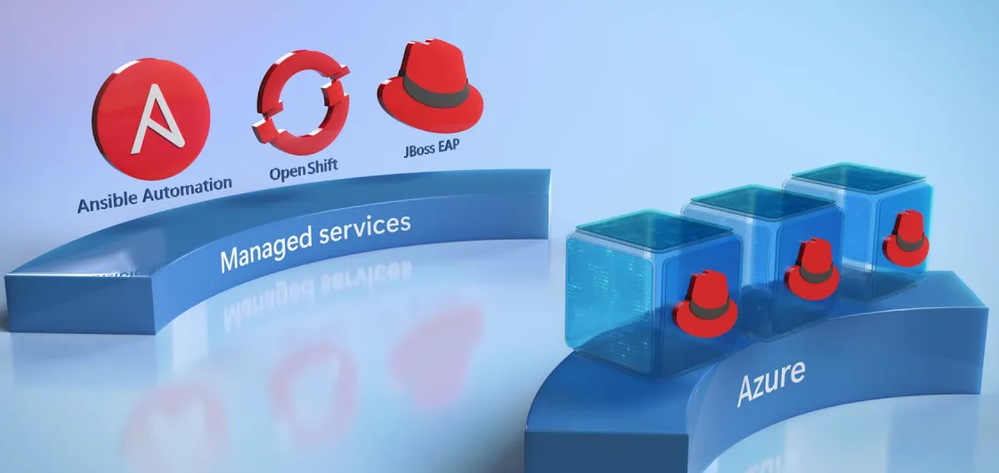
-Or choose from a selection of fully automated marketplace solutions, with all the components needed to build complex, multi-tiered apps in minutes. That said, the integration with RHEL goes beyond provisioning. Azure is also integrated with other Red Hat tools and solutions that you may already be using today, to orchestrate, run, update, and monitor your RHEL workloads on Azure. In addition to the Ansible Automation Platform, the list includes Red Hat OpenShift, and the JBoss Enterprise Application Platform.
-And these are fully managed services. Then, importantly, if you have an issue, as you work with your support team, both Azure and Red Hat support engineers can work together with your approval. In fact, these engineers are often co-located, and their customer service systems are integrated to triage issues in the least amount of time by enabling them to collaborate efficiently on your case, as they troubleshoot the problem and work towards a solution. Importantly, they’ll coordinate the response back to you.
-And will work closely with you to close the joint ticket once it’s been resolved. Azure is unique in that it’s the only cloud with this level of integrated support and tooling with Red Hat. So now let’s move on to the second area, efficiency. Here, Red Hat recently commissioned a study by Forrester Consulting on the total economic impact of Red Hat Enterprise Linux running on Azure. Customers that moved their on-premises RHEL workloads onto Azure achieved 192% return on investment over three years.
-You can find the full study at aka.ms/RHELTEI. RHEL workloads on Azure can also take advantage of the latest cloud tech, license portability, and commitment-based discounts to optimize your spend. For example, for workloads that can handle interruptions, such as batch processing and DevTest, you can take advantage of spare Azure compute capacity by deploying Azure Spot VMs for RHEL, as they become available. And save up to 90% compared to pay-as-you-go rates.
-Then, for more critical or stateful applications, as you create virtual machines, you can either use Red Hat subscription services from Azure, or bring your own subscription at no additional cost by selecting the Azure hybrid benefit for RHEL. And that will remove the Azure RHEL subscription. At that point, you can apply your own Red Hat subscription without requiring any downtime or a reboot. And to save more, you can use commitment-based discounts as well. Azure reserved instances can save you up to 76% in costs with a three year term.
-Now running your RHEL workloads in Azure not only can save costs, but can also increase their performance and scalability. There are an extensive range of compute options for RHEL workloads, from general purpose to memory optimized, compute optimized, storage optimized, and GPU enabled VMs. Azure Confidential Computing VMs work with Red Hat Enterprise Linux. And these use a trusted execution environment to extend encryption protections to your sensitive data while it’s in use. And we’re working with Red Hat engineers to bring this to containers as well.
-Beyond virtual machines, you can also run RHEL workloads on physical hardware with Azure Large Instances, which can use dedicated servers. These are ideal for workloads that need high performance, isolation, or special compliance requirements, like SAP HANA, Oracle, or IBM DB2 workloads. That said, to remove management overhead, you can also run RHEL with the JBoss EAP. And you’ll find multiple options to do that at almost any scale in the marketplace.
-And using JBoss with the Azure App Service Instance delivers a fully managed platform for web and API based applications. With its underlying Docker containers and built-in capabilities, including autoscaling, security controls, and more, for operating your RHEL workloads. Which brings us onto our third area for operating your RHEL workloads, flexibility.
-With Azure, you can run RHEL workloads where you want, how you want, and when you want, without any lock-in or limitations. RHEL workloads can run on Azure across dozens of global regions, zones, and edge locations. If you run RHEL workloads on-prem in your data center, on edge sites, or in any other cloud, Azure ARC lets you manage and secure them from any of these locations directly in Azure.
-In fact, for your hybrid workloads, Azure Arc gives you a single control plane for policy enforcement, security, update management, monitoring and more. And has been thoroughly tested and validated with Red Hat. And it can include your other Linux Distros as well as Windows Server. And they’ll integrate with other Azure native services.
-Next, to help with update management, you have full control over how RHEL updates are managed using your existing or preferred tools. Like the Ansible Automation Platform, which can initiate via the command line. Or you can use Azure Update Manager to control updates from the Azure portal. And with that, I hope I’ve shared enough to show you why Azure is a great place to run your Red Hat Enterprise Linux workloads with the security, performance, and compatibility that you need.
-Whether you want to migrate your existing Linux workloads to Azure, or build new cloud native apps from scratch, and if you prefer, run them hybrid, Azure offers unparalleled support, and opens up a breadth of opportunities to do more. For additional information, check out aka.ms/RedHatAzure. Keep checking back to Microsoft Mechanics for the latest tech updates. And thanks for watching.


 Register today


Recent Comments