by Contributed | Apr 22, 2024 | Technology
This article is contributed. See the original author and article here.
Trusted Signing has launched into Public Preview! The Trusted Signing service (formerly Azure Code Signing) is a Microsoft fully managed end-to-end signing solution for developers.
What is the Trusted Signing service?
Trusted Signing is a complete code signing service with an intuitive experience for developers and IT professionals, backed by a Microsoft managed certification authority. The service supports both public and private trust signing scenarios and includes a timestamping service. With Trusted Signing, users enjoy a productive, performant, and delightful experience on Windows with modern security protection features enabled such as Smart App Control and SmartScreen.
The service offers several key features that make signing easy:
- We manage the full certificate lifecycle – generation, renewal, issuance – and key storage that is FIPS 140-2 Level 3 HSMs. The certificates are short lived certificates, which helps reduce the impact on your customers in abuse or misuse scenarios.
- We have integrated into popular developer toolsets such as SignTool.exe and GitHub and Visual Studio experiences for CI/CD pipelines enabling signing to easily integrate into application build workflows. For Private Trust, there is also PowerShell cmdlets for IT Pros to sign WDAC policy and future integrations with IT endpoint management solutions.
- Signing is digest signing, meaning it is fast and confidential – your files never leave your endpoint.
- We have support for different certificate profile types including Public Trust, Private Trust, and Test with more coming soon!
- Trusted Signing enables easy resource management and access control for all signing resources with Azure role-based access control as an Azure native resource.
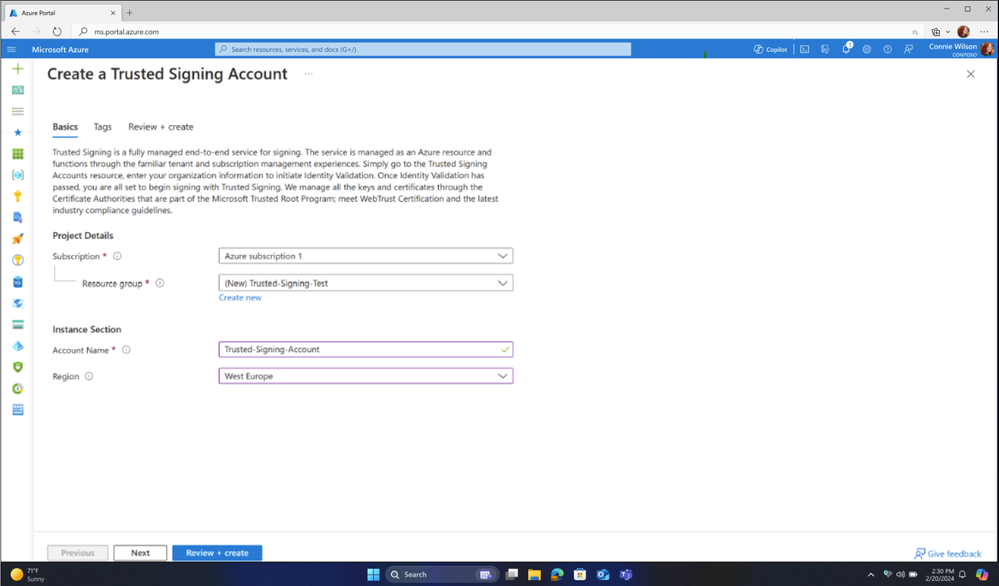
Figure 1: Creating a Trusted Signing Account
Trusted Signing Pricing
We want to make this affordable for ISVs and developers in a way that allows the community of all demographics to be able to sign. While we have two pricing SKUs, basic and premium accounts, the initial Public Preview release is free until June 2024. The details of each SKU are outlined below:
Model type
|
Basic
|
Premium
|
Base price (monthly)
|
$9.99
|
$99.99
|
Quota (signatures / month)
|
5,000
|
100,000
|
Price after quota is reached
|
$0.005 / signature
|
$0.005 / signature
|
Includes
|
- Public and Private Signing
- 1 of each Certificate Profile type
|
- Public and Private Signing
- 10 of each Certificate Profile Type
|
Try out Trusted Signing today by visiting the Azure portal.
by Contributed | Apr 21, 2024 | Technology
This article is contributed. See the original author and article here.
Fabric Multi-Tenant Architecture
ISVs often face challenges in managing data for multiple tenants in a secure manner while keeping costs low. Traditional solutions may prove costly for scenarios with more than 100 tenants, especially with the common ISV scenario where the volume of trial and free tenants is much larger than the volume of paying tenants.
The motivation for ISVs to use Fabric is that it brings together experiences such as Data Engineering, Data Factory, Data Science, Data Warehouse, Real-Time Analytics, and Power BI onto a shared SaaS foundation.
In this article, we will explore the Workspace per tenant-based architecture, which is a cost-effective solution for managing data for all tenants in Microsoft Fabric, including ETL and reporting.
Challenges of Multi-Tenant Data Solutions
Let us start with the questions that this article will answer:
- What are my options to isolate data between tenants?
- What are the security requirements/regulation that I should consider?
- What are the implications of the various solutions?
Note: You should explore the cost/performance/maintenance aspects of each solution and balance them according to well defined policy that is suited to you as an ISV in specific industry, under specific regulations and upon understanding the sensitivity of the data.
ISVs are reporting that their customers demand solutions that are “fully isolated” in the meaning of data separation between tenants. However, the industry (as well as the regulation) has not defined yet what is “fully isolated.”
The possibility of querying data from multiple tenants is quite common even though it is against the isolated concept. Fabric implementation concepts will be discussed in this article.
Application scenarios:
Microsoft Fabric is designed for multiple application scenarios as defined here.
This article will focus on the typical following two:
1. Data analytics and workflow processing
2. Data gathering, processing, and IoT.
OLTP applications are a native source for Fabric but are not recommended to be the data platform for such systems.
Typical ISVs projects need to ensure that the architecture will support:
- Multi-tenants that need data isolation between different tenants. We will discuss briefly what is data isolation in this document.
- Power BI reporting.
- Performance and cost challenges with relational engine.
- Easy migration to Fabric.
The Workspace approach is well-suited to support all those scenarios.
Terminology
OneLake:
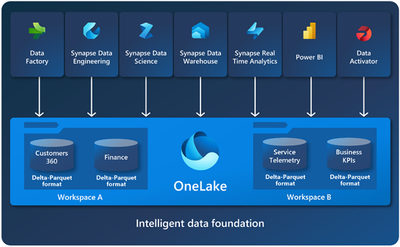
OneLake is a single, unified, logical data lake for your whole organization. For our discussions, all the ISV’s tenants’ data will be hosted on the same OneLake. As you can see from the diagram below, Fabric supports multiple services that can connect to OneLake.
Capacity:
A Microsoft Fabric capacity resides on a tenant. Each capacity that sits under a specific tenant is a distinct pool of resources allocated to Microsoft Fabric. The size of the capacity determines the amount of computation power available.
Workspace:
Workspaces reside within capacities and are used as containers for Microsoft Fabric items. Workspace is the place in OneLake that holds the data.
Within a tenant, you can create any number of workspaces. Workspaces enable various parts of the organization to distribute ownership and access policies. Each workspace is part of a capacity that is tied to a specific region and is billed separately.
Within a workspace, you can create data items and you access all data in OneLake through data items. Fabric stores are like lakehouses, warehouses, and other items in OneLake.
Of course. License considerations must take place. Our assumption is that most ISVs will utilize Capacity License.
Data Storage:
The assumption of this article is that a typical ISV wants to store all the data for all his tenants in a central location (multi-region provisioning might be needed due to end-customer location) in a secure and cost-effective way. This is a repeatable demand that we hear from our ISVs. Fabric can offer a new way to achieve this goal by four concepts (more details provided) in this article:
- One OneLake for all your data
- Tenants’ separation/isolation by workspace
- Affordable storage – Parquet files is the storage format. The price per GB is similar the price of Blob storage in the hot tier..
- Serverless oriented – no need to pay for unused compute resources.
Data acquiring (ETL and/or IoT) and hybrid scenarios will not be discussed in this article.
Fabric Direct Lake
One of the key components is Fabric Direct Lake, which includes a semantic model capability for analyzing large data volumes in Power BI. Direct Lake is based on loading parquet-formatted files directly from a data lake without having to query a Lakehouse endpoint, and without having to import or duplicate data into a Power BI model.
In other words, Direct Lake eliminates the need to load the data to a relational database or to Power BI and uses Direct Lake as a one-step solution to query the data instead of multiple steps. The following figure (not a replacement for reading the full article here) can help us understand the solution:

As shown in the diagram, Direct Lake streamlines the user’s path by eliminating the need to create, maintain, and pay for a separate lakehouse or warehouse, as well as the need to use import or direct query processes. This results in a more efficient and cost-effective solution for analyzing large data volumes in Power BI.
Workspace based Multi-Tenant Architecture
One of the ground building blocks of Fabric is a workspace. Workspaces are containers that are places to collaborate with colleagues to create collections of items such as lakehouses, warehouses, and reports. You can grant permission per workspace (see the security part later), which can be extremely helpful to associate the tenant’s login with the tenant’s workspace and to his workspace only.

As you can see from the diagram, OneLake can utilize the workspaces for tenant isolation.
Advantages of using workspace per tenant approach:
|
|
Security
|
Avoiding the need to manage security between workspaces
|
Manageability
|
The ability to move/delete/archive tenants without any impact on other tenants
|
Simplicity
|
One OneLake per ISV; One workspace per tenant; No service to manage and patch
|
Monitoring
|
Monitor resource usage per tenant easily
|
SLA
|
Ability to give different SLAs to different tenants by provisioning different services according to the tenants’ needs and or budget
|
Cost per Tenant
|
Ability to know (and bill) each tenant’s data size according to usage
|
More reading:
Isolation models
Tenant Data Isolation
Due to business, regulation and security considerations, any multi-tenant should ensure that each tenant can access only his data. From a high-level perspective, the solutions that enable us to achieve this granularity are divided into two types:
- Physical separation of the data to separate locations.
- Ensuring that the application will filter the data from the relevant tenants by mechanisms like Row Level Security.
This document discusses the physical separation type only since this type is aligned with Fabric’s architecture.
Shared data
For shared data the suggested usage is to have a separate workspace that will be shared by a shortcut to all the tenants’ environments. If the shared data is managed by a database, you might be able to use mirroring to sync the database to the shared data workspace. Mirroring is in preview now for Cosmos DB, Azure SQL DB and Snowflake. However, SQL Server, Azure PostgreSQL, Azure MySQL, MongoDB and other databases and data warehouses will be coming in CY24.
Features of Fabric that support multitenancy
Capacities and multi-Region
In Fabric you will have only OneLake per the ISV’s tenant. However, you can deploy your system in multiple regions by having capacity defined in each region.
- There is only one OneLake per tenant.
- A tenant can have multiple capacities in one or more regions.
- Any capacity is attached to a specific region.
- A workspace can be assigned to only one capacity.
- Every item stored in a lakehouse/warehouse of a workspace will be stored in the region of the tied capacity.
Multitenancy friendly cost structure
Storage
Delta-Parquet files which are the basic building block in Fabric. Those files charged per volume so the number of workspaces will not affect the cost.
Serverless Service
Fabric is a serverless solution which means that there is separation between storage and compute resources payments.
As you expect, you are paying for the storage you are using and you should try to optimize the size of the storage. Since storage costs are low, the storage cost will not be a significant percentage of your total cloud bill.
For compute, you will pay according to the usage. In the BI environment, the user load is expected to vary and such models will save money.
With classic Fabric implementation, you can skip the need for relational database which usually can be one of the main cloud expenses.
ETL
Most ISVs run ETL per tenant, therefore the cost will be the same.
In rare cases where one ETL process can deal with multiple tenants, a single workspace for all tenants might run with less pipelines and save costs.
Power BI
In Power BI, a workspace per tenant is the best practice. Please read the Develop scalable multitenancy applications with Power BI embedding article for deep discussion. From the Power BI perspective, the limitations are based on the largest workspace size (and not on the total workspace size) as defined here.
Capacity and Chargeback Management
The recommended approach for segregating tenants through distinct workspaces facilitates a frequently requested feature: chargeback support. By allocating separate capacities to each tenant’s workspace (or multiple workspaces), monitoring and accessing data regarding each tenant’s usage becomes straightforward.
Microsoft Fabric concepts and licensing article provides essential guidance for creating a deployment that enables ISVs to implement chargeback mechanisms. This allows for precise billing of end customers based on their actual consumption, streamlining the process and ensuring transparency in usage and cost allocation.
Workspace Security
Granular permissions per tenant
As written above, you can use permission per workspace to ensure tenant’s isolation per workspace. The same mechanism is used to give more granular permissions to specific items inside the users of the tenants (good description can be found here).
Note, the same concept is true for permissions inside a lakehouse or warehouse inside a workspace.
For example, the user Mark-CustomerA might be associated with the CustomerA tenant to see only the data related to his tenant. If you want to give him read access to the Orders data you will define a role named OrdersRead-CustomerA and associate Mark with this role. To define a global role OrdersRead instead is possible but will not be a satisfactory solution.
In Fabric you can give permissions by sharing – see here and here. Detail granular permission discussion is beyond the scope of this document – this document is discussing only the security aspects of the multi-tenant scenario.
Multi-tenants Network security
There is no IP separation nor any other network isolation between workspaces. The good news is that a solution is coming. As stated in What’s new and planned for Administration and governance in Microsoft Fabric, Private Link support is planned for Q2 24 (it is not available now and plans might be changed). The Private Link capability will expand from Power BI to other workloads in phases, including workspace-level support. Once Azure Private Link is configured and public internet access is restricted, all the supported scenarios for that workspace will be routed through private links.
Identity Management
- We strongly recommend using different users per tenant and not letting an application-based security mechanism to be the only authorization gate.
- Please read our Architectural considerations for identity in a multitenant solution.
- In these days, you can even utilize multitenant organization in Microsoft Entra ID which is in preview. Detail discussion of this option is beyond the scope of this article. Some highlights can be found in multitenant organization scenario and Microsoft Entra ID capabilities.
- The importance of those practices us crucial in ensuring robust security.
More reading:
Cross-workspace
Cross-workspace queries
While the demand to have cross-tenant queries looks like opening the system for a security breach, in real life this demand is quite common.
Here are the typical scenarios:
- ISV level reporting.
- ETL to a data warehouse/data lake.
- Using metadata info and/or external data that is relevant to all tenants without the need to duplicate them to all tenants.
To achieve this ability, you should leverage the SQL analytics endpoint that enables querying of any table and easy sharing.
You will need to create a shortcut pointing to the required databases or tables from the other workspace. More details can be found in Cross workspace sharing and querying.
To avoid potential overriding privacy and regulation policies, you should allow cross-tenant queries only in specific cases. You should design such implementation carefully from both security and architecture aspects.
More reading:
Cross-workspace Pipelines
Organizations might separate their data into multi workspaces due to internal security reasons (Separating Gold from Silver/Bronze, according to the data sensitivity).
For other ISVs, the need is even more complex. The data (or at least part of it) comes in a multi-tenant stream and this data should be divided into different single-tenant streams with a minimal effort.
Currently, Fabric does not support this functionality but the ability to enable Cross-workspace Pipelines is in the roadmap.
However, you can clone your data pipelines across workspaces by using the “Save as” button (see here). This makes it easier to develop pipelines collaboratively inside Fabric workspaces without having to redesign your pipelines from scratch. Another solution, based on dynamic content is described here.
Using Cross Workspace Pipelines might simplify the ETL code as well as reduce the expected costs. With proper design, the expected running time of the processes will be better.
Conclusion
If you are an ISV that has multiple tenants, you can use the new Fabric platform to host those tenants. Fabric will help you host the data received from those customers on an isolated basis, paying only for the actual storage that you are using while being able to load the data will all the transformations needed and build a reporting layer for your customers.
by Contributed | Apr 20, 2024 | Technology
This article is contributed. See the original author and article here.
Data Protection for SAP Solutions
Introduction
Data protection is key criteria for all customers. You need to find an optimal way to protect against data loss or data inconsistencies caused by hardware or software defects, accidentally deletion of data, external and internal data fraud.
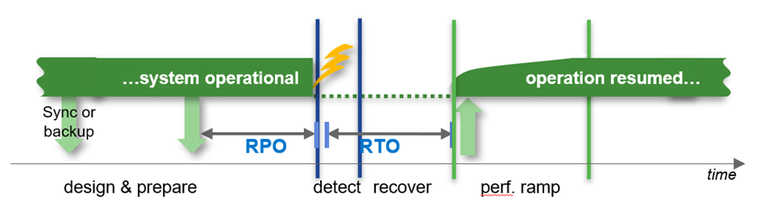
Other important criteria are the architecture around high availability and disaster recovery to fulfill the requirements around RPO in a typical HA case (usually RPO=0) or in a disaster recovery case (usually RPO!=0).
How soon is the system required to be back in “normal” operations after an HA or DR situation.
Recovery times can be in a wide range depending on the ways to recover the data. E.g. the times can be short if you could use Snapshots or a clone from a Snapshot or it could take hours to bring back the data to the file system (Streaming backup/recovery) before we even can start the database recovery process.
The main question is “what is your requirement?”
What is nice to have and what is really required in cases of high availability and disaster recovery?
Backup Runtime with different HANA Database Sizes
Database size on file system
Backup throughput: 250MB/s

For very large databases the backup process will take many hours if you are using streaming based backup. With snapshot based backups it could take only a minute, regardless of the size of the database. Remember, a Snapshot, at least with Azure NetApp Files, remains in the same volume where your data is. Therefore, consider offloading (at least) one Snapshot a day using e.g. ANF backup to a ANF backup Vault.
SAP HANA on Azure NetApp Files – Data protection with BlueXP backup and recovery (microsoft.com)
Restore and recovery times of a 4TB HANA database

- Database size: 4TB on file system
- Restore throughput: 250MB/s
- Log backups: 50% of db size per day
- Read troughput during db start: 1000MB/s
- Throughput during recovery: 250MB/s
Conclusion:
For smaller databases it can be absolutely sufficient to use streaming backups to fulfil your requirements. For larger or very large databases getting to low RTO times with streaming backups can be difficult. Since it can take hours to restore the data to the original location. This could enlarge the RTO significantly. Although, specifically for the high availability case, we would recommend using HSR (HANA System Replication) to reach an acceptable RTO. But even than the failing system may need to be rebuild or recovered which might take many hours. To reduce the time for a complete system rebuild, customers are using Snapshot based backup/restore scenarios to lower the RTO significantly.
Azure Backup (Streaming Backup)
Azure Backup delivers these key benefits:
- Offload on-premises backup – Azure Backup offers a simple solution for backing up your on-premises resources to the cloud. Get short and long-term backup without the need to deploy complex on-premises backup solutions.
- Back up Azure IaaS VMs – Azure Backup provides independent and isolated backups to guard against accidental destruction of original data. Backups are stored in a Recovery Services vault with built-in management of recovery points. Configuration and scalability are simple, backups are optimized, and you can easily restore as needed.
- Scale easily – Azure Backup uses the underlying power and unlimited scale of the Azure cloud to deliver high-availability with no maintenance or monitoring overhead.
- Get unlimited data transfer – Azure Backup doesn’t limit the amount of inbound or outbound data you transfer, or charge for the data that’s transferred. Outbound data refers to data transferred from a Recovery Services vault during a restore operation. If you perform an offline initial backup using the Azure Import/Export service to import large amounts of data, there’s a cost associated with inbound data. Learn more.
- Keep data secure – Azure Backup provides solutions for securing data in transit and at rest.
- Centralized monitoring and management – Azure Backup provides built-in monitoring and alerting capabilities in a Recovery Services vault. These capabilities are available without any additional management infrastructure. You can also increase the scale of your monitoring and reporting by using Azure Monitor.
- Get app-consistent backups – An application-consistent backup means a recovery point has all required data to restore the backup copy. Azure Backup provides application-consistent backups, which ensure additional fixes aren’t required to restore the data. Restoring application-consistent data reduces the restoration time, allowing you to quickly return to a running state.
- Retain short and long-term data – You can use Recovery Services vaults for short-term and long-term data retention.
- Automatic storage management – Hybrid environments often require heterogeneous storage – some on-premises and some in the cloud. With Azure Backup, there’s no cost for using on-premises storage devices. Azure Backup automatically allocates and manages backup storage, and it uses a pay-as-you-use model. So, you only pay for the storage you consume. Learn more about pricing.
- Multiple storage options – Azure Backup offers three types of replication to keep your storage/data highly available.
- Locally redundant storage (LRS) replicates your data three times (it creates three copies of your data) in a storage scale unit in a datacenter. All copies of the data exist within the same region. LRS is a low-cost option for protecting your data from local hardware failures.
- Geo-redundant storage (GRS) is the default and recommended replication option. GRS replicates your data to a secondary region (hundreds of miles away from the primary location of the source data). GRS costs more than LRS, but GRS provides a higher level of durability for your data, even if there’s a regional outage.
- Zone-redundant storage (ZRS) replicates your data in availability zones, guaranteeing data residency and resiliency in the same region. ZRS has no downtime. So your critical workloads that require data residency, and must have no downtime, can be backed up in ZRS.
What is Azure Backup? – Azure Backup | Microsoft Learn
SAP HANA Backup support matrix – Azure Backup | Microsoft Learn
ANF how does a SnapShot work
How Azure NetApp Files snapshots work | Microsoft Learn
What volume snapshots are
An Azure NetApp Files snapshot is a point-in-time file system (volume) image. It is ideal to serve as an online backup. You can use a snapshot to create a new volume (clone), restore a file, or revert a volume. In specific application data stored on Azure NetApp Files volumes, extra steps might be required to ensure application consistency.
Low-overhead snapshots are made possible by the unique features of the underlying volume virtualization technology that is part of Azure NetApp Files. Like a database, this layer uses pointers to the actual data blocks on disk. But, unlike a database, it doesn’t rewrite existing blocks; it writes updated data to new blocks and changes the pointers, thus maintaining the new and the old data. An Azure NetApp Files snapshot simply manipulates block pointers, creating a “frozen”, read-only view of a volume that lets applications access older versions of files and directory hierarchies without special programming. Actual data blocks aren’t copied. As such, snapshots are efficient in the time needed to create them; they are near-instantaneous, regardless of volume size. Snapshots are also efficient in storage space; only delta blocks between snapshots and the active volume are kept.
Files consist of metadata and data blocks written to a volume. In this illustration, there are three files, each consisting of three blocks: file 1, file 2, and file 3.

A snapshot Snapshot1 is taken, which copies the metadata and only the pointers to the blocks that represent the files:

Files on the volume continue to change, and new files are added. Modified data blocks are written as new data blocks on the volume. The blocks that were previously captured in Snapshot1 remain unchanged:

A new snapshot Snapshot2 is taken to capture the changes and additions:

ANF Backup (SnapShot – SnapVault based)
Azure NetApp Files backup expands the data protection capabilities of Azure NetApp Files by providing fully managed backup solution for long-term recovery, archive, and compliance. Backups created by the service are stored in Azure storage, independent of volume snapshots that are available for near-term recovery or cloning. Backups taken by the service can be restored to new Azure NetApp Files volumes within the same Azure region. Azure NetApp Files backup supports both policy-based (scheduled) backups and manual (on-demand) backups. For additional information, see https://learn.microsoft.com/en-us/azure/azure-netapp-files/snapshots-introduction
To start with please read: Understand Azure NetApp Files backup | Microsoft Learn
ANF Resource limits: Resource limits for Azure NetApp Files | Microsoft Learn
Design
The four big benefits of ANF backup are:
- Inline compression when taking a backup.
- De-Duplication – this will reduce the amount of storage needed in the Blob space. Be aware that using Transparent Data Encryption functionality as offered by the different DBMS are prohibiting efficiency gains by De-Duplication
- Block level Delta copy of the blocks – this will the time and the space for each backup
- The database server is not impacted when taking the backup. All traffic will go directly from the storage to the blob space using the Microsoft backbone and NOT the client network. The backup will also NOT impact the storage volume quota. The database server will have the full bandwidth available for normal operation.

How this is all working
We are going to split the backup features in two parts. The data volume will be snapshotted with azacsnap. Creating this snapshot, it is important that the data volume is in a consistent state before the snapshot is triggered. Creating the application consistency is managed with azacsnap in the case of e.g. SAP HANA Oracle (with Oracle Linux), and Db2 (Linux only).
The SAP HANA log backup area is a “offline” volume and can be backed up anytime without talking to the database. We also need a much higher backup frequency to reduce the RPO as for the data volume. The database can be “rolled forward” with any data snapshot if you have all the logs created after this data volume snapshot. Therefore, the frequency of how often we backup the log backup folder is very important to reduce the RPO. For the log backup volume we do not need a snapshot at all because, as I mentioned, all the files there are offline files.

This displays the “one AV Zone scenario”. It will also be possible to use ANF backup in a peered region (DR) but then the restore process will be different (later in this document)
ANF Backup using an DR Region
It is also an option to leverage ANF backup from a DR Azure region. In this scenario the backups will be created from the ANF DR volumes. In our example, we are using both. CRR (Cross Region Replication) in a region ANF can replicate to and ANF backup to store the backups for many days, weeks or even months.
For a recovery you will primarily use the snapshots in the production ANF volume. If you have lost the primary zone or ANF you might have an HA system before you even recover the DB. If you don’t have an HA system, you still have a copy of the data in your DR region. In the DR region, you simply could activate the volumes or create a clone out of the volumes. Both are very fast methods to get your data back. You would need to recover the database using the clone or the DR volume. In most cases you will lose some data because in the DR region usually is a gap of available log backups.

ANF Volume Lock
One other data protection method is to lock the ANF volume from deletion.
When you create a lock you will protect the ANF volume from accidently deletion.

If you or someone else tries to delete the ANF volume, or the resource group the ANF volume belongs to, Azure will return an error.

Result in:

However, there is a limitation to consider. If you set a lock on an ANF volume that vlocks deletion of the volume, you also can’t delete any snapshots created of this volume. This presents a limitation when you work with consistent backups using AzAcSnap. AzAcSnap. As those are not going to be able to delete any snapshots of a volume where the lock is configured. The consequence is that the retention management of azacsnap or BlueXP is not able to delete the snapshots that are out of the retention period anymore.
But for a time where you start with your SAP deployment in Azure this might is a workable way to protect your volumes for accidently deletion.
Repair system
There are many reasons why you might find yourself in a situation to repair a HANA database to s specific point in time. the most common are:
- Accidental deletion of data within a table or deletion of a complete table during administration or operations causing a logical inconsistency in the database.
- Issues in hardware of software stack causing corruption of page/block content in the database.
In both of these it might take hours, days or even weeks until the impacted data is accessed the next time. The more time passes between the introduction of such an inconsistency and the repair, the more difficult is the root cause analysis and correction. Especially in cases of logical inconsistencies, an HA system will not help since the logical inconsistency cause by a ‘delete command’ got “transferred” to the database of the HA system through HANA System Replication as well.
The most common method of solving these logical inconsistency problems is to “quickly” build an, so called, repair system to extract deleted and now “missing” data.
To detect physical inconsistencies, executing regular consistency checks are highly recommended to detect problems as early as possible.
For SAP HANA, the following main consistency checks exist:
CHECK_CATALOG
|
Metadata
|
Procedure to check SAP HANA metadata for consistency
|
CHECK_TABLE_CONSISTENCY
|
Column store
Row store
|
Procedure to check tables in column store and row store for consistency
|
Backup
|
Persistence
|
During (non-snapshot) backups the physical page structure (e.g. checksum) is checked
|
hdbpersdiag
|
Persistence
|
Starting with SAP HANA 2.0 SPS 05 the hdbpersdiag tool is officially supported to check the consistency of the persistence level. see Persistence Consistency Check for more information.
|
2116157 – FAQ: SAP HANA Consistency Checks and Corruptions – SAP for Me
Persistence Check Tool
SAP Note 1977584 provides details about these consistency check tools. See also for related information in the SAP HANA Administration Guide.
To create an “repair System” we can select an older snapshot, which was created with e.g. azacsnap, and recover the database where we assume the deleted table was still available. Then export the table and import the table into the original PRD database. Of course,
we recommend that SAP support personnel guides you through this recovery process and potential additional repairs in the database.
The process of creating a ‘repair system’ can look as the following graphic:

by Contributed | Apr 19, 2024 | Technology
This article is contributed. See the original author and article here.
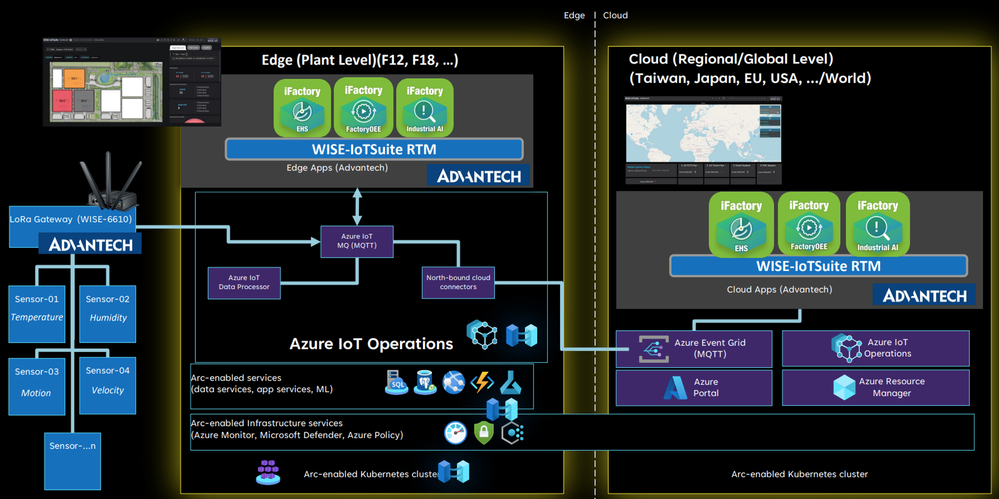
Microsoft is partnering with leading industrial connectivity partners Advantech, PTC, and Softing to unlock industrial data for AI and accelerate digital transformation for industrial customers leveraging Azure IoT Operations through Azure’s adaptive cloud approach.
We are committed to empowering customers to achieve more with their data and unlocking new insights and opportunities across the industrial ecosystem. This includes overcoming the challenges of proprietary interfaces and data models from an array of industrial assets on the factory floor. We believe that the key to addressing those challenges is enabling data to flow consistently and securely to the people and places where it’s needed to drive collaboration and better decision-making, leveraging open standards like OPC UA and MQTT. This is why we are working closely with our connectivity partners, who play a vital role in bridging the gap between legacy or proprietary assets and our standardized edge interfaces. They provide data translation and normalization to open, standardized data models across heterogeneous environments.
The adaptive cloud approach brings just enough Azure and its capabilities to any environment, from the factory floor to both 1st party and 3rd party cloud infrastructure, using Kubernetes and other open technologies. We enable interoperability and integration across diverse edge devices and applications, providing a single control and management plane using Azure IoT Operations (Preview), enabled by Azure Arc. We aim to unify siloed teams, distributed sites, and sprawling systems and to provide our customers with an open, interoperable, and secure Industrial IoT platform that can scale to meet their current and future needs quickly.
We are leveraging leading solutions from our connectivity partners Advantech, PTC, and Softing to achieve the necessary frictionless data flow that our customers need. Each connectivity partner is integrated with Azure IoT Operations to enable data interoperability and management across the industrial edge and cloud.

Advantech is a leader in Industrial IoT, providing comprehensive system integration, hardware, software, and customer-centric design services. Their iFactory solution offers device-to-cloud visibility and a strong hardware-led connectivity story. Advantech has integrated their iFactory solution with Azure IoT Operations, enabling data flow from their edge devices and applications to Azure. They are also exploring to build an Akri connector for LoRaWAN, enabling an integration with Azure Resource Manager and benefiting from Azure’s security, monitoring, and management features.
“Azure IoT Operations offers a highly flexible approach to swiftly onboard IoT assets within the same network hierarchy. Data from devices can be easily captured using Akri discovery plugins and visualized in Grafana for user consumption. With the Azure AIO solution stack, our customers can seamlessly transition to a digital operational environment with success.”
– Ihen Tsai, Product Manager of WISE-iFactory, Advantech

PTC Kepware is a premier provider of industrial connectivity software, and their solutions access data from virtually any device – legacy or modern – and seamlessly and securely move the data to other OT and IT software applications. Their flagship product, Kepware+, enables secure and reliable data transfer between industrial assets and Azure IoT Operations, leveraging MQTT and OPC UA. Customers can ingest, process, and publish OPC UA data to services such as Azure Data Explorer or Microsoft Fabric, and can leverage Microsoft’s AI capabilities.
“PTC is proud of our long collaboration with Microsoft to accelerate digital transformation for industrial companies with our portfolio of manufacturing solutions. The announcement of Azure IoT Operations marks a significant milestone in empowering companies to leverage data for innovation and heightened efficiency. Together, PTC Kepware+ and Azure IoT Operations seamlessly and securely integrate to access, normalize, and process asset data at the edge and derive insights in the cloud.”
– Ted Kerkam, Senior Director of Product Strategy, PTC Kepware


Softing is a leading provider of industrial connectivity. Their edgeConnector, edgeAggregator and dataFEED OPC Suite family of products offer access to process and machine data in PLCs from various vendors such as Siemens, Rockwell, Schneider, Beckhoff, Mitsubishi, Fanuc, Omron, and more. Softing has integrated their connectivity product portfolio with Azure IoT Operations, enabling data flow from OT assets via open standards OPC UA and MQTT. This allows customers to send their asset data to services such as Azure Data Explorer or Microsoft Fabric, and they can leverage Microsoft’s AI capabilities.
“Our customers require standards-based and scalable machine connectivity for their Industrial IoT solutions. Microsoft’s adaptive cloud approach supports Kubernetes, MQTT and OPC UA on edge level, so we can offer a seamless integration of our dataFEED products into the Azure platform meeting our customers’ critical requirements regarding connectivity and efficient operation.”
– Thomas Hilz, Managing Director at Softing Industrial Automation GmbH

Engage with Microsoft on our adaptive cloud approach and data connectivity
We believe when working together across a robust partner ecosystem, Microsoft can deliver the best possible solutions to our customers and help them realize the full potential of their data across the industrial edge and cloud. We are also committed to supporting open standards and protocols and providing a single management and control plane, to enable a seamless and secure data flow from assets to the cloud.
To learn more, visit the Microsoft booth at Hannover Messe (Hall 17, Stand G06) from April 22-26. We invite you to come see us and our partners, and we will be showcasing our connectivity partner solutions. You can learn more about our adaptive cloud approach and discuss your Industrial IoT opportunities with our experts.
We hope to see you there!
by Contributed | Apr 18, 2024 | Technology
This article is contributed. See the original author and article here.
Today marks a pivotal moment in the 2024 Imagine Cup as we reveal the top three teams selected to progress from the semifinals to the highly anticipated Imagine Cup World Championship, live at Microsoft Build!
The Imagine Cup, the premier student technology startup competition, has attracted thousands of visionary student entrepreneurs worldwide. Each team has developed an AI-driven solution to tackle pressing challenges including accessibility, sustainability, productivity, and healthcare.
This year’s semifinalists have demonstrated exceptional innovation with Azure AI services and OpenAI, showcasing their innovation, grit and ability make a positive impact through entrepreneurship. Congratulations to all the semifinalists for their remarkable achievements!
However, only three teams have been selected to progress to the World Championship where they will live on the global stage as they vie for the Imagine Cup Trophy, USD100,000, and a mentorship session with Microsoft Chairman and CEO, Satya Nadella! You can watch these startups live at Microsoft Build on May 21 to see who wins.
Drumroll, please, as we unveil FROM YOUR EYES, JRE, and PlanRoadmap! These startups represent the pinnacle of creativity and resilience, embodying the spirit of innovation that defines Imagine Cup.
Meet the Teams! Listed in alphabetical order.
FROM YOUR EYES
Turkey
About: Using Azure Computer Vision and Text Translator, FROM YOUR EYES has built a mobile application that offers both fast and qualified visual explanations to visually impaired users.

In their own words…
Who/what inspires you? “After being selected as one of Microsoft’s leading women in technology in 2020, I was invited to join the experience team of Microsoft’s Seeing AI program. It was there that I took on responsibilities and crossed paths with visually impaired developers worldwide who held significant roles. They encouraged me to delve into coding. In addition, Onur Koç, Microsoft Turkey’s CTO, also greatly inspired us, he addressed all student ambassadors saying, ‘Software is magic. You can change the life of someone you’ve never met on the other side of the world.’ We were deeply moved by this, and with this motivation, we worked to reach people…with our developed technology, and we succeeded.”
How do you want to make an impact with AI? “The issue of blindness directly affects 330 million people worldwide and indirectly impacts over a billion individuals. For a visually impaired person, using image processing solutions means freedom. With the technology we have developed, our goal is to enable visually impaired individuals to live freely, remove barriers to their dreams, and solve the problem of blindness through technology. This competition will provide us with the opportunity to promote our technology to millions of visually impaired individuals worldwide. They do not have time to waste. We also want to quickly deliver our technology to those in need.”
|
JRE
United Kingdom
About: Using Azure Machine Learning, Microsoft Fabric, and Copilot, JRE has built a slag detection system used in the continuous casting process of steel. Accurately detecting slag optimizes yield while improving quality.

In their own words…
Who/what inspires you? Jorge: “I learned how to code out of necessity. Even though I took courses as an undergrad, I never really liked the type of projects we did because they were primarily simulations about atomic interactions and molecular optimizations. I found these problems beautiful but very abstract. After college, many people wanted to create businesses around apps, and I learned how to code front and back-end applications to sell these apps. Later on, when I started working in the steel industry, I was frustrated by the lack of automation and unsafe and repetitive processes, so I started creating more complex integrated systems in this space.”
How do you want to make an impact with AI? “Our aim is to redefine manufacturing for the 21st century—making it smarter, more efficient, and sustainable. The Imagine Cup represents a unique opportunity to showcase our solution to a global audience, garnering support and resources necessary to scale our impact. We’re driven by the challenge of solving real-world problems and believe that through this competition, we can take a significant step towards achieving our vision.”
|
PlanRoadmap
United States
About: Using Azure OpenAI Service, PlanRoadmap has built an AI-powered productivity coach to help people with ADHD who are struggling with task paralysis get their tasks done. Their coach asks questions to identify the user’s obstacles, suggests strategies, and teaches the user about their work style.

In their own words…
Who/what inspires you? Aaliya: One of my biggest inspirations has been my father… as he helped guide my direction within computer science. He has always been an advocate for women in STEM, and at a young age, that was incredibly powerful to be supported on. It enabled me to overcome feelings of imposter syndrome and have confidence in myself. He has always painted a vision of who I could be before I really believed in myself, and he inspires me to be dedicated, passionate, and ambitious.”
Clay: “At a young age, I was diagnosed with dysgraphia, a condition that impairs writing ability and fine motor skills. Even if not explicitly stated, when everything in school is handwriting, you are at a pretty severe disadvantage when you struggle to even write a few sentences.”
Ever: “Some of my biggest inspiration in pursuing computer science and engineering has been from cinema. I didn’t really have many people in my life who were in the tech field growing up, so I got a lot of inspiration from seeing tech in movies. In cinema you can see tech exactly as the artist imagined it, without the restrictions of the real world.”
How do you want to make an impact with AI? Clay: “As I became increasingly proficient in programming, I realized that not only did I want to do something big, but that I had the potential to make it happen. We are unified under the mission to help people with ADHD achieve their dreams. Our customer discovery efforts have revealed that despite significant increases in technological tools, there are still millions of people facing barriers caused by their ADHD symptoms and related executive function deficits. We want to change that. The mentorship from Microsoft will help us with the technical innovation and provide that frictionless experience to provide a novel approach towards supporting neurodivergent people.”
|
Up Next…
These top three teams will be live on the global stage at Microsoft Build on May 21 for the Imagine Cup World Championship, showcasing the depth and promise of their startups. Follow the journey on Instagram and X to stay up to date with all the competition action – and join us live to find out who is crowned champion!


Recent Comments