by Contributed | Sep 1, 2024 | Technology
This article is contributed. See the original author and article here.
Mv3 High Memory General Availability
Executing on our plan to have our third version of M-series (Mv3) powered by 4th generation Intel® Xeon® processors (Sapphire Rapids) across the board, we’re excited to announce that Mv3 High Memory (HM) virtual machines (VMs) are now generally available. These next-generation M-series High Memory VMs give customers faster insights, more uptime, lower total cost of ownership and improved price-performance for their most demanding workloads. Mv3 HM VMs are supported for RISE with SAP customers as well. With the release of this Mv3 sub-family and the sub-family that offers around 32TB memory, Microsoft is the only public cloud provider that can provide HANA certified VMs from around 1TB memory to around 32TB memory all powered by 4th generation Intel® Xeon® processors (Sapphire Rapids).
Key features on the new Mv3 HM VMs
- The Mv3 HM VMs can scale for workloads from 6TB to 16TB.
- Mv3 delivers up to 40% throughput over our Mv2 High Memory (HM), enabling significantly faster SAP HANA data load times for SAP OLAP workloads and significant higher performance per core for SAP OLTP workloads over the previous generation Mv2.
- Powered by Azure Boost, Mv3 HM provides up to 2x more throughput to Azure premium SSD storage and up to 25% improvement in network throughput over Mv2, with more deterministic performance.
- Designed from the ground up for increased resilience against failures in memory, disks, and networking based on intelligence from past generations.
- Available in both disk and diskless offerings allowing customers the flexibility to choose the option that best meets their workload needs.
During our private preview, several customers such as SwissRe unlocked gains from the new VM sizes. In their own words:
“Mv3 High Memory VM results are promising – in average we see a 30% increase in the performance without any big adjustment.”
Msv3 High Memory series (NVMe)
Size
|
vCPU
|
Memory in GiB
|
Max data disks
|
Max uncached Premium SSD throughput: IOPS/MBps
|
Max uncached Ultra Disk and Premium SSD V2 disk throughput: IOPS/MBps
|
Max NICs
|
Max network bandwidth (Mbps)
|
Standard_M416s_6_v3
|
416
|
5,696
|
64
|
130,000/4,000
|
130,000/4,000
|
8
|
40,000
|
Standard_M416s_8_v3
|
416
|
7,600
|
64
|
130,000/4,000
|
130,000/4,000
|
8
|
40,000
|
Standard_M624s_12_v3
|
624
|
11,400
|
64
|
130,000/4,000
|
130,000/4,000
|
8
|
40,000
|
Standard_M832s_12_v3
|
832
|
11,400
|
64
|
130,000/4,000
|
130,000/4,000
|
8
|
40,000
|
Standard_M832s_16_v3
|
832
|
15,200
|
64
|
130,000/ 8,000
|
260,000/ 8,000
|
8
|
40,000
|
Msv3 High Memory series (SCSI)
Size
|
vCPU
|
Memory in GiB
|
Max data disks
|
Max uncached Premium SSD throughput: IOPS/MBps
|
Max uncached Ultra Disk and Premium SSD V2 disk throughput: IOPS/MBps
|
Max NICs
|
Max network bandwidth (Mbps)
|
Standard_M416s_6_v3
|
416
|
5,696
|
64
|
130,000/4,000
|
130,000/4,000
|
8
|
40,000
|
Standard_M416s_8_v3
|
416
|
7,600
|
64
|
130,000/4,000
|
130,000/4,000
|
8
|
40,000
|
Standard_M624s_12_v3
|
624
|
11,400
|
64
|
130,000/4,000
|
130,000/4,000
|
8
|
40,000
|
Standard_M832s_12_v3
|
832
|
11,400
|
64
|
130,000/4,000
|
130,000/4,000
|
8
|
40,000
|
Standard_M832s_16_v3
|
832
|
15,200
|
64
|
130,000/ 8,000
|
130,000/ 8,000
|
8
|
40,000
|
Mdsv3 High Memory series (NVMe)
Size
|
vCPU
|
Memory in GiB
|
Temp storage (SSD) GiB
|
Max data disks
|
Max cached* and temp storage throughput: IOPS / MBps
|
Max uncached Premium SSD throughput: IOPS/MBps
|
Max uncached Ultra Disk and Premium SSD V2 disk throughput: IOPS/MBps
|
Max NICs
|
Max network bandwidth (Mbps)
|
Standard_M416ds_6_v3
|
416
|
5,696
|
400
|
64
|
250,000/1,600
|
130,000/4,000
|
130,000/4,000
|
8
|
40,000
|
Standard_M416ds_8_v3
|
416
|
7,600
|
400
|
64
|
250,000/1,600
|
130,000/4,000
|
130,000/4,000
|
8
|
40,000
|
Standard_M624ds_12_v3
|
624
|
11,400
|
400
|
64
|
250,000/1,600
|
130,000/4,000
|
130,000/4,000
|
8
|
40,000
|
Standard_M832ds_12_v3
|
832
|
11,400
|
400
|
64
|
250,000/1,600
|
130,000/4,000
|
130,000/4,000
|
8
|
40,000
|
Standard_M832ds_16_v3
|
832
|
15,200
|
400
|
64
|
250,000/1,600
|
130,000/ 8,000
|
260,000/ 8,000
|
8
|
40,000
|
Mdsv3 High Memory series (SCSI)
Size
|
vCPU
|
Memory in GiB
|
Temp storage (SSD) GiB
|
Max data disks
|
Max cached* and temp storage throughput: IOPS / MBps
|
Max uncached Premium SSD throughput: IOPS/MBps
|
Max uncached Ultra Disk and Premium SSD V2 disk throughput: IOPS/MBps
|
Max NICs
|
Max network bandwidth (Mbps)
|
Standard_M416ds_6_v3
|
416
|
5,696
|
400
|
64
|
250,000/1,600
|
130,000/4,000
|
130,000/4,000
|
8
|
40,000
|
Standard_M416ds_8_v3
|
416
|
7,600
|
400
|
64
|
250,000/1,600
|
130,000/4,000
|
130,000/4,000
|
8
|
40,000
|
Standard_M624ds_12_v3
|
624
|
11,400
|
400
|
64
|
250,000/1,600
|
130,000/4,000
|
130,000/4,000
|
8
|
40,000
|
Standard_M832ds_12_v3
|
832
|
11,400
|
400
|
64
|
250,000/1,600
|
130,000/4,000
|
130,000/4,000
|
8
|
40,000
|
Standard_M832ds_16_v3
|
832
|
15,200
|
400
|
64
|
250,000/1,600
|
130,000/ 8,000
|
130,000/ 8,000
|
8
|
40,000
|
*Read iops is optimized for sequential reads
Regional Availability and Pricing
The VMs are now available in West Europe, North Europe, East US, and West US 2. For pricing details, please take a look here for Windows and Linux.
Additional resources:
Details on Mv3 Very High Memory Virtual Machines
We are thrilled to unveil the latest and largest additions to our Mv3-Series, Standard_M896ixds_32_v3 and Standard_M1792ixds_32_v3 VM SKUs. These new VM SKUs are the result of a close collaboration between Microsoft, SAP, experienced hardware partners, and our valued customers.
Key features on the new Mv3 VHM VMs
- Unmatched Memory Capacity: With close to 32TB of memory, both the Standard_M896ixds_32_v3 and Standard_M1792ixds_32_v3 VMs are ideal for supporting very large in-memory databases and workloads.
- High CPU Power: Featuring 896 cores in the Standard_M896ixds_32_v3 VM and 1792 vCPUs** in the Standard_M1792ixds_32_v3 VM, these VMs are designed to handle high-end S/4HANA workloads, providing more CPU power than other public cloud offerings. Enhanced Network and Storage Bandwidth: Both VM types provide the highest network and storage bandwidth available in Azure for a full node VM, including up to 200-Gbps network bandwidth with Azure Boost.
- Optimal Performance for SAP HANA: Certified for SAP HANA, these VMs adhere to the SAP prescribed socket-to-memory ratio, ensuring optimal performance for in-memory analytics and relational database servers.
Size |
vCPU or cores |
Memory in GiB |
SAP HANA Workload Type |
Standard_M896ixds_32_v3 |
896 |
30,400 |
OLTP (S/4HANA) / OLAP Scaleup |
Standard_M1792ixds_32_v3 |
1792** |
30,400 |
OLAP Scaleup |
**Hyperthreaded vCPUs
by Contributed | Aug 31, 2024 | Technology
This article is contributed. See the original author and article here.
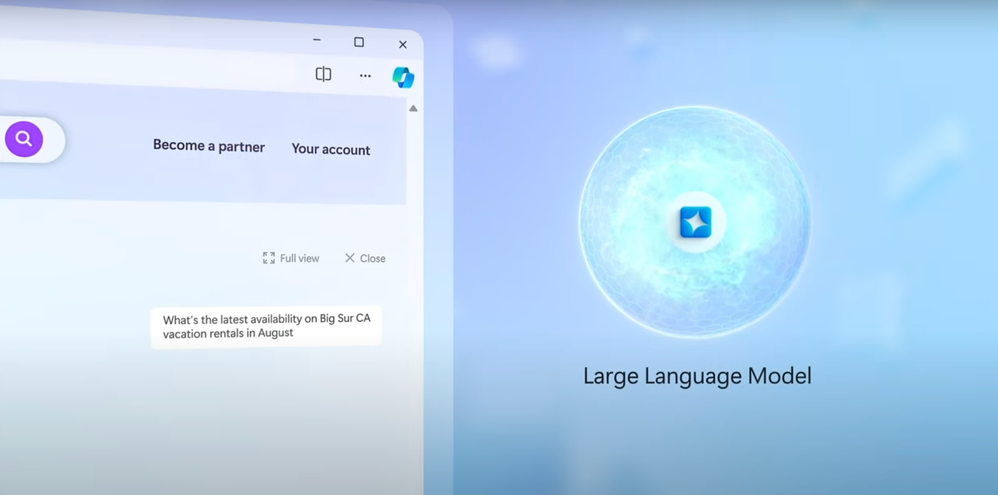
Microsoft Fabric seamlessly integrates with generative AI to enhance data-driven decision-making across your organization. It unifies data management and analysis, allowing for real-time insights and actions.

With Real Time Intelligence, keeping grounding data for large language models (LLMs) up-to-date is simplified. This ensures that generative AI responses are based on the most current information, enhancing the relevance and accuracy of outputs. Microsoft Fabric also infuses generative AI experiences throughout its platform, with tools like Copilot in Fabric and Azure AI Studio enabling easy connection of unified data to sophisticated AI models.
Check out GenAI experiences with Microsoft Fabric.
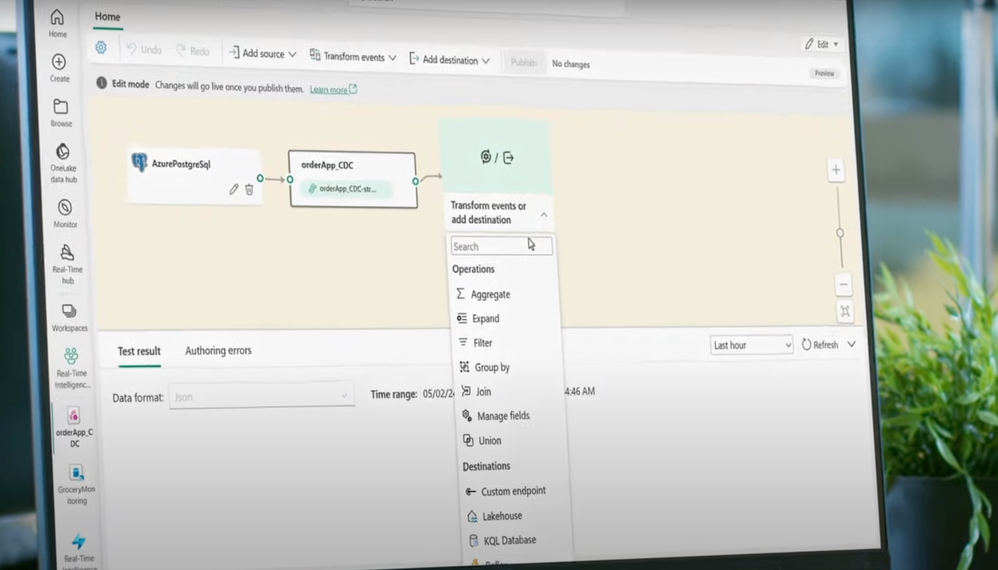
Unify data across multiple clouds, data centers, and edge locations at unlimited scale-without having to move it.
Classify and protect schematized data with Microsoft Purview.
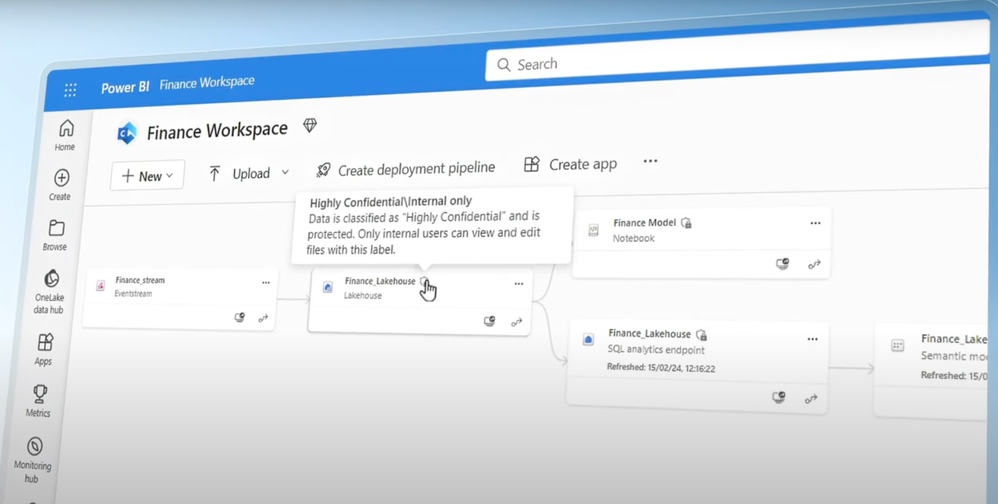
Ensure secure collaboration as engineers, analysts, and business users work together in a Fabric workspace.
Connect data from OneLake to Azure AI Studio.
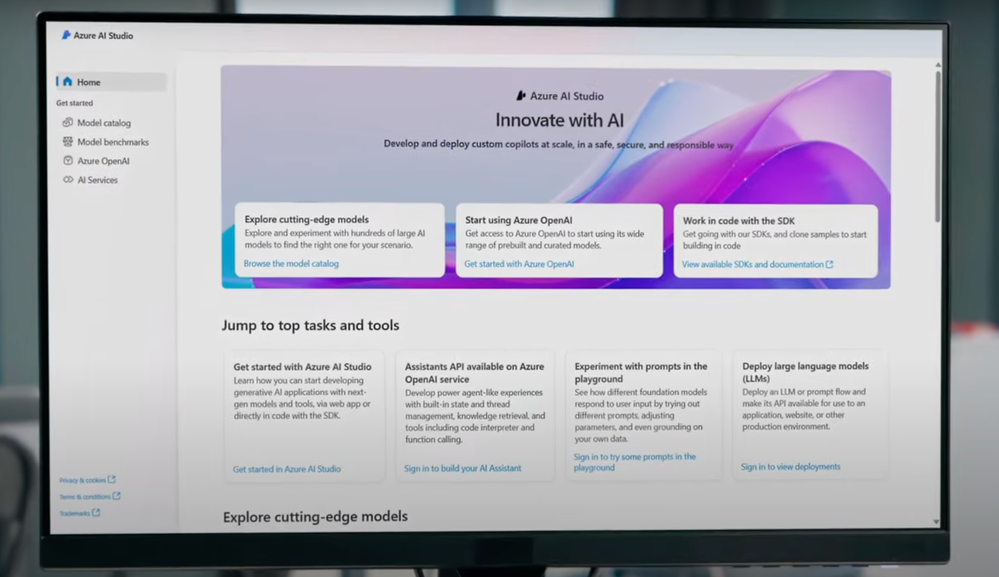
Build custom AI experiences using sophisticated large language models. Take a look at GenAI experiences in Microsoft Fabric.
Watch our video here:
QUICK LINKS:
00:00 — Unify data with Microsoft Fabric
00:35 — Unified data storage & real-time analysis
01:08 — Security with Microsoft Purview
01:25 — Real-Time Intelligence
02:05 — Integration with Azure AI Studio
Link References
This is Part 3 of 3 in our series on leveraging generative AI. Watch our playlist at https://aka.ms/GenAIwithAzureDBs
Unfamiliar with Microsoft Mechanics?
As Microsoft’s official video series for IT, you can watch and share valuable content and demos of current and upcoming tech from the people who build it at Microsoft.
Keep getting this insider knowledge, join us on social:
Video Transcript:
-If you want to bring custom Gen AI experiences to your app so that users can interact with them using natural language, the better the quality and recency of the data used to ground responses, the more relevant and accurate the generated outcome.
-The challenge, of course, is that your data may be sitting across multiple clouds, in your own data center and also on the edge. Here’s where the complete analytics platform Microsoft Fabric helps you to unify data wherever it lives at unlimited scale, without you having to move it.
-It incorporates a logical multi-cloud data lake, OneLake, for unified data storage and access and separately provides a real-time hub optimized for event-based streaming data, where change data capture feeds can be streamed from multiple cloud sources for analysis in real time without the need to pull your data. Then with your data unified, data professionals can work together in a collaborative workspace to ingest and transform it, analyze it, and also endorse it as they build quality data sets.
-And when, used with Microsoft Purview, this can be achieved with an additional layer of security where you can classify and protect your schematized data with protections flowing as everyone from your engineers, data analysts to your business users works with data in the Fabric workspace. Keeping grounding data for your LLMs up to date is also made easier by being able to act on it with Real Time Intelligence.
-For example, you might have a product recommendation engine on an e-commerce site and using Real Time Intelligence, you can create granular conditions to listen for changes in your data, like new stock coming in, and update data pipelines feeding the grounding data for your large language models.
-So now, whereas before the gen AI may not have had the latest inventory data available to it to ground responses, with Real Time Intelligence, generated responses can benefit from the most real-time, up-to-date information so you don’t lose out on sales. And as you work with your data, gen AI experiences are infused throughout Fabric. In fact, Copilot in Fabric experiences are available for all Microsoft Fabric workloads to assist you as you work.
-And once your data set is complete, connecting it from Microsoft Fabric to ground large language models in your gen AI apps is made easy with Azure AI Studio, where you can bring in data from OneLake seamlessly and choose from some of the most sophisticated large language models hosted in Azure to build custom AI experiences on your data, all of which is only made possible when you unify your data and act on it with Microsoft Fabric.

by Contributed | Aug 30, 2024 | Technology
This article is contributed. See the original author and article here.
This is the next segment of our blog series highlighting Microsoft Learn Student Ambassadors who achieved the Gold milestone, the highest level attainable, and have recently graduated from university. Each blog in the series features a different student and highlights their accomplishments, their experience with the Student Ambassador community, and what they’re up to now.
Today we meet Flora who recently graduated with a bachelor’s in biotechnology from Federal University of Technology Akure in Nigeria.
Responses have been edited for clarity and length.
When did you join the Student Ambassadors community?
July 2021
What was being a Student Ambassador like?
Being a student ambassador was an amazing experience for me. I joined the program at a crucial time when I was just beginning my tech journey and was on the verge of giving up on a tech career, thinking it might not be for me. Over the three years I served as an ambassador, I not only enhanced my technical skills but also grew as an individual. I transformed from a shy person into someone who could confidently address an audience, developing strong presentation and communication skills along the way. As an ambassador, I made an impact on both small and large scales, excelled in organizing events, and mentored other students to embark on their own tech career paths.
Was there a specific experience you had while you were in the program that had a profound impact on you and why?
One significant impact I made as an ambassador was organizing a Global Power Platform event in Nigeria, which is presumed the largest in West Africa, with around 700 students attending. During this event, I collaborated with MVPs in the Power Platform domain to upskill students in Power BI and Power Apps technology. Leveraging my position as a Microsoft ambassador, I secured access to school facilities, including computer systems for students to use for learning. This pivotal experience paved the way for me to organize international events outside the ambassador program.
These experiences aside helped me develop skills in project management, networking, and making a large-scale impact.
Tell us about a technology you had the chance to gain a skillset in as a Student Ambassador. How has this skill you acquired helped you in your post-university journey?
During my time as an ambassador, I developed a strong skillset in data analytics. I honed my abilities using various Microsoft technologies, including Power BI, Excel, and Azure for Data Science. I shared this knowledge with my community through classes, which proved invaluable in my post-university journey. Additionally, I honed my technical writing skills by contributing to the Microsoft Blog, with one of my articles becoming one of the top most viewed blogs of the year. This experience helped me secure an internship while in school and side-gigs via freelancing, and ultimately landing a job before graduating.
What is something you want all students, globally, to know about the Microsoft Learn Student Ambassador Program?
I want students worldwide to know that the Microsoft Learn Student Ambassador program is for everyone, regardless of how new they are to tech. It offers opportunities to grow, learn, and expand their skills, preparing them for success in the job market. They shouldn’t view it as a program only for geniuses but as a place that will shape them in ways that traditional academics might not

Flora and other Microsoft Learn Student Ambassadors in her university.
What advice would you give to new Student Ambassadors, who are just starting in the program?
I would advise students just starting in the program to give it their best and, most importantly, to look beyond the SWAG! Many people focus on the swag and merchandise, forgetting that there’s much more to gain, including developing both soft and technical skills. So, for those just starting out, come in, make good connections, and leverage those connections while building your skills in all areas.
Share a favorite quote with us! It can be from a movie, a song, a book, or someone you know personally. Tell us why you chose this. What does it mean for you?
Maya Angelou’s words deeply resonate with me: ‘Whatever you want to do, if you want to be great at it, you have to love it and be willing to make sacrifices.’ This truth became evident during my journey as a student ambassador. I aspired to be an effective teacher, presenter, and communicator. To achieve that, I knew I had to overcome my shyness and embrace facing the crowd. Making an impact on a large scale requires stepping out of my comfort zone. Over time, I transformed into a different person from when I first joined the program.
Tell us something interesting about you, about your journey.
One fascinating aspect of my involvement in the program and my academic journey was when I assumed the role of community manager. Our goal was to elevate the MLSA community to a prominent position within the school, making it recognizable to both students and lecturers. However, through collaborative efforts and teamwork with fellow ambassadors, we achieved significant growth. The community expanded to nearly a thousand members, and we successfully registered it as an official club recognized by the Vice-Chancellor and prominent lecturers. I owe a shout-out to Mahmood Ademoye and other ambassadors from FUTA who played a pivotal role in shaping our thriving community.

Flora and her mentor Olanrewaju Oyinbooke
You can follow Flora here:
LinkedIn: https://www.linkedin.com/in/flora-oladipupo/
X: https://x.com/flora_oladipupo
Github: https://github.com/shashacode
Medium: https://medium.com/@floraoladipupo
Hashnode: https://writewithshasha.hashnode.dev/
Linktree: https://linktr.ee/flora_oladipupo
by Contributed | Aug 29, 2024 | Technology
This article is contributed. See the original author and article here.
Introducing exciting new features to help you better understand and improve adoption and impact of Copilot for Microsoft 365 through the Copilot Dashboard. These features will help you track Copilot adoption trends, estimate impact, interpret results, delegate access to others for improved visibility, and query Copilot assisted hours more effectively. This month, we have released four new features:
Updates to Microsoft Copilot Dashboard:
- Trendlines
- Copilot Value Calculator
- Metric guidance for Comparison
- Delegate Access to Copilot Dashboard
We have also expanded the availability of the Microsoft Copilot Dashboard. As recently announced, the Microsoft Copilot Dashboard is now available as part of Copilot for Microsoft 365 licenses and no longer requires a Viva Insights premium license. The rollout of the Microsoft Copilot Dashboard to Copilot for Microsoft 365 customers started in July. Customers with over 50 assigned Copilot for Microsoft 365 licenses or 10 assigned premium Viva Insights licenses have begun to see the Copilot Dashboard. Customers with fewer than 50 assigned Copilot for Microsoft 365 licenses will continue to have access to a limited Copilot Dashboard that features tenant-level metrics.
Let’s take a closer look at the four new features in the Copilot Dashboard as well as an update to more advanced reporting options in Viva Insights.
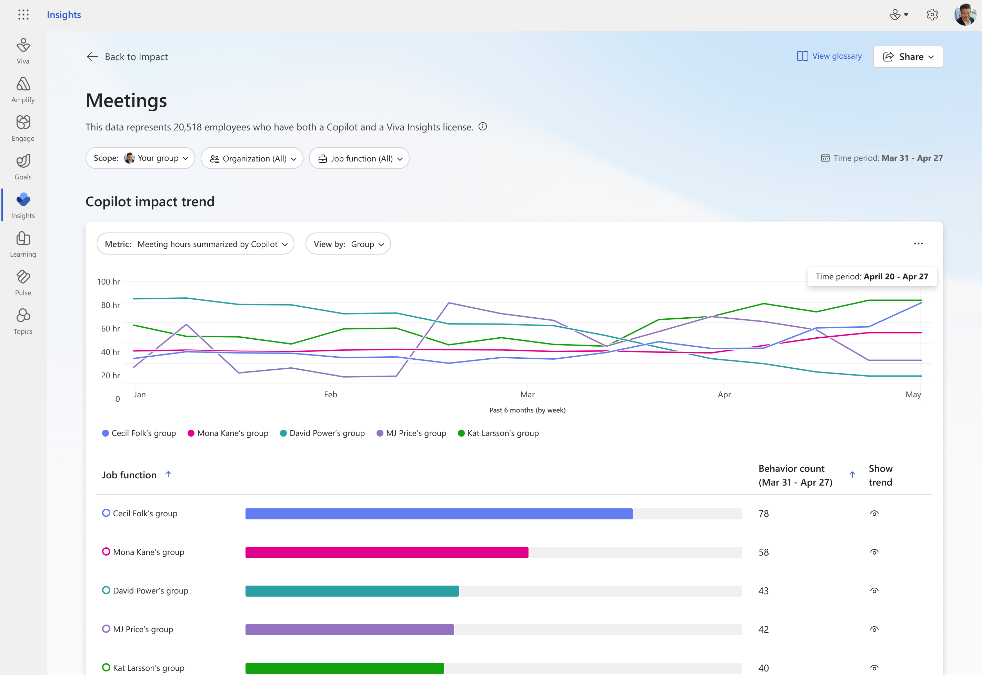
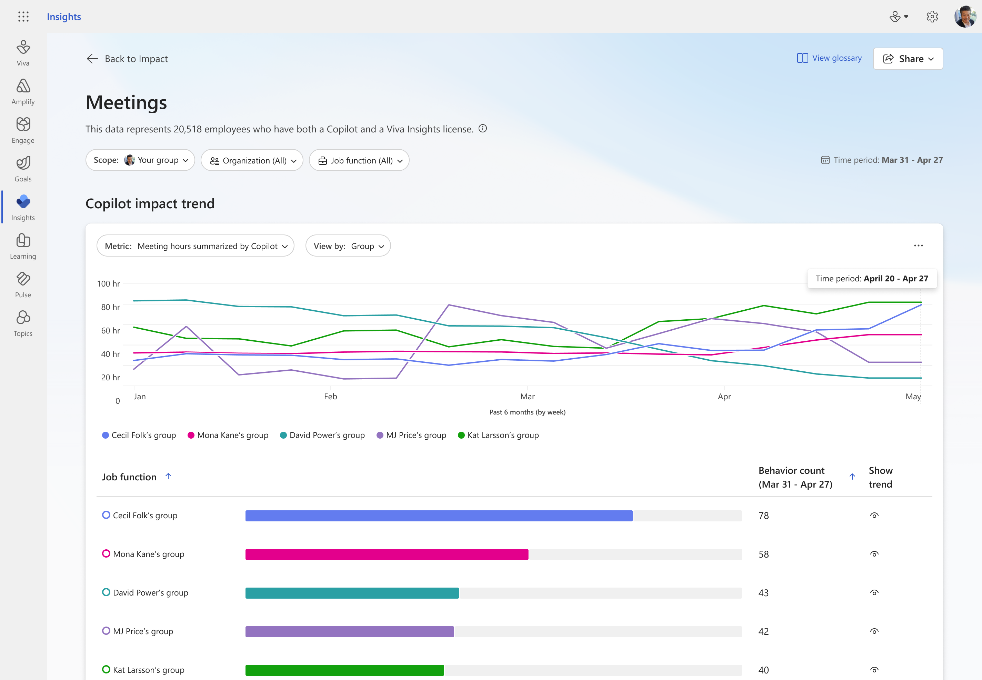
Trendline Feature
Supercharge your insights with our new trendline feature. Easily track your company’s Copilot adoption trends over the past 6 months. See overall adoption metrics like the number of Copilot-licensed employees and active users. Discover the impact of Copilot over time – find out how many hours Copilot has saved, how many emails were sent with its assistance, and how many meetings it summarized. Stay ahead with trendline and see how Copilot usage changes over time at your organization. For detailed views of Copilot usage within apps and Copilot impact across groups for timeframes beyond 28 days, use Viva Insights Analyst Workbench (requires premium Viva Insights license).
Learn more here.
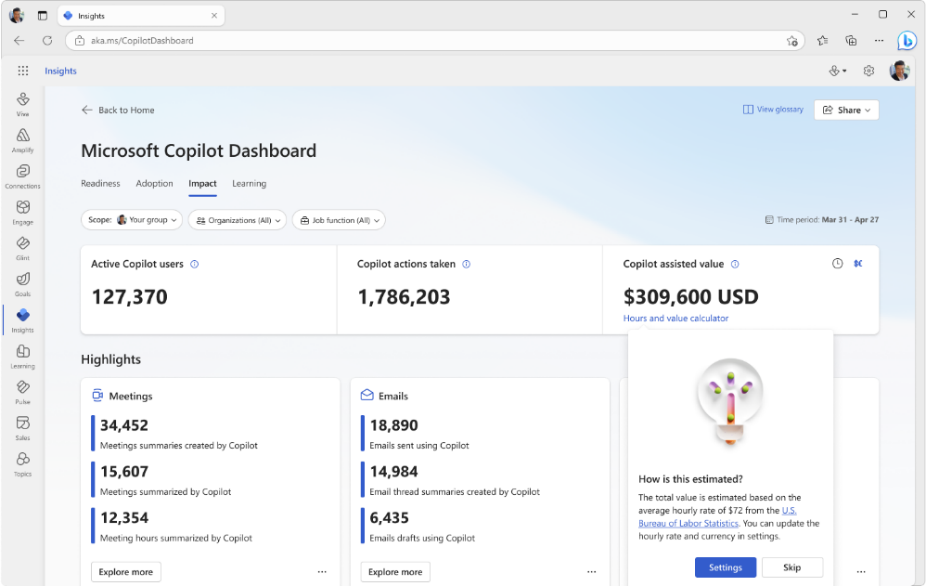
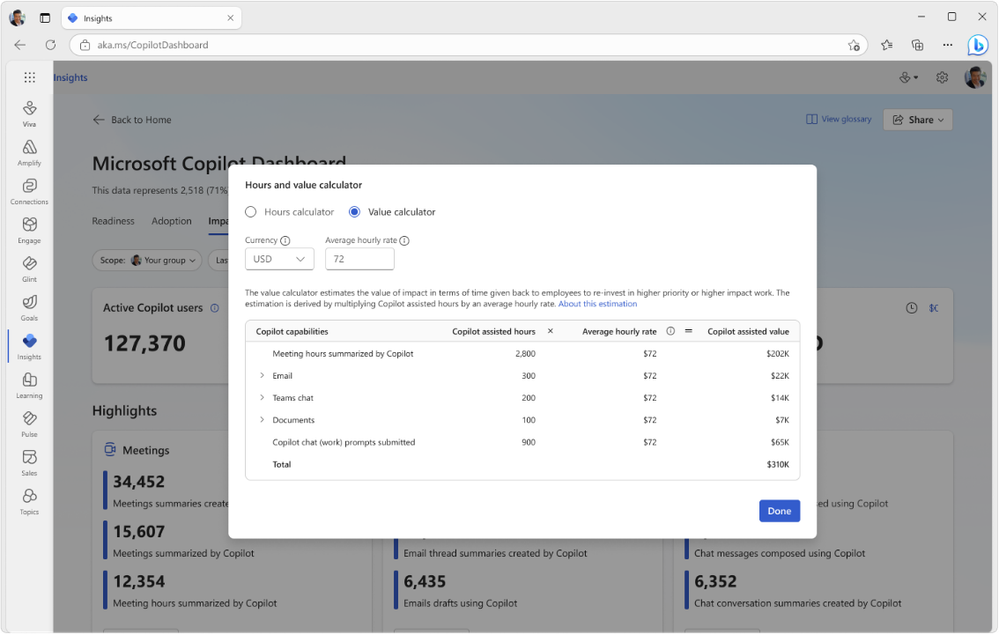
Copilot Value Calculator
Customize and estimate the value of Copilot at your organization. This feature estimates Copilot’s impact over a given period by multiplying Copilot-assisted hours by an average hourly rate. By default, this rate is set to $72, based on data from the U.S. Bureau of Labor Statistics. You can customize it by updating and saving your own average hourly rate and currency settings to get a personalized view. This feature is enabled by default, but your Global admin can manage it using Viva feature access management. See our Learn article for more information on Copilot-assisted hours and value.
Metric Guidance for Comparisons
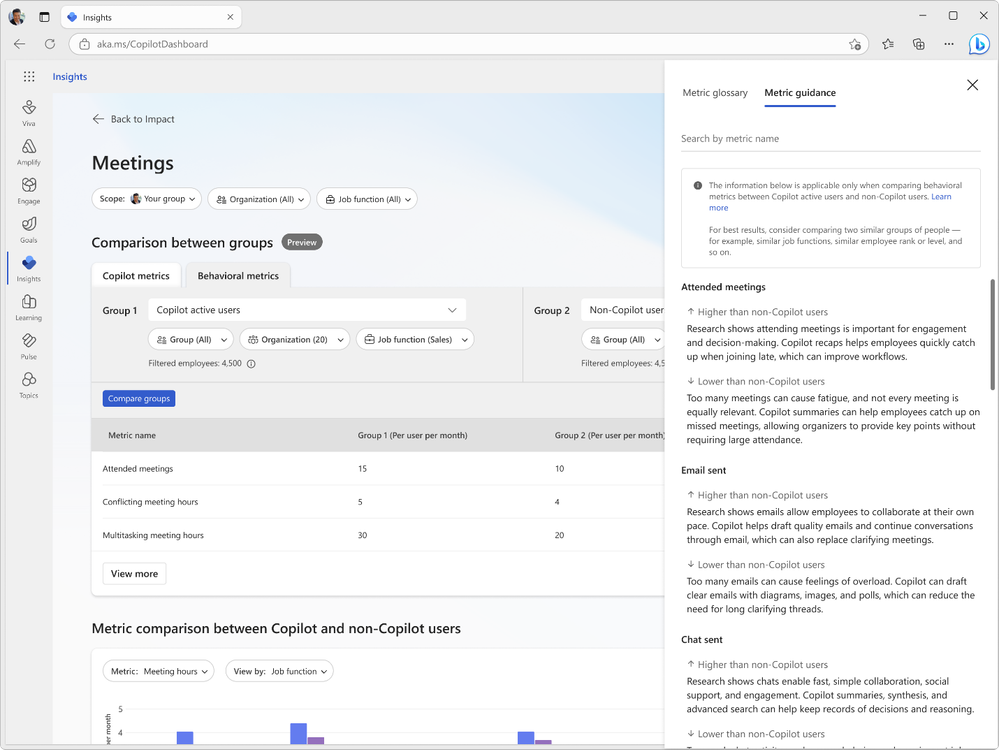
Discover research-backed metric guidance when comparing different groups of Copilot usage, for example, Copilot active users and non-Copilot users. This guidance is based on comprehensive research compiled in our e-book and helps users interpret changes to meetings, email and chat metrics. For the best results, compare two similar groups, such as employees with similar job functions or ranks. Use our in-product metric guidance to interpret results and make informed decisions with confidence. Click here for more information.
Delegate Access to Copilot Dashboard
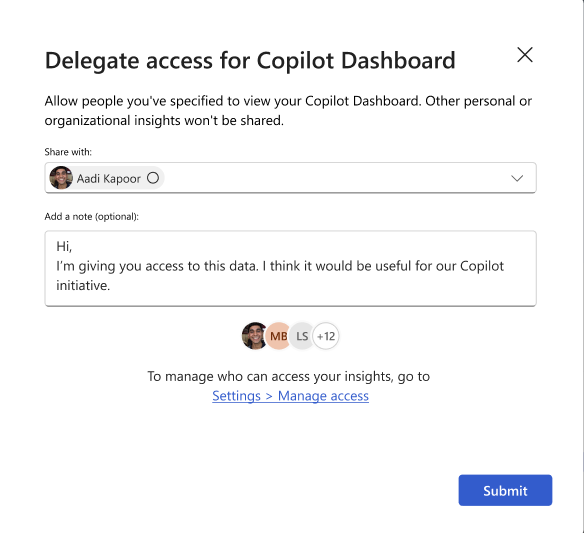
Leaders can now delegate access to their Microsoft Copilot Dashboard to others in their company to improve visibility and efficiency. Designated delegates, such as the leader’s chief of staff or direct reports, will be able to view Copilot Dashboard insights and use them to make data-driven decisions. Learn more about the delegate access feature here. Admins can control access to the delegation feature by applying feature management policies.
Go Deeper with Viva Insights – Copilot Assisted Hours Metric in Analyst Workbench
For customers wanting a more advanced, customizable Copilot reporting experience, Viva Insights is available with a premium Viva Insights license. With Viva Insights, customers can build custom views and reports, view longer data sets of Copilot usage, compare usage against third party data, and customize the definition of active Copilot users and other metrics.
The Copilot assisted hours metric featured in the Microsoft Copilot Dashboard is now also available to query in the Viva Insights Analyst Workbench. When running a person query and adding new metrics, Viva Insights analysts will be able to find this metric under the “Microsoft 365 Copilot” metric category. The metric is computed based on your employees’ actions in Copilot and multipliers derived from Microsoft’s research on Copilot users. Use this new available metric for your own custom Copilot reports.
Summary
We hope you enjoy these new enhancements to Copilot reporting to help you accelerate adoption and impact of AI at your organization. We’ll keep you posted as more enhancements become available to measure Copilot.
by Contributed | Aug 28, 2024 | Technology
This article is contributed. See the original author and article here.
In this blog post I am going to talk about splitting logs to multiple tables and opting for basic tier to save cost in Microsoft Sentinel. Before we delve into the details, let’s try to understand what problem we are going to solve with this approach.
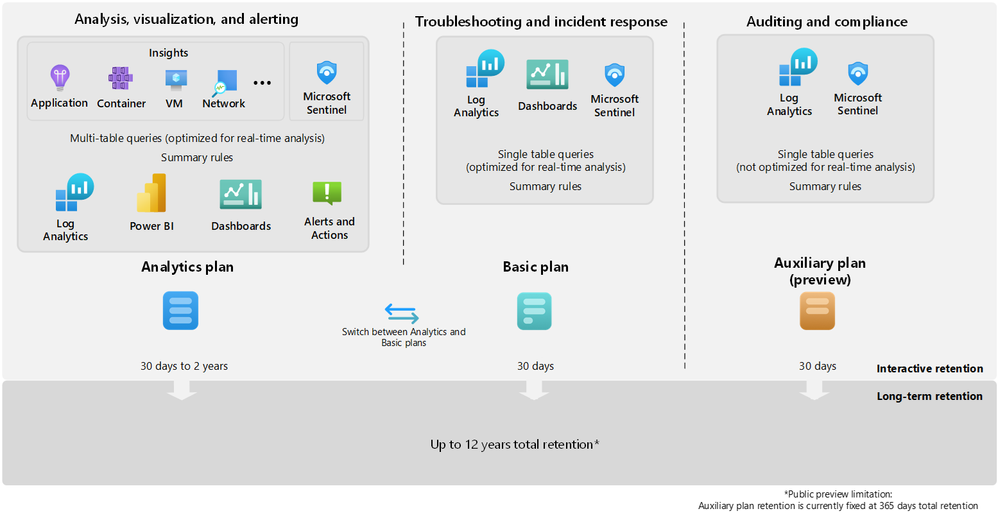
Azure Monitor offers several log plans which our customers can opt for depending on their use cases. These log plans include:
- Analytics Logs – This plan is designed for frequent, concurrent access and supports interactive usage by multiple users. This plan drives the features in Azure Monitor Insights and powers Microsoft Sentinel. It is designed to manage critical and frequently accessed logs optimized for dashboards, alerts, and business advanced queries.
- Basic Logs – Improved to support even richer troubleshooting and incident response with fast queries while saving costs. Now available with a longer retention period and the addition of KQL operators to aggregate and lookup.
- Auxiliary Logs – Our new, inexpensive log plan that enables ingestion and management of verbose logs needed for auditing and compliance scenarios. These may be queried with KQL on an infrequent basis and used to generate summaries.
Following diagram provides detailed information about the log plans and their use cases:

I would also recommend going through our public documentation for detailed insights about feature-wise comparison for the log plans which should help you in taking right decisions for choosing the correct log plans.
**Note** Auxiliary logs are out of scope for this blog post, I will write a separate blog on the Auxiliary logs later.
So far, we know about different log plans available and their use cases.
The next question is which tables support Analytics and Basic log plan?
You can switch between the Analytics and Basic plans; the change takes effect on existing data in the table immediately.
When you change a table’s plan from Analytics to Basic, Azure monitor treats any data that’s older than 30 days as long-term retention data based on the total retention period set for the table. In other words, the total retention period of the table remains unchanged, unless you explicitly modify the long-term retention period.
Check our public documentation for more information on setting the table plan.
I will focus on splitting Syslog table and setting up the DCR-based table to Basic tier in this blog.
Typically Firewall logs contribute to high volume of log ingestion to a SIEM solution.
In order to manage cost in Microsoft Sentinel its highly recommended to thoroughly review the logs and identify which logs can be moved to Basic log plan.
At a high level, the following steps should be enough to achieve this task:
- Ingest Firewall logs to Microsoft Sentinel with the help of Linux Log Forwarder via Azure Monitor Agent.
- Assuming the log is getting ingested in Syslog table, create a custom table with same schema as Syslog table.
- Update the DCR template to split the logs.
- Set the table plan to Basic for the identified DCR-based custom table.
- Set the required retention period of the table.
At this point, I anticipate you already have log forwarder set up and able to ingest Firewall logs to Microsoft Sentinel’s workspace.
Let’s focus on creating a custom table now
This part used to be cumbersome but not anymore, thanks to my colleague Marko Lauren who has done a fantastic job in creating this PowerShell Script which can create a custom table easily. All you need to do is to enter the pre-existing table name and the script will create a new DCR-Based custom table with same schema.
Let’s see it in action:
- Download the script locally.
- Open the script in PowerShell ISE and update workspace ID & resource ID details as shown below.

- Save it locally and upload to Azure PowerShell.
- Load the file and enter the table name from which you wish to copy the schema.
- Provide the new table name as per your wish, ensure the name has suffix “_CL” as shown below:

This should create a new DCR-based custom table which you can check in Log Analytics Workspace > Table blade as shown below:

**Note** We highly recommend you should review the PowerShell script thoroughly and do proper testing before executing it in production. We don’t take any responsibility for the script.
The next step is to update the Data Collection Rule template to split the logs
Since we already created custom table, we should create a transformation logic to split the logs and send less relevant log to the custom table which we are going to set to Basic log tier.
For demo purposes, I’m going to split logs based on SeverityLevel. I will drop “info” logs from Syslog table and stream it to Syslog_CL table.
Let’s see how it works:
- Browse to Data Collection Rule blade.
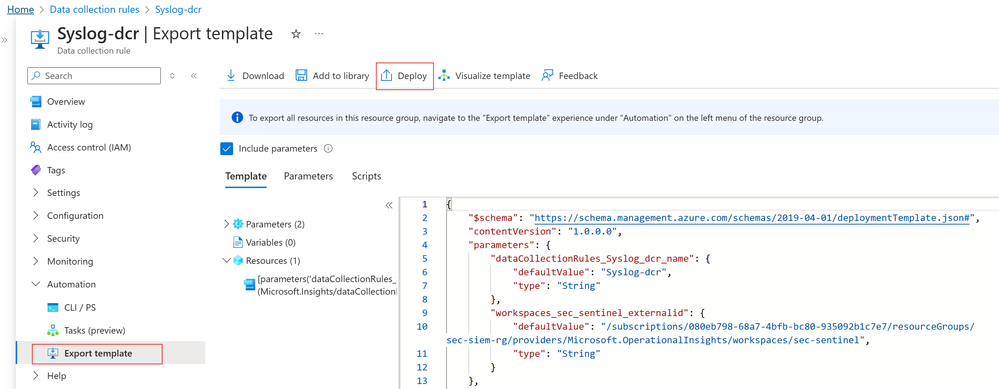
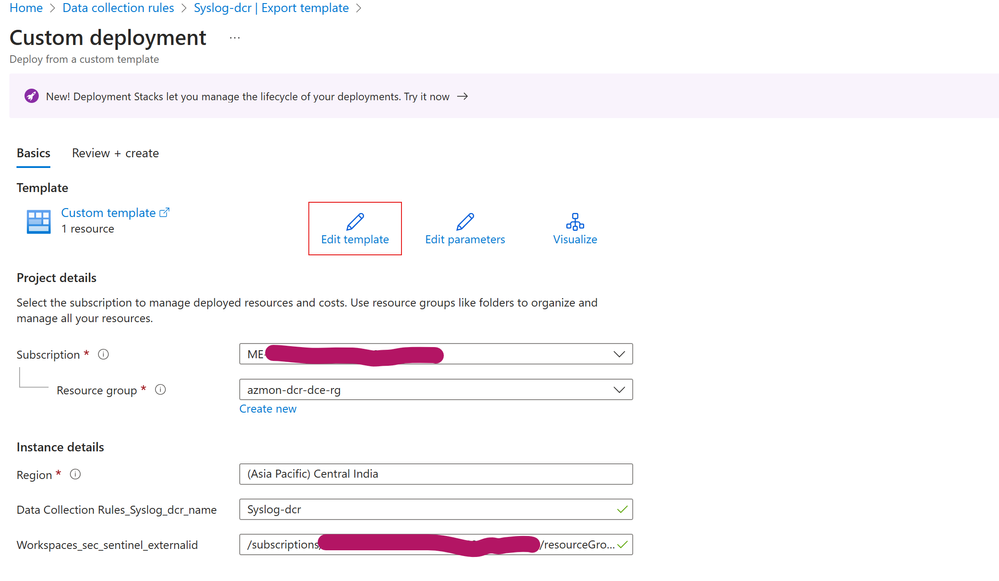
- Open the DCR for Syslog table, click on Export template > Deploy > Edit Template as shown below:
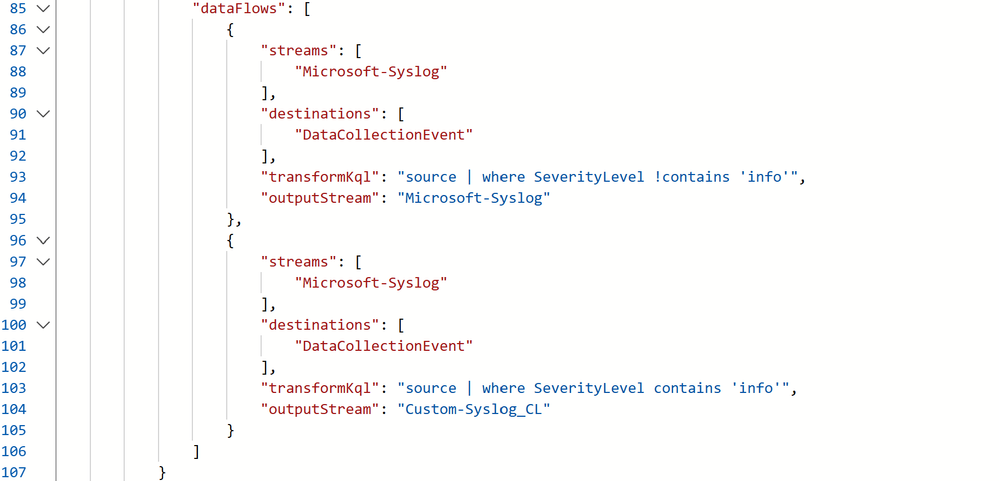
- In the dataFlows section, I’ve created 2 streams for splitting the logs. Details about the streams as follows:
- 1st Stream: It’s going to drop the Syslog messages where SeverityLevel is “info” and send the logs to Syslog table.
- 2nd Stream: It’s going to capture all Syslog messages where SeverityLevel is “info” and send the logs to Syslog_CL table.
Let’s validate if it really works
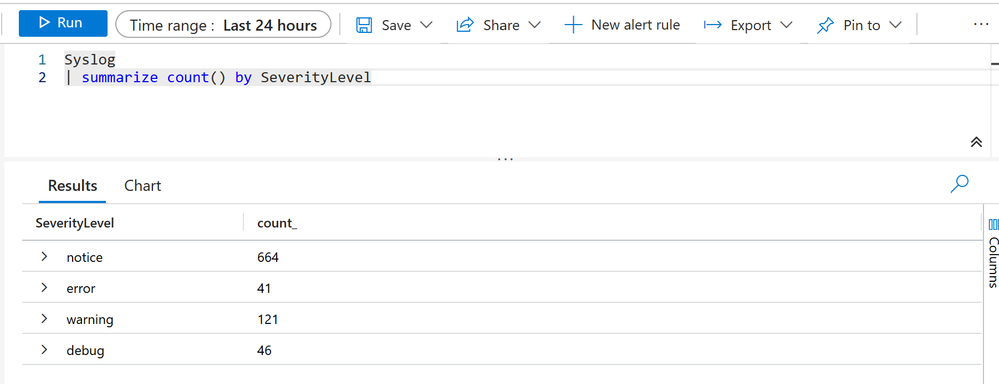
Go to the Log Analytics Workspace > Logs and check if the tables contains the data which we have defined it for.
In my case as we can see, Syslog table contains all logs except those where SeverityLevel is “info”
Additionally, our custom table: Syslog_CL contains those Syslog data where SeverityLevel is “info”

Now the next part is to set the Syslog_CL table to Basic log plan
Since Syslog_CL is a DCR-based custom table, we can set it to Basic log plan. Steps are straightforward:
- Go to the Log Analytics Workspace > Tables
- Search for the table: Syslog_CL
- Click on the ellipsis on the right side and click on Manage table as shown below:

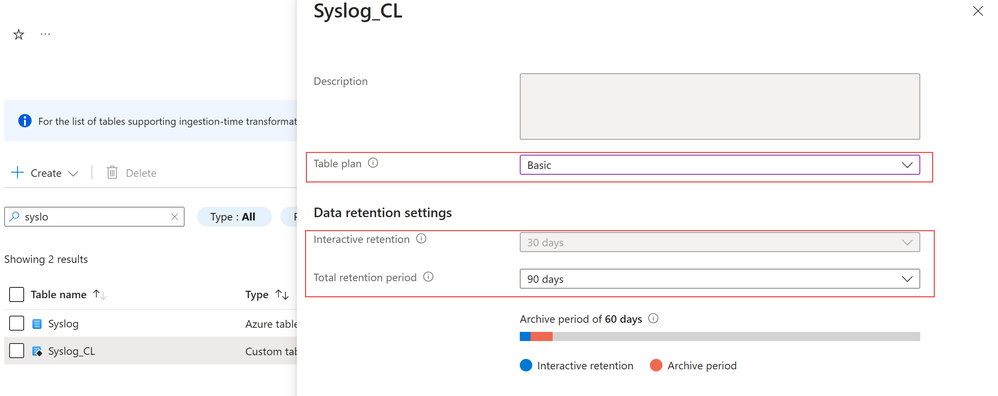
- Select the table plan to Basic and set desired retention period
Now you can enjoy some cost benefits, hope this helps.


Recent Comments