
by Contributed | Apr 10, 2023 | Business, Microsoft 365, Technology
This article is contributed. See the original author and article here.
In this post, we’ll dive into the impressive results at Mural, and share four ways other ISVs can attract customers, win more deals, and scale business on Microsoft Teams.
The post 4 ways ISVs like Mural increase revenue and retain customers on Microsoft Teams appeared first on Microsoft 365 Blog.
Brought to you by Dr. Ware, Microsoft Office 365 Silver Partner, Charleston SC.
by Contributed | Apr 7, 2023 | Technology
This article is contributed. See the original author and article here.
Microsoft Graph APIs have improved consistently over the years.
In 2021, one highly demanded feature, Application Only or granular access to individual site instead of whole tenant, was implemented, this scope is called “Sites.Selected”.
Initially, for this scope, there are two permission levels that can assigned to the Applications, “read” and “write.”
Some customers found there are management tasks cannot be executed with even “write” permission level. To address that, “fullcontrol” and “manage” permission level was added this year.
Here are the steps to implement App Only Sites.Selected permissions:
Step I, Register AAD Application in Azure Portal, https://portal.azure.com, and let’s call this Application “Target Application”.
Please see these articles for details:
Quickstart: Register an app in the Microsoft identity platform – Microsoft Entra | Microsoft Learn
Tutorial: Register an app with Azure Active Directory (Microsoft Dataverse) – Power Apps | Microsoft…
Once you registered the Target Application, copy below information to a text file:
Display name: Contoso Time Manager App
Client Id: d806f38b-a107****-1ec8e90c8ccc
Client Secret: XZW8Q*****855JDEw1cxP
Directory(tenant) ID: 31********95c59c1b
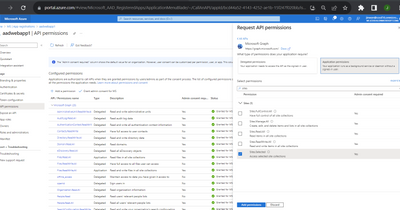
Step II, Give Target Application the permission for Graph API and/or SharePoint API in Azure Portal depending on whether you will access the site resource with
Graph API, like, https://graph.microsoft.com/v1.0/…
or SharePoint Rest API, like, https://contoso.sharepoint.com/sites/demo/_api/…
If you need to use Graph API to access SharePoint, you give Graph API permissions.
If you need to use SharePoint APIs, for example, SPO Rest API, SPO CSOM, you give SharePoint API permissions.

Step III, Use Graph API endpoint listed in this article, https://learn.microsoft.com/en-us/graph/api/site-post-permissions?view=graph-rest-1.0&tabs=http , to assign Target Application the permission to specific SharePoint Online site.
POST https://graph.microsoft.com/v1.0/sites/{sitesId}/permissions
Content-Type: application/json{
 "roles": ["write"],
 "grantedToIdentities": [{
    "application": {
      "id": "89ea5c94-7736-4e25-95ad-3fa95f62b66e",  //Target Application’s Client Id
      "displayName": "Contoso Time Manager App"       //Target Application’s Display name
    }
  }]
}
The import thing is, to do that, you need to have another Application which has Sites.FullControl.All permission for Graph API, then you get an App Only AccessToken with this Application’s identity and you can make above call with Authorization Header, the value is “Bearer {tokenvalue}”.
Below is Fiddler Trace of the Graph API call to assign permission for the target Application:

POST https://graph.microsoft.com/v1.0/sites/fb1e20f2-56fc-4eb7-ae1d-a97804d224e2/permissions HTTP/1.1
Authorization: Bearer eyJ0eXAiOiJKV8CJY2R……………qtlW1WoBXu3fdR8G7R-
Accept: application/json
User-Agent: NONISV|SharePointPnP|PnPCore/1.11.2.0 (Microsoft Windows NT 10.0.22621.0)
Content-Type: application/json
Host: graph.microsoft.com
Content-Length: 132

{"roles":["write"],"grantedToIdentities":[{"application":{"id":"ea5f05ef-2a5c-418b-b679-0380b3e83fd3","displayName":"aadAppOnly"}}]}
Now, your Target Application has been given the permission to the specific site successfully!
If you have chosen Graph API Sites.Selected Application permission, you can use Graph API to access the site.
If you have chosen SharePoint Sites.Selected Application permission, you can use SharePoint Rest API or CSOM to access the site.
NOTE, For SharePoint APIs, you cannot use just client secret to do the authentication, you have to setup certificate to gain Access Token.
A. Graph API Test Run:
To Test the access to specific site, you can use following sample PowerShell script to get App Only Access Token and retrieve the site with Graph API, see reference https://learn.microsoft.com/en-us/graph/api/site-get?view=graph-rest-1.0&tabs=http
#AAD AppOnly for Graph API
$tenantId="{tenantId}"
$aadClientId = "{clientId}"
$aadClientSecret = "{clientSecret}"

$scopes =  "https://graph.microsoft.com/.default"
$loginURL = "https://login.microsoftonline.com/$tenantId/oauth2/v2.0/token"
$body = @{grant_type="client_credentials";client_id=$aadClientId;client_secret=$aadClientSecret;scope=$scopes}

$Token = Invoke-RestMethod -Method Post -Uri $loginURL -Body $body
$Token.access_token  #expires after one hour
$headerParams  = @{'Authorization'="$($Token.token_type) $($Token.access_token)"}
$headerParams

#Graph API call to get site
Invoke-WebRequest -Method Get -Headers $headerParams -Uri "https://graph.microsoft.com/v1.0/sites/contoso.sharepoint.com:/sites/demo"
Response:

If you try to access another site that permission has not been given to, you will get error (403) Forbidden.:

B. SharePoint API Access:
To make App only SPO REST and CSOM calls, you will need to generate certificates and upload the public key (.cer file) to Azure – App Registration – App – Certificates & secrets:

The simplest test script using PnP commands: Reference: Connect-PnPOnline | PnP PowerShell
$aadClientId = "*"
$SiteURL = https://contoso.sharepoint.com/sites/demo
$secure = ConvertTo-SecureString "***" -AsPlainText –Force

Connect-PnPOnline -Url $SiteURL -CertificatePath c:..test.pfx -Tenant contoso.onmicrosoft.com -ClientId $aadClientId  -CertificatePassword $Secure

Get-PnPSite
In other programming languages, you can use MSAL library to get the App Only Access Token with certificate through client credential flow, then you can attach that Token for the web requests, see reference: https://learn.microsoft.com/en-us/azure/active-directory/develop/sample-v2-code.
by Contributed | Apr 7, 2023 | Technology
This article is contributed. See the original author and article here.
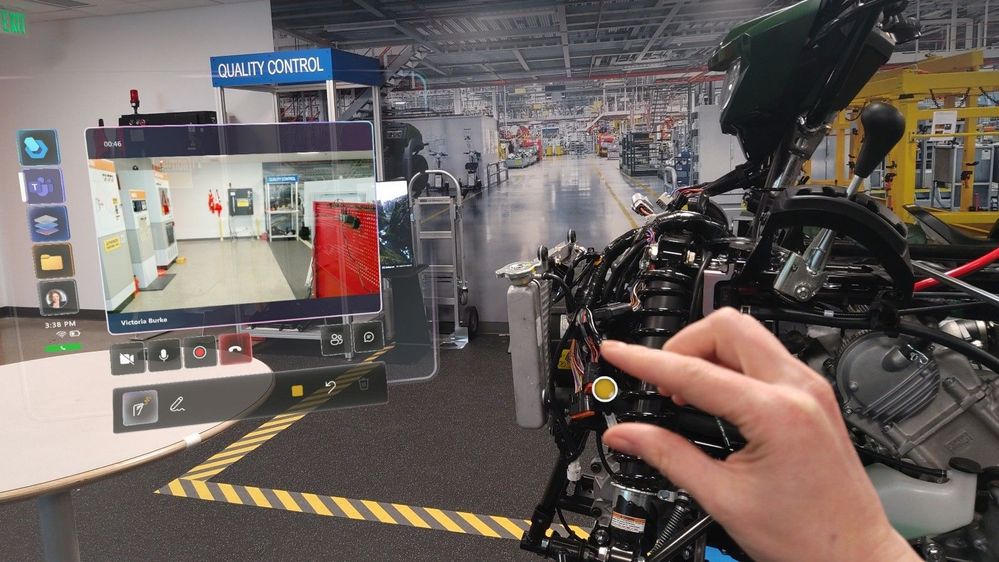
Microsoft aims to make mixed reality accessible and intuitive for frontline workers everywhere. With Dynamics 365 Guides, deskless workers use step-by-step holographic instructions to ensure process compliance, improve efficiency, and learn on the job.
In 2022 Teams capabilities were integrated into Guides, allowing users to collaborate with anyone anywhere in the world seamlessly. This enabled calling through the HoloLens 2 – allowing the remote participant (or participants, if on a group call) to “see-what-I-see” through the HoloLens user’s eyes. They can see what is happening in real-time, annotate in their colleagues’ 3-dimensional space, and share relevant files easily.
We’ve just released another set of features in Guides to make this new experience even more intuitive and reliable.

Draw anywhere with better annotations!
Imagine being able to point anywhere in your plant or facility and draw on any object, any surface, or anywhere in space to instantly show someone not only where to look but also how a physical object might look in that space. The possibilities for this feature don’t stop there.
On Dynamics 365 Guides and Remote Assist, an expert (working on a PC or mobile device) can draw in your world in 3D. As the frontline worker wearing the HoloLens, you can also draw on your space in digital ink. Traditionally, the HoloLens user could draw on a flat or semi-flat surface some ways off in the distance. With our recent annotation improvements, the HoloLens user can now draw anywhere in space in 3D. These drawings stick where they are added in the space and remain still. Users can walk around them and view them from different angles. We’ve brought similar improvements to annotating on surfaces so that the ink stays where intended, regardless of whether the user changes location or position. This means that for the HoloLens user, your entire world is now inkable, allowing you to annotate and share in real time.
Mixed Reality Teams calls
With Dynamics 365 Guides, the HoloLens user now has more pre-join settings when joining a Teams call. Before entering the call, the user can opt to toggle on/off video and can choose whether to mute themselves. As before, users can also toggle these settings once they are in the meeting. In spaces where confidentiality is core, this allows the frontline worker to use the HoloLens as their main calling device – without compromising on security.
We’ve also recently added restricted mode features, which enable your admin to restrict who can log on to the device and make calls, further driving our efforts to help you keep your company and your information secure.

Linking to Guides from within a Guide
Navigating through the steps of a guide is as intuitive as paging through a document or scrolling through a file, but what about links to jump from one file to another? We’ve added the ability to link directly from one guide to another by linking the new guide in an action step. This makes navigating between different sets of training materials or guides as easy as jumping to a new web page from a hyperlink. Learn the details of all our recent additions in Guides release notes.
What’s Next?
Stay tuned for more updates coming soon as we continue to build on the intuitive and frontline worker-focused features for Dynamics 365 Guides!
by Contributed | Apr 7, 2023 | Technology
This article is contributed. See the original author and article here.
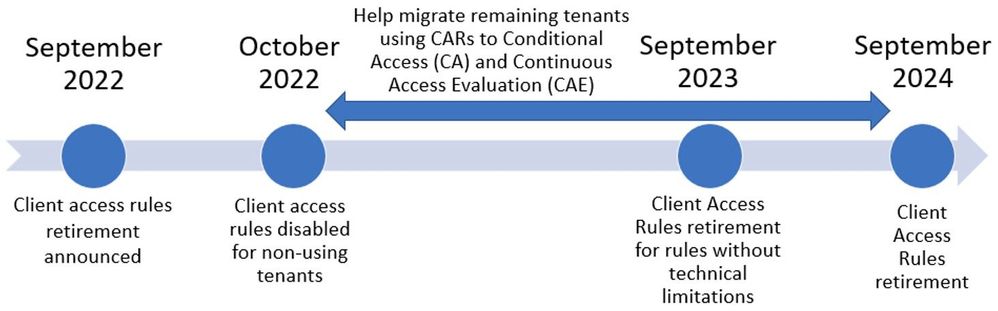
Last September, we announced the deprecation of Client Access Rules (CARs) in Exchange Online. CARs allow admins to control which devices can access their organization’s mailboxes. It was introduced in 2017 as a way to provide granular access control based on client properties such as IP addresses, protocol, or application.
In October 2022, we disabled CARs cmdlets for tenants that were not using CARs. This was done to reduce the complexity and confusion around CARs and to encourage the adoption of newer and more secure features like Azure Active Directory (AAD) Conditional Access and Continuous access evaluation (CAE).
We have been working with customers to learn how they use CARs and how they can migrate to these newer features, but we have encountered a few scenarios where it’s not possible to migrate current rules. For these scenarios, we will allow the use of CARs beyond the previously announced September 2023 deadline until we can support them.
We understand that migrating from CARs to Conditional Access and CAE requires some planning and testing, and we are here to help you with this process. If there is a technical reason preventing you from migrating your CARs, please open a support ticket so we can investigate and understand your needs.
Our updated CARs deprecation timeline is as follows:
Resources
The Exchange Team

by Contributed | Apr 6, 2023 | Technology
This article is contributed. See the original author and article here.
Connect with the Microsoft team on April 25-27 for the AIIM Conference 2023 (AIIM23) in New Orleans at the Hyatt Regency to learn more about business drivers and current trends impacting information management.
As an Elite Diamond Sponsor of this year’s conference, we’re excited to connect with the AIIM community of information management professionals! AIIM23 is three days of collaborative learning designed to help you master your organization’s content to operate more effectively, reduce costs, and manage risk. You’ll learn about transforming how business content is captured/created, processed/shared, and discovered/protected – so you can empower your people, enhance the customer experience, and drive business value.
We’ll have a large presence at AIIM23 representing Microsoft Syntex, Viva, and Purview. We’re looking forward to engaging with you during the event:
- Attend our keynote and sessions to learn more about our Future of Work vision (all times in CDT)
- Keynote: Unlocking productivity with Microsoft and Next-Generation AI with Marco Casalaina (VP, Products, Azure Cognitive Services) | April 26, 1:35-2:05pm
- Session: Introducing Microsoft Syntex – Content AI for the Microsoft Cloud with Kristen Kamath (Principal Product Manager, Microsoft Syntex) | April 26, 12:05-1:35pm
- Session: Microsoft Viva Topics – Empower your workforce with next-generation AI with Chris McNulty (Director, Product Marketing, Microsoft 365) | April 26, 3:55-4:25pm
- Session: How the World’s Largest Companies Deploy Microsoft Purview Records Management with Brendon Lee (Senior Product Manager, Microsoft Data Lifecycle and Records Management) | TBD
- Keynote panel: Information Management in the Age of AI with Marco Casalaina | April 27, 9:00-9:45am
- Visit our booth to talk to our team and our partners, attend mini-sessions, view new demos, ask questions, and get Syntex and Viva swag
- Go to the AIIM23 attendee party – sponsored by Microsoft
If you’re a customer attending AIIM23 or in the New Orleans area, you can also request a 1:1 meeting with our product team members and Global Black Belts.
Register for AIIM23 today! Use the discount code MICROSOFT_GUEST to save $100 on registration.
More upcoming events
In addition to AIIM23, we’d love to see you at one of the events below:
AIIM Webinar on Content AI and Microsoft Syntex
Is Content AI really a game-changer in business today? Find out at our upcoming webinar with AIIM on April 19, 11:00am PDT! Register for this webinar today and you’ll hear what Content AI is and learn some important best practices to leverage AI so you can enhance your content’s value and manage it at scale.
Microsoft 365 Conference
Catch up with us at the Microsoft 365 Conference, May 2-4, at the MGM Grand in Las Vegas. You’ll meet others in the Microsoft community from around the world as you learn about the latest collaboration tools and AI capabilities that are transforming the workplace and can help you grow your impact and career. Read the Microsoft 365 Conference blogpost to learn more about the event. Use discount code MSCUST150 to get $150 off conference registration.
Document Strategy Forum (DSF) ’23
Join us at DSF ’23 Charlotte, May 22-24 at Le Méridien Charlotte to learn more about how to create and manage content, communications, and strategies to support customer experiences. As a Corporate sponsor this year, you’ll find us at our keynote and at booth #303 talking about our Content AI solutions, including Microsoft Syntex. Read our Springtime is Syntex time blogpost to see how you can meet and engage with us. Use discount code DSF23VIP to save up to $600 on conference registration or receive a free exhibit hall pass.
We’re looking forward to seeing you in New Orleans or at an upcoming in-person or virtual event!

Recent Comments