by Contributed | Jun 13, 2023 | Technology
This article is contributed. See the original author and article here.
In today’s fast-paced digital world, databases are at the heart of almost every application or service. Databases are responsible for storing and managing vast amounts of data, providing real-time access to information, and powering critical business operations. As the amount of data and the number of users accessing databases continues to grow, it is essential to ensure that they can handle the expected workload and perform efficiently under heavy traffic. Whether you are launching a new application or getting ready for peak traffic, load testing helps you ensure that your database can handle the load and deliver reliable performance.
While most database queries typically happen through an application endpoint, there are situations where it is beneficial to directly test the database without involving intermediaries. One such scenario is when you want to assess the performance of a specific query without executing every query in the system or to evaluate the performance of a new query under heavy load. It could also be that your database is used by multiple applications.
In this blog post we will look at load testing Azure SQL Database using Azure Load Testing. You can use a similar approach to test other databases on Azure like MongoDB, PostgreSQL etc. We will cover everything you need to know, from setting up your JMeter script, to running the load test and identifying performance bottlenecks.
Setting up Azure SQL Database
The first step in load testing an Azure SQL Database is setting it up. You can use an existing Azure SQL Database instance. For this blog post, we’ll use a sample database. You can create your own sample instance using the Azure portal.
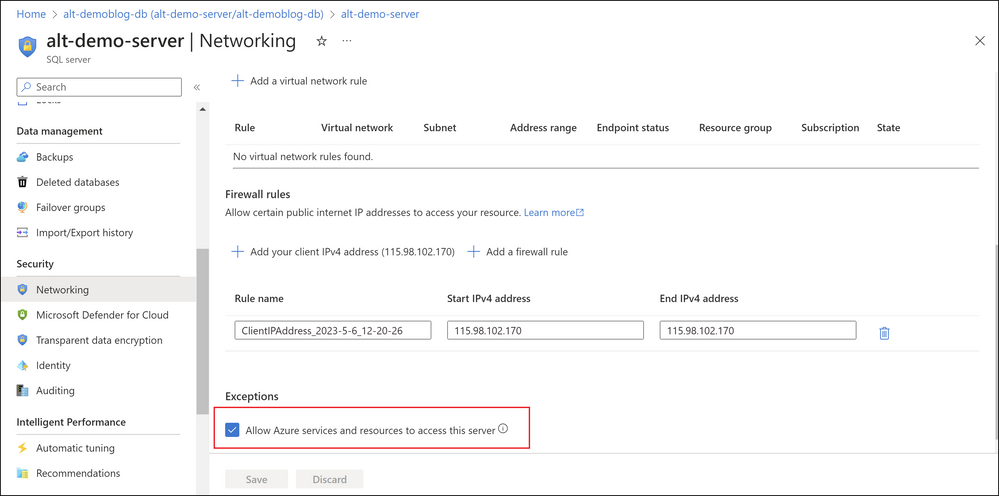
Once you have created the instance, note down the server name, database name, and login credentials. You will need these details later to connect JMeter to the database. Make sure to allow Azure services and resources to access your Azure SQL server as shown below.
Screenshot of Networking tab in Azure SQL Database
Setting up the JMeter script
To load test your Azure SQL DB you will need to download the Microsoft JDBC Driver for SQL Server . You can download the driver here. Follow the steps below to. You use the artifacts from the samples repository to set up the load test.
- Open JMeter and create a new test plan. In your JMeter Test Plan browse and choose the JDBC driver.
 Screenshot of JDBC driver configuration in JMeter GUI
- Add a JDBC Connection Configuration element to the test plan.
- The server name, database name , and login credentials for the Azure SQL Database instance are parameterized and can be provided using environment variables and secrets. You can store the password in an Azure Key Vault and access the same in your JMeter script using the GetSecret function. See the using secrets in Azure Load Testing docs for more detail.
 Screenshot of database configuration in JMeter GUI
 Screenshot of user defined variables in JMeter GUI
- Add a Thread Group element to the test plan.
- Configure the Thread Group element to simulate the desired number of users and requests. In this script we have parameterized the concurrent threads (users) and duration as environment variables.
- Add a JDBC Request element to the Thread Group.
- Enter the SQL query that you want to execute on the Azure SQL Database instance. You can add multiple requests for multiple queries.
- If your queries require input data, you can add a CSV input file to provide data to the JMeter script.
Running the load test
You can now run this script on Azure Load Testing.
- Create an Azure Load Testing resource if you don’t already have one.
- Create a test by selecting Upload a JMeter script.
- Upload the JMeter script, the JDBC driver and the CSV file. You need to upload this because it is not already installed on the test engine.
 Screenshot of test creation in Azure Load Testing
- In the parameters tab, add the following.
- The environment variable values for the following
- threads – the number of concurrent users per engine
- duration – the duration of the test.
- Database – the database URL
- Username – the username to login to the database
- The password as a secret. Enter the secret name and the secret identifier from the Azure Key Vault (AKV). Remember to grant ‘Get’ permission on secrets to this load testing resource on the AKV using managed identity.
 Screenshot of parameters in Azure Load Testing
- In the Monitoring tab, select your Azure SQL database instance. By default you can view the CPU percentage, connections failed and deadlocks for your SQL database.
- Select Review + Create to create and run the test.
Monitoring
Once the test run starts, you can monitor the client side and server side metrics on the dashboard in real time. The load begins to ramp up slowly to 150 virtual users and after the load reached the maximum virtual users, the database started returning errors. The errors are of type ‘request limit has exceeded’.
 Screenshot of test results in Azure Load Testing with errors
You can monitor the server side metrics as well to understand the reason for errors. You can click on Configure metrics to add additional metrics to monitor the performance of your database. As you can see, the average CPU percentage and average DTU percentage peaked after some time. Azure SQL Database recommends setting alerts for if the average CPU and DTU percentage go above 80%.
 Screenshot of test results in Azure Load Testing with high CPU and DTU percent
Fixing performance bottlenecks
Once you have identified performance issues, you can take steps to optimize the performance of your Azure SQL Database. Some tips to improve the performance of your Azure SQL Database include:
- Index optimization: Ensure that your database has the appropriate indexes to speed up query execution.
- Query optimization: Optimize your SQL queries to ensure that they are as efficient as possible.
- Scaling: Consider scaling up or out to increase the capacity of your Azure SQL Database.
In this case I know that my database is not able to handle the load because of the limit in DTUs. Now scale up the Azure SQL Database to 200 DTUs. Once done, re-run the test in Azure Load Testing and monitor the metrics.
 Screenshot of test results in Azure Load Testing with no errors
Now I see that there were no errors and the average CPU and DTU percentages were within acceptable limits.
 Screenshot of test results in Azure Load Testing with low CPU and DTU percent
Conclusion
In conclusion, load testing is an essential aspect of database performance testing. It helps to identify performance bottlenecks, improve database performance, and ensure that it can handle the expected workload. Remember, load testing should be an ongoing process, so make sure to integrate load tests in your CICD workflows to identify any issues early in the development lifecycle and optimize your database’s performance.
If you have any feedback on Azure Load Testing, let us know through our feedback forum. Refer to the previous blogs on Azure load testing here. The resources used in this blog post are available in the Azure Load Testing samples repository.
Happy Load Testing!
by Contributed | Jun 10, 2023 | Technology
This article is contributed. See the original author and article here.
Hi!
Ready to meet your new best friend? Say hello to GitHub Copilot, the AI pair programmer that’s about to change the way you code. It’s like having a super-smart friend who’s always ready to help. No matter the scenario, writing code, fixing bugs, or just trying to remember that one command you always forget.
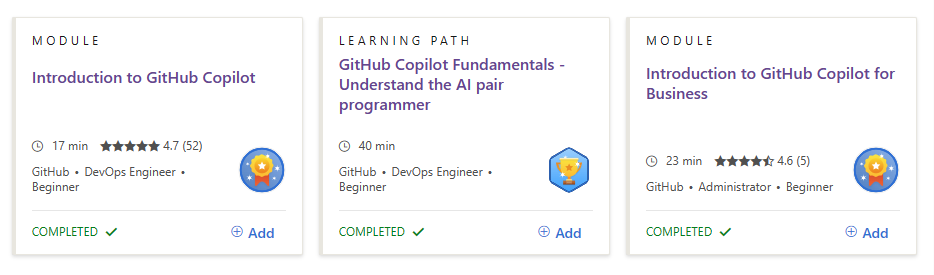
We’ve got a brand-new GitHub Copilot Fundamentals Learning Path all about GitHub Copilot. What’s a Learning Path, you may ask? Well, it’s a sequence of courses that guides you step-by-step to learn new skills and discover the power of Microsoft products. You can find all sorts of Learning Paths on Microsoft Learn.
Our new Learning Path is split into two parts: “Introduction to GitHub Copilot” and “Introduction to GitHub Copilot for Business“.
In the first part, you’ll get to know GitHub Copilot and all its cool features. It’s like having a ChatGPT friend right in your editor, helping you out with code, error messages, and even generating unit tests. Plus, it’s got your back when you’re working on pull requests or need help with documentation. And let’s not forget about the command line – GitHub Copilot CLI is like the ultimate cheat sheet!
The second part is all about GitHub Copilot for Business. (Spoiler: this is where things get serious). We’re going to review business scenarios like: AI-based security vulnerability filtering, VPN proxy support, and a super simple sign-up process. Imagine having a complete squad of Coding experts ready to help your business code faster and smarter.
So, what are you waiting for? Explore our new GitHub Copilot Fundamentals Learning Path and start learning how to code with your new AI friend today!
Happy Coding!
by Contributed | Jun 9, 2023 | Technology
This article is contributed. See the original author and article here.
Since Azure Stack HCI 21H2, customers have used Network ATC to:
- Reduce host networking deployment time, complexity, and errors
- Deploy the latest Microsoft validated and supported best practices
- Ensure configuration consistency across the cluster
- Eliminate configuration drift
Network ATC has led to HUGE reductions in customer support cases which means increased uptime for your business applications and less headaches for you! But what if you already deployed your cluster? How do you take advantage now that you’re travelled through that trepidatious train of thought against taking on new technology?
With minimal alliteration, this article will show you how to migrate an existing cluster to Network ATC so you can take advantage of all the benefits mentioned above. Once completed, you could easily cookie-cut this configuration across all new deployments using our previous blog; so this would be a one-time migration, and all new clusters will gain the benefits!
Before you begin
Since this is a live cluster with running VMs, we’ll take some precautions to ensure we’re never working on a host with a running VM on it. If you don’t have running workloads on these nodes, you don’t need these instructions. Just add your intent command as if this was a brand-new cluster.
As some background, Network ATC stores information in the cluster database which is then replicated to other nodes in the cluster. The Network ATC service on the other nodes in the cluster see the change in the cluster database and implements the new intent. So we setup the cluster to receive a new intent, but we can also control the rollout of the new intent by stopping or disabling the Network ATC service on nodes that have virtual machines on them.
Procedure
Step 1: Install the Network ATC feature
First, let’s install Network ATC on EVERY node in the cluster using the following command. This does not require a reboot.
Install-WindowsFeature -Name NetworkATC
Step 2: Pause one node in the cluster
Pause one node in the cluster. This node will be migrated to Network ATC. We’ll repeat this step later for other nodes in the cluster too. As a result of this pause, all workloads will migrate to other nodes in the cluster leaving this machine available for changes. To do this, you can use the command:
Suspend-ClusterNode
Step 3: Stop the Network ATC service
For all nodes that are not paused, stop and disable the Network ATC service. As a reminder, this is to prevent Network ATC from implementing the intent while there are running virtual machines. To do this, you can use the commands:
Set-Service  -Name NetworkATC -StartupType Disabled
Stop-Service -Name NetworkATC
Step 4: Remove existing configuration
Next, we’ll remove any previous configurations that might interfere with Network ATC’s ability to implement the intent. An example of this might be a Data Center Bridging (NetQos) policy for RDMA traffic. Network ATC will also deploy this, and if it sees a conflicting policy, Network ATC is wise enough not to interfere with it until you make it clear which policies you want to keep. While Network ATC will attempt to “adopt” the existing configuration if the names match (whether it be NetQos or other settings) it’s far simpler to just remove the existing configuration and let Network ATC redeploy.
Network ATC deploys a lot more than these items, but these are the items that need to be resolved before implementing the new intent.
VMSwitch
If you have more than one VMSwitch on this system, ensure you specify the switch attached to the adapters that will be used in this intent.
Get-VMSwitch -Name | Remove-VMSwitch -force
Data Center Bridging Configuration
Remove the existing DCB Configurations.
Get-NetQosTrafficClass | Remove-NetQosTrafficClass
Get-NetQosPolicy       | Remove-NetQosPolicy -Confirm:$false
Get-NetQosFlowControl  | Disable-NetQosFlowControl
LBFO
If you accidentally deployed an LBFO team, we’ll need to remove that as well. As you might have read, LBFO is not supported on Azure Stack HCI at all. Don’t worry, Network ATC will prevent these types of accidental oversights in the future as it will never deploy a solution that we do not support.
Get-NetLBFOTeam | Remove-NetLBFOTeam -Confirm:$true
SCVMM
If the nodes were configured via VMM, these configuration objects may need to be removed from VMM as well.
Step 5: Add the Network ATC intent
It’s now time to add a Network ATC intent. You’ll only need to do this once since Network ATC intents are implemented cluster wide. However, we have taken some precautions to control the speed of the rollout. In step 2, we paused this node so there are no running workloads on it. In step 3, we stopped and disabled the Network ATC service on nodes where there are running workloads.
If you stopped and disabled the Network ATC service, you should start this service on this node only. To do this, run the following command:
Set-Service   -Name NetworkATC -StartupType Automatic
Start-Service -Name NetworkATC
Now, add your Network ATC intent(s). There are some example intents listed on our documentation here.
Step 6: Verify deployment on one node
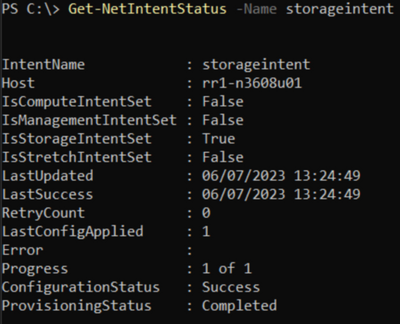
To verify that the node has successfully deployed the intent submitted in step 5, use the Get-NetIntentStatus command as shown below.
Get-NetIntentStatus -Name
The Get-NetIntentStatus command will show the deployment status of the requested intents. Eventually, there will be one object per intent returned from each node in the cluster. As a simple example, if you had a 3-node cluster with 2 intents, you would see 6 objects returned by this command, each with their own status.
Before moving on from this step, ensure that each intent you added has an entry for the host you’re working on, and the ConfigurationStatus shows Success. If the ConfigurationStatus shows “Failed” you should look to see if the Error message indicates why it failed. We have some quick resolutions listed in our documentation here.
Step 7: Rename the VMSwitch on other nodes
Now that one node is deployed with Network ATC, we’ll get ready to move on to the next node. To do this, we’ll migrate the VMs off the next node. This requires that the nodes have the same VMSwitch name as the node deployed with Network ATC. This is a non-disruptive change and can be done on all nodes at the same time.
Rename-VMSwitch -Name 'ExistingName' -NewName 'NewATCName'
Why don’t we change the Network ATC VMSwitch? Two reasons, the first is that Network ATC ensures that all nodes in the cluster have the same name to ensure live migrations and symmetry. The second is that you really shouldn’t need to worry about the VMSwitch name. This is simply a configuration artifact and just one more thing you’d need to ensure is perfectly deployed. Instead of that, Network ATC implements and controls the names of configuration objects.
Step 8: Resume the cluster node
This node is now ready to re-enter the cluster. Run this command to put it back into service:
Resume-ClusterNode
Step 9: Rinse and Repeat
Each node will need to go through the procedure outlined above. To complete the migration to Network ATC across the cluster, repeat steps 1 – 4, 6 and 8.
Summary
Migrating your existing clusters to Network ATC can be a game-changer for your cluster infrastructure and management. By automating and simplifying your network management, Network ATC can help you save time, increase efficiency, improve overall performance and avoid cluster downtime.
If you have any further questions or would like to learn more about Network ATC, please don’t hesitate to reach out to us!
Dan “Advanced Technology Coordinator” Cuomo


Recent Comments