by Scott Muniz | Jul 8, 2020 | Azure, Microsoft, Technology, Uncategorized
This article is contributed. See the original author and article here.
Azure Migrate first made its appearance in September 2017. Since being Generally Available in 2018 the team behind it have worked hard adding capabilities to the product that helps add organisations on that data centre migration journey.
The latest feature that the team have released in preview is the ability to assess your on prem VMware virtual machines and understand what that would look like if migrated to the Azure VMware Solution (AVS).
The Azure VMware Solution allows your VMware workloads to run natively within Azure. This solution allows you to keep managing your VMs with the familiar VMware tools while taking advantage of the Azure scale and functionality.
I’ve used the Azure Migrate: Server Assessment Tool with a lot of customers, in order to assess what their current on prem server estate would look like if migrated to Azure in regards to cost and also identify any compatibility issues that need to be dealt with before the migration can go ahead. It’s been useful and successfully used by many to plan their data centre transformation.
I’m pleased to see we now have the capability within Azure Migrate to help those who are looking to migrate their VMware environments from on prem to the Azure VMware Solution (AVS) understand cost implications and compatibility issues.
Discovery of your servers is still the same. You can either import your server estate information from a CSV file or utilize the Azure Migrate: Server Assessment appliance to discover the data within your VMware estate.
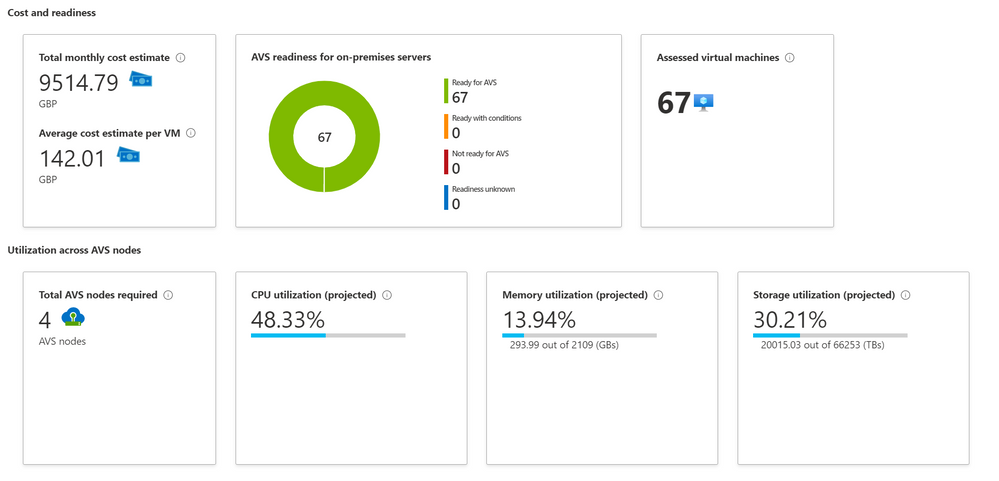
Azure Migrate will then help you create an assessment report specifically with hosting your workloads within Azure VMware Solution (AVS) in mind.
 Azure Migrate Assessment Output
The information back from the Azure Migrate Assessment will give you an indication of cost, how many AVS nodes you’ll need and how much CPU, Memory and Storage will be utilized if you moved your workload over to those AVS nodes.
This new feature within Azure Migrate is available in public preview, so is readily available for all to try today. So, if you currently have a VMware environment hosted on prem and would like to see what it would look like if hosted in AVS, give it a go today!
by Scott Muniz | Jul 8, 2020 | Azure, Microsoft, Technology, Uncategorized
This article is contributed. See the original author and article here.
Special thanks to “Ofer Shezaf”, “Yaniv Shasha” and “Bindiya Priyadarshini” that collaborating with me on this blog post
As highlighted in my last blog post about Azure Sentinel’s Side-by-Side approach with Splunk, there are in fact reasons that enterprises are using Side-by-Side architecture to take advantage of Azure Sentinel. Side-by-Side is not only about having both SIEMs operating at the same time, but it also provides flexibility for migration of existing SIEM and SOAR use cases to Azure Sentinel.
This blog describes how Azure Sentinel can be used Side-by-Side with QRadar.
The following options are available to ingest Azure Sentinel alerts into QRadar:
This blog post is going to cover the integration with Microsoft Graph Security API.
QRadar can collect events from data sources by using a plug-in called Device Support Module (DSM). IBM provides a DSM to collect data from the Microsoft Graph Security API.
Let’s start the configuration!
Preparation & Use
The following tasks describe the necessary preparation and configurations steps.
- Onboarding Azure Sentinel
- Registration of an application in Azure AD
- Preparation steps in QRadar
- Configuration steps in QRadar
- Using Azure Sentinel alerts in QRadar
Onboarding Azure Sentinel
Onboarding Azure Sentinel is not part of this blog post; however, required guidance can be found here.
Registering an Application in Azure AD
The steps required to register an app in Azure are described here. The registered app requires read access to the SecurityEvents.Read.All field in Microsoft Graph Security API.
For further configuration in QRadar, make a note of following settings:
- The Azure AD Application ID
- The Azure AD Application Secret
- The Tenant ID
Preparation Steps in QRadar
Using the Microsoft Graph Security API DSM to collect alerts from Azure Sentinel requires the following RPMs to be installed on QRadar:
- Protocol Common RPM
- Microsoft Graph Security API Protocol RPM
Download the latest version of RPMs from http://www.ibm.com/support and run the following commands to install the RPMs.
yum -y install DSM-DSMCommon-7.3-20190708191548.noarch.rpm
yum -y install PROTOCOL-MicrosoftGraphSecurityAPI-7.3-20200501003005.noarch.rpm
Preparation Steps in QRadar
Now it is time to use the QRadar portal.
Log on to the “QRadar portal“and click on “Admin“tab
Open the “QRadar Log Source Management“ screen and click on the “+New Log Source” button

Select “Single Log Source”

Search for “Universal DSM“, select it and click on “Step 2: Select Protocol Type”

Search for “Microsoft Graph Security API“, select it and click on “Step 3: Configure Log Source Parameters”

Type a “Name” and a “Description“, and configure “other parameters” , and click to “Step 4: Configure Protocol Parameters“

Add a “Log Source Identifier” and specify the parameters noted above when registering the Azure AD app (Azure AD Client ID, Azure AD Client Secret and Tenant ID).
If you want to filter only Azure Sentinel alerts from Microsoft Graph Security API, use the following filter in the parameter “Event Filter“.
provider eq ‘Azure Sentinel’

Click on “Step 5: Test Protocol Parameters” to continue with the wizard.

If you want to validate the configuration, click ”Start Test”, otherwise finish the configuration by clicking “Skip Test and Finish”.

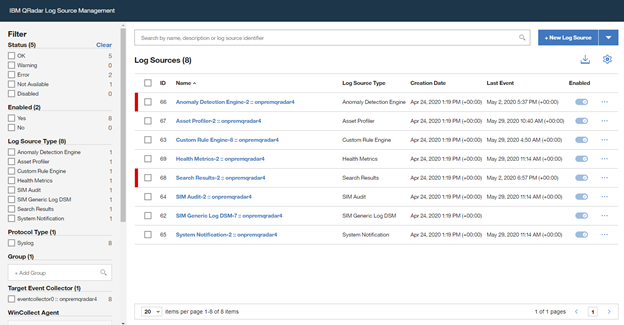
Once the wizard is closed, the created “Log Source” is shown on the “Log Source Management” screen.

However, the configuration is not finished yet, it must be deployed in the “QRadar Admin portal“. Click on “Deploy Change” to apply the configuration.

Using of Azure Sentinel alerts in QRadar
Once the alerts are ingested, you can query Azure Sentinel alerts in QRadar.
A sample RAW alert from Azure Sentinel collected from Microsoft Security Graph API looks as shown below.
{“eventDateTime“: “2020-06-08T10:39:58.3572933Z“, “category“: “xxxxxxxx-xxxx-xxxx-xxxx-xxxxxxxxxxxx_xxxxxxxx-xxxx-xxxx-xxxx-xxxxxxxxxxxx“, “azureSubscriptionId“: “xxxxxxxx-xxxx-xxxx-xxxx-xxxxxxxxxxxx”, “description“: “Identifies when an RDP connection is new or rare related to any logon type by a given account today based on comparison with the previous 14 days.nRDP connections are indicated by the EventID 4624 with LogonType = 10“, “status“: “newAlert“, “severity“: “medium“, “title“: “Rare RDP Connections“, “hostStates“: [{“netBiosName“: “CLIENT“, “fqdn“: “CLIENT.DOMAIN.LOCAL“}], “vendorInformation“: {“vendor“: “Microsoft“, “provider“: “Azure Sentinel“}, “createdDateTime“: “2020-06-22T10:45:00.0929766Z“, “lastModifiedDateTime“: “2020-06-22T10:45:00.1940637Z“, “userStates“: [{“userPrincipalName“: “user“, “emailRole“: “unknown“, “accountName“: “account“, “domainName“: “domain“}], “id“: “xxxxxxxx-xxxx-xxxx-xxxx-xxxxxxxxxxxx”, “azureTenantId“: “xxxxxxxx-xxxx-xxxx-xxxx-xxxxxxxxxxxx”}
Summary
We just walked through the process of standing up Azure Sentinel Side-by-Side with QRadar. Stay tuned for more Side-by-Side scenarios in our blog channel.
by Scott Muniz | Jul 8, 2020 | Azure, Microsoft, Technology, Uncategorized
This article is contributed. See the original author and article here.
v:* {behavior:url(#default#VML);}
o:* {behavior:url(#default#VML);}
w:* {behavior:url(#default#VML);}
.shape {behavior:url(#default#VML);}
Sarah Young
Normal
Sarah Young
2
168
2020-06-03T23:46:00Z
2020-06-03T23:46:00Z
6
1100
6275
52
14
7361
16.00
0x0101001375AE3D4E6C9D4BA2C69EC322D353A4
Clean
Clean
false
false
false
false
EN-NZ
X-NONE
<w:LidThemeComplexscript>X-NONE</w:LidThemeComplexscript>
Azure Sentinel has several different APIs that you can interact with, and we’ve recently released the Sentinel Management API to add another API into the mix. This topic can – initially – be slightly confusing as we have APIs at both the Sentinel and Log Analytics level that can both be used in conjunction with Azure Sentinel. In this article we are going to explore the following:
- What APIs Sentinel has available
- How to authenticate to each API
- What you can use each API for
- Tools that you can use with the APIs
Overview of Sentinel APIs
We can categorize Azure Sentinel APIs as follows:
- Azure Sentinel Management API
- Microsoft Graph Security API
- Log Analytics API
- HTTP Data Collector API
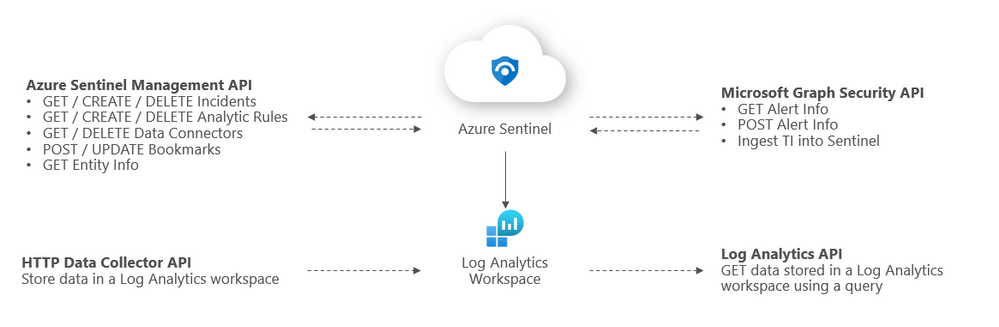
The below diagram summarizes where the different APIs within Sentinel sit architecturally and what calls can be made to them:

Azure Sentinel Management API
The Sentinel Management API allows you to manage aspects of Azure Sentinel specifically outside of Log Analytics e.g. incidents and analytic rules. The GitHub repo link to our API branches can be found here.
Sentinel Management API uses*
- GET / CREATE / DELETE incidents
- GET / CREATE / DELETE analytic rules
- GET / DELETE data connectors
- POST / UPDATE bookmarks
- GET entity info
*Please refer to the GitHub repo for a comprehensive list of API uses.
Example API call
GET https://management.azure.com/subscriptions/{subscriptionID}/resourceGroups/{resourcegroup}/providers/Microsoft.OperationalInsights/workspaces/{workspaceID}/providers/Microsoft.SecurityInsights/incidents/?api-version=2019-01-01-preview
Sentinel Management API authentication
Register an application in Azure AD. To authenticate to the Sentinel Management API, grant Sentinel Contributor / Azure Sentinel Responder / Azure Sentinel Reader” permissions* to the application created in the IAM setting of the Resource Group where Azure Sentinel has been built:
*Adhering to the principle of least privilege, always grant the lowest possible permissions required to your API.

Tools to use with this API
The most common use for the API is to automate the deployment and update of Analytics alert rules and hunting queries. Wortell has created a PowerShell tool called AzSentinel and this can be used to export and import all rules from a workspace. @Javier Soriano and @Philippe Zenhaeusern have implemented a CI/CD flow using GitHub, Azure DevOps, and the Sentinel automation capabilities. It enables you to manage rules, queries, playbooks, workbooks, and more on GitHub and have them continuously deployed to your Sentinel workspace which you can read about here.
Microsoft Graph Security API
You may be familiar with the Graph Security API from using other Microsoft security products. The Microsoft Graph Security API provides a unified interface and schema to integrate with security solutions from Microsoft and ecosystem partners. The Microsoft Graph Security API federates queries to all onboarded security providers and aggregates responses. @Stefan Simon blogged about ingesting M365 alerts into Sentinel on MS Tech Community, the link to this article is here.
Microsoft Graph Security API uses
- GET security alerts.
- POST security alerts.
- Ingest TI into Sentinel.
More details on calling the Graph Security API can be found here.
Example API call
GET https://graph.microsoft.com/v1.0/security/alerts?$filter=vendorInformation/provider eq
‘Azure Sentinel’
Microsoft Graph Security authentication
To authenticate to the Graph Security API, you need to register an app in Azure AD and grant the app permissions to Microsoft Graph:
- SecurityEvents.Read.All or;
- SecurityEvents.ReadWrite.All*
*Adhering to the principle of least privilege, always grant the lowest possible permissions required to your API.

More details on authenticating to the Graph Security API can be found here.
Tools to use with this API
https://docs.microsoft.com/en-us/graph/api/resources/security-api-overview?view=graph-rest-1.0#alerts
https://docs.microsoft.com/en-us/azure/sentinel/connect-threat-intelligence#connect-azure-sentinel-to-your-threat-intelligence-platform
Log Analytics API
The Log Analytics API allows you to query a Log Analytics workspace, including workspaces that have Sentinel set up on them. @rinure blogged on this topic previously in on MS Tech Community and went into great detail, you can read his blog here.
Log Analytics API uses
- GET / POST data stored in a Log Analytics workspace*
*sometimes POST requests will need to be used to read data (not to send data to the LA workspace). More details on the API request format can be found here.
Example API call
GET https://api.loganalytics.io/v1/workspaces/{workspace-id}/query?query=AzureActivity%20|%20summarize%20count()%20by%20Category

Authorization: Bearer <access token>
Log Analytics API authentication
To authenticate to the Log Analytics API, you need to register an app in Azure AD and grant the app Data.Read permissions to the Log Analytics API:

Next, go to the IAM section of your Sentinel Log Analytics workspace and grant “Log Analytics Reader” or “Log Analytics Contributor” permission to the application*:
*Adhering to the principle of least privilege, always grant the lowest possible permissions required to your API.

Limitations of the Log Analytics API
As well as call rate limits and daily quota caps, there are also limits on queries themselves:
- Queries cannot return more than 500,000 rows
- Queries cannot return more than 64,000,000 bytes (~61 MiB total data)
- Queries cannot run longer than 10 minutes by default. See this for details.
For up to date limitations of the Log Analytics API, please see here.
Tools to use with this API
There are some tools that already use the API and can make life simpler:
HTTP Data Collector API (Public Preview)
You can use the HTTP Data Collector API to send log data to a Log Analytics from any client that can call a REST API. This might be a runbook in Azure Automation that collects management data from Azure or another cloud, or it might be an alternate management system that uses Azure Monitor to consolidate and analyze log data. More details about this connector can be found here.

HTTP Data Collector API uses
- POST data to a Log Analytics workspace
Example API call
We’ve put together a simple C# console application to demonstrate how you can leverage the HTTP Data Collector API to post data to Log Analytics custom logs, click here for details.
HTTP Data Collector API authentication
Any request to the Azure Monitor HTTP Data Collector API must include an authorization header. To authenticate a request, you must sign the request with either the primary or the secondary key for the workspace that is making the request. Then, pass that signature as part of the request.
Authorization: SharedKey <WorkspaceID>:<Signature>
HTTP Data Collector API limitations
There are some constraints around the data posted to the HTTP Data Collector API.
- Maximum of 30 MB per post to Azure Monitor Data Collector API. This is a size limit for a single post. If the data from a single post that exceeds 30 MB, you should split the data up to smaller sized chunks and send them concurrently.
- Maximum of 32 KB limit for field values. If the field value is greater than 32 KB, the data will be truncated.
- Recommended maximum number of fields for a given type is 50. This is a practical limit from a usability and search experience perspective.
- A table in a Log Analytics workspace only supports up to 500 columns (referred to as a field in this article).
- The maximum number of characters for the column name is 500.
For up to date limitations of the HTTP Data Collector API, please see here.
Tools to use with this API
The API and the different ways to use it are discussed in the custom connectors blog post.
Summary
You have many options to interface with Azure Sentinel using APIs, and what method you choose will depend on what you’re ultimately trying to achieve and your organization’s use cases. This blog post was intended to serve as a brief introduction to APIs in Sentinel. If you’d like to dive deeper into this topic, we’d encourage you to watch our presentation on Extending and Integrating Sentinel (APIs) from our Security Community webinar series and to check out @Ofer_Shezaf‘s accompanying tech community post here.
The diagrams in this article were drawn by @Takeshi Muto. Credit to @Chi Nguyen for the sample HTTP Data Collector API in our GitHub repo. Final thanks to @Ofer_Shezaf for reviewing the content.
by Scott Muniz | Jul 8, 2020 | Azure, Microsoft, Technology, Uncategorized
This article is contributed. See the original author and article here.
For enterprise and industrial customers with connected equipment and devices, a higher level of network security is an important part of protecting business-critical investments and infrastructure. When bringing connected devices onto a corporate network, customers want control and visibility over exactly what devices are connected. Instead of authenticating a device to a network using a password, which can be shared among multiple devices, secured enterprise Wi-Fi relies on mechanisms to support unique authentication of each device.
Extensible Authentication Protocol-Transport Layer Security (EAP-TLS) is a common authentication method used in such security-focused, enterprise scenarios. Azure Sphere supports the EAP-TLS protocol to secure the connections to an access point via certificates on a device. The use of device certificates is more secure than sharing a global key among all devices.

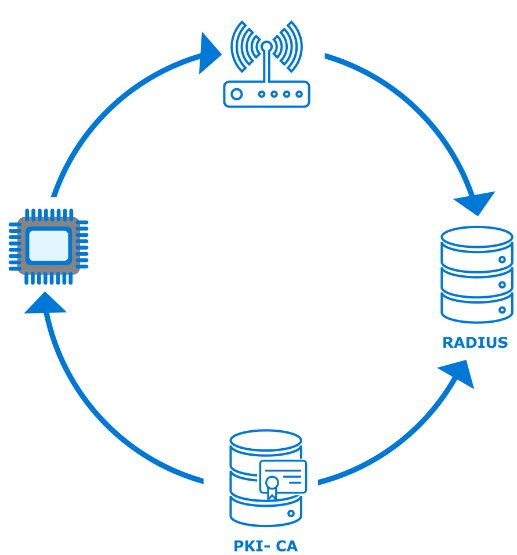
To use EAP-TLS to connect to an access point, the network administrator must configure a RADIUS server and the access point(s) for WPA2-Enterprise and EAP-TLS. In this scenario a certificate authority (CA) generates client and server authentication certificates for the devices as well as the RADIUS server.
This post does not cover the details for the customer network configuration or PKI components; these items are well documented for network administrators setting up an enterprise network. Azure Sphere’s implementation on the client ensures that the customer maintains control over the existing network and security infrastructure.
This post will cover the basic steps needed to load a valid certificate, to configure a new EAP-TLS network with the certificate, and to connect to your secured network via the command line or programmatically.
How to get started
Certificate acquisition
In the 20.04 release of the Azure Sphere OS, we added the ability to connect to a secured Wi-Fi network via EAP-TLS. There are multiple ways a device can acquire a certificate with the private key. Which pattern you choose to use depends on your network as well as your manufacturing and distribution process, but it can be summarized into two methods:
- Sideload the data during manufacturing or upon delivery of a device from a connected computer that contains the data and uses the azsphere command line interface to load it.
- Bootstrap the data via an existing open or PSK network which has internet access. In this scenario, you must ensure there is a secure delivery mechanism, such as an on-premises web service that can authenticate, manage, and securely transport the certificate and private key to the device.
Certificate formats
Azure Sphere supports RSA x509 certificates in the .PEM file format in PKCS1 and PKCS8 syntax. Azure Sphere devices have about 24KB of onboard storage for certificates, managed by the OS. Applications can use the Certstore API to manage the certificates.
Enable secure enterprise Wi-Fi access using the azsphere command line tool
During testing and development, use the azsphere command-line tool to quickly iterate and test device connectivity.
New functionality in azsphere device certificate allows certificate management
|
Verb
|
Information
|
|
add
|
Adds a certificate to the attached device’s certificate store.
|
|
delete
|
Deletes a certificate from the attached device’s certificate store.
|
|
list
|
Lists the certificates in the attached device’s certificate store.
|
|
show
|
Shows details about a certificate in the attached device’s certificate store.
|
|
show-quota
|
Displays the available free space in the attached device’s certificate store.
|
New parameters in azsphere device wifi add
|
Verb
|
Information
|
|
clientcertid
|
A string value (up to 16 characters) that identifies the client certificate (containing both the public and private key). Required to set up an EAP-TLS etwork.
|
|
clientid
|
ID recognized for authentication by this network’s RADIUS server. Required for some EAP-TLS networks.
|
|
rootcacertid
|
A string value (up to 16 characters) that identifies the server’s root CA certificate for EAP-TLS networks where the device authenticates the server.
|
Programming model
Before an application can load certificates, its application manifest (app_manifest.json) must include the new CertStore capability. Likewise, to enable secure enterprise Wi-Fi access, the application manifest must include the EnterpriseWifiConfig capability.

The certificate data consists of the client authentication certificate, its corresponding private key, and the public certificate for the RootCA of the RADIUS server. After this data is loaded, the application must set the WifiConfig_Security_Wpa2_EAP_TLS flag used to indicate that the Wi-Fi security type is EAP-TLS.
The certificate data is then associated with the network, so the device can connect to the network using the specified client ID and certificate data.
Next Steps
Check out the EAP-TLS feature overview: https://docs.microsoft.com/azure-sphere/network/eap-tls-overview
Samples are available:
- Loading and managing certificates: https://github.com/Azure/azure-sphere-samples/tree/master/Samples/Certificates
- Configuring secure enterprise Wi-Fi access: https://github.com/Azure/azure-sphere-samples/tree/master/Samples/WiFi/WiFi_HighLevelApp
by Scott Muniz | Jul 8, 2020 | Azure, Microsoft, Technology, Uncategorized
This article is contributed. See the original author and article here.
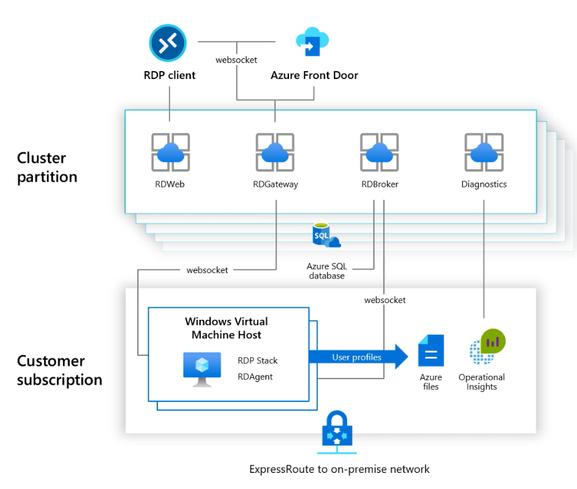
In this post, we’ll explain how to configure Azure Monitor with Azure Log Analytics in Microsoft Azure, so you can proactively monitor your Azure Resource Manager (ARM)-based Windows Virtual Desktop environment.
As shown in the diagram below, Azure Monitor can collect diagnostic data and operational insights from a variety of sources. You can monitor data for your workspace and virtual machine (VM) performance as well as tiered session information from your host pools, operating system and the services it relies on, and the platform itself.
 Diagram of how data flows in and out of your Windows Virtual Desktop environment
By following the steps in this post, you can create a dashboard that provides access to insights about key elements of your Windows Virtual Desktop deployment, such as:
- Session details
- Session diagnostics
- User specific reporting
- Session performance
- Host performance
- Disk performance
 Screenshot of the Windows Virtual Desktop dashboard Overview screen
Top three insights in the Windows Virtual Desktop workspace
The custom dashboard gives you visibility of key elements for your Windows Virtual Desktop workspace. Here, we’re highlighting the top three insights: session details, host pool performance, and disk performance.
Session details
The dashboard view below shows the status of the most important session details—including top hosts, active users, and more—for your Windows Virtual Desktop workspace.
 Screenshot of the Session Details dashboard for Windows Virtual Desktop
Host pool performance
In this dashboard, you can collect and view information about the performance and registration statuses of your hosts.
 Screenshot of the Host Performance dashboard for Windows Virtual Desktop
Disk performance
Through the Disk Performance dashboard you can view captured information about the storage level consumption of your profile container—virtual (logical) disks. This information can help you measure input/output operations per second (IOPS) and latency to your Azure Files or Azure NetApp Files environment regarding FSLogix Profile Container use in your Windows Virtual Desktop workspace.
 Screenshot of the Disk Performance dashboard for Windows Virtual Desktop
Prerequisites
To monitor your ARM-based Windows Virtual Desktop environment, be sure you have the following prerequisites in place:
- Windows Virtual Desktop environment based on ARM (spring 2020 update)
- Log Analytics workspace
- Azure Active Directory Premium P1 or P2 license
- The following role based access control (RBAC) and identity and access manager (IAM) object roles:
Creating a Log Analytics workspace
- Search for Log Analytics and select Log Analytics workspaces.
 Searching for and selecting the Log Analytics workspaces service
- Select Add.
 Adding a Log Analytics workspace
- Name your Log Analytics workspace. Here, we’ve named our workspace wvdmonitorarm.
- Make sure that you are using the Pay-As-You-Go pricing tier.
Note: You can calculate your Azure Monitoring costs upfront using the Azure Monitoring pricing calculator. The price will vary based on the time period required to capture data. For more information on optimizing costs, see Manage usage and costs with Azure Monitor Logs.
- Create the Log Analytics workspace.
 Reviewing and creating the Log Analytics workspace
Enable diagnostics on your Windows Virtual Desktop workspace
- Go to the Windows Virtual Desktop service on Azure and open the components of the service that you want to monitor.
- Select the host pool you want to monitor and open Diagnostic settings.
 Screenshot of pathway to host pool diagnostic settings
- Check the desired log categories to activate them for the host pool.
 Specifying diagnostic settings and sending them to the Log Analytics workspace
- Check Send to Log Analytics and designate the workspace as the destination for diagnostic data.
- Repeat the same steps for Workspaces and Application groups.
Enable virtual machine insights to install the Workspace agent
To install the Workspace agent on the session hosts as part of your Windows Virtual Desktop host pool(s), perform the following steps.
- Search for and select Monitor in Azure services.
 Searching for and selecting Monitor in Azure services
- Select Virtual Machines under Insights.
- Select Not monitored.
- Expand the resource group that contains your Windows Virtual Desktop hosts.
 Screenshot of Monitor page in Azure for Virtual Machines
- Select Enable.
 Screenshot of page during monitoring configuration
The agent will automatically be installed and pushed to the session hosts via Azure extensions. For additional information, see Enable Azure Monitor for VMs overview.
Collect performance counters
- Open the Log Analytics workspace.
- Select Advanced settings.
- Follow the DataWindows Performance Counters path.
Note: Limits on API batches require collecting two batches of performance counters in the Log Analytics workspace.
- Select the + button to add the first 20 performance counters.
Note: To avoid the “BatchRequestsLimitExceeded” error message, add a maximum of 20 counters for each batch.
Batch collection 1
|
Terminal Services Session(*)% Processor Time
|
|
Terminal Services(*)Active Sessions
|
|
Terminal Services(*)Inactive Sessions
|
|
Terminal Services(*)Total Sessions
|
|
LogicalDisk(*)% Free Space
|
|
LogicalDisk(*)Avg. Disk sec/Read
|
|
LogicalDisk(*)Avg. Disk sec/Write
|
|
LogicalDisk(*)Current Disk Queue Length
|
|
LogicalDisk(*)Disk Reads/sec
|
|
LogicalDisk(*)Disk Transfers/sec
|
|
LogicalDisk(*)Disk Writes/sec
|
|
LogicalDisk(*)Free Megabytes
|
|
Processor(_Total)% Processor Time
|
|
Memory(*)% Committed Bytes In Use
|
|
Network Adapter(*)Bytes Received/sec
|
|
Network Adapter(*)Bytes Sent/sec
|
|
Process(*)% Processor Time
|
|
Process(*)% User Time
|
|
Process(*)IO Read Operations/sec
|
- Change the Sample Interval for all counters to 60 seconds.
- Select Save.
 Screenshot of Advanced settings, path to performance counters, and addition of performance counters in the Log Analytics workspace
- Add the second batch of performance counters.
Batch collection 2
|
Process(*)IO Write Operations/sec
|
|
Process(*)Thread Count
|
|
Process(*)Working Set
|
|
RemoteFX Graphics(*)Average Encoding Time
|
|
RemoteFX Graphics(*)Frames Skipped/Second – Insufficient Client Resources
|
|
RemoteFX Graphics(*)Frames Skipped/Second – Insufficient Network Resources
|
|
RemoteFX Graphics(*)Frames Skipped/Second – Insufficient Server Resources
|
|
RemoteFX Network(*)Current TCP Bandwidth
|
|
RemoteFX Network(*)Current TCP RTT
|
|
RemoteFX Network(*)Current UDP Bandwidth
|
|
RemoteFX Network(*)Current UDP RTT
|
- As with the first batch, change the Sample Interval for all counters to 60 seconds.
Note: If you do not change the Sample Interval, you may find that your workspace ingests more data, which can result in unexpected costs.
- Select Save.
Creating a workbook in Azure Monitor
- Go to Azure Monitor.
- Go to Workbooks and create a new workbook in Azure Monitor by selecting New.
 Creating a new workbook in Azure Monitor
- In the blank workbook that appears, select the </> button to access the Code – Advanced Editor.
 Screenshot of blank workbook page ready for code to be added
- Copy the code from this sample into the code area for the workbook, replacing the sample code in this workbook: https://github.com/wvdcommunity/AzureMonitor/blob/master/wvd-springrelease-workbook.json
- Select Apply.
 Applying code for the workbook
- Select the Done editing button in the Monitor Workbooks dashboard.
- The log information will fill the custom workbook as shown below.
 Screenshot of the Windows Virtual Desktop dashboard with workbook insights
- Name and save the workbook. (In the example below, we’ve named the workbook Windows Virtual Desktop).
 Naming and saving the Monitor workbook
- Select the SignInLogs diagnostic setting in Azure Active Directory to activate the Logon Location Heatmap diagnostic data.
Note: If you skip activating the Logon Location Heatmap diagnostic data, the error message shown below will appear. For more details, see Integrate Azure AD logs with Azure Monitor logs.
 View of error message “No logons detected in the last 7 days”
Sample queries
Now that you’ve enabled diagnostic data, here are some sample queries you can run.
Current active sessions
Perf
| where ObjectName == "Terminal Services"
| where CounterName == "Active Sessions"
| summarize arg_max(TimeGenerated, *) by Computer
| project Computer, CounterName, CounterValue
Current disconnected sessions
Perf
| where ObjectName == "Terminal Services"
| where CounterName == "Inactive Sessions"
| summarize arg_max(TimeGenerated, *) by Computer
| project Computer, CounterName, CounterValue
Current total sessions
Perf
| where ObjectName == "Terminal Services"
| where CounterName == "Total Sessions"
| summarize arg_max(TimeGenerated, *) by Computer
| project Computer, CounterName, CounterValue
Average and maximum sessions
Perf
| where ObjectName == "Terminal Services"
| where CounterName == "Total Sessions"
| summarize AggregatedValue = avg(CounterValue) by bin(TimeGenerated, 1h), Computer
Perf
| where ObjectName == "Terminal Services"
| where CounterName == "Total Sessions"
| summarize AggregatedValue = max(CounterValue) by bin(TimeGenerated, 1h), Computer
Session duration per user
let Events = WVDConnections | where UserName == 'username';
Events
| where State == "Connected"
| project CorrelationId , UserName, ResourceAlias , StartTime=TimeGenerated
| join (Events
| where State == "Completed"
| project EndTime=TimeGenerated, CorrelationId)
on CorrelationId
| project Duration = EndTime - StartTime, ResourceAlias
| sort by Duration desc
CPU, memory, disk, network usage per host
Logical disk:
Perf
| where ObjectName == "LogicalDisk" and CounterName == "% Free Space"
| where InstanceName <> "_Total"
| summarize AggregatedValue = avg(CounterValue) by bin(TimeGenerated, 10m), Computer, InstanceName
Processor:
Perf
| where ObjectName == "Processor" and CounterName == "% Processor Time"
| summarize AggregatedValue = avg(CounterValue) by bin(TimeGenerated, 10m), Computer, InstanceName
Memory:
Perf
| where ObjectName == "Memory" and CounterName == "% Committed Bytes In Use"
| summarize AggregatedValue = avg(CounterValue) by bin(TimeGenerated, 10m), Computer, InstanceName
Network:
Perf
| where ObjectName == "Network Interface"
| summarize AggregatedValue = avg(CounterValue) by bin(TimeGenerated, 10m), Computer, InstanceName, CounterName
Processor utilization per user:
Perf
| where ObjectName == "Process"
| join
(
VMProcess
| where UserName !contains "system" and UserName !contains "service"
| extend InstanceName = ExecutableName
| project TimeGenerated, InstanceName, Computer, UserName, UserDomain
)
on InstanceName
| summarize AggregatedValue = avg(CounterValue) by bin(TimeGenerated, 10m), InstanceName, CounterName, UserName, Computer
Inbound/outbound network bytes per user
VMConnection
| join
(
VMProcess
| where UserName !contains "system" and UserName !contains "service"
| extend ProcessName = ExecutableName
| project TimeGenerated, ProcessName, Computer, UserName, UserDomain
)
on ProcessName
RTT perf counter for RDP
Perf
| where ObjectName == "RemoteFX Network"
| where CounterName == "Current TCP RTT" or CounterName == "Current UDP RTT"
| summarize AggregatedValue = avg(CounterValue) by bin(TimeGenerated, 1h), Computer, InstanceName
Windows Virtual Desktop client type distribution
WVDConnections
| where State == "Connected"
| summarize ClientCount = dcount(UserName) by ClientOS, ClientVersion
Client types
WVDConnections
| where State == "Connected"
| extend ClientOSType = pack("ClientOSVersion", ClientOS)
| summarize AggregatedValue = count() by ClientOS
Windows Virtual Desktop agent health status
Heartbeat
| summarize heartbeat_count = count() by bin(TimeGenerated, 30m), Computer // bin is used to set the time grain to 30 minutes
| extend Available=iff(heartbeat_count > 0, true, false)
| summarize LastCall = max(TimeGenerated) by Computer, alive
| project Computer, LastCall, alive
Daily active users
Perf
| where ObjectName contains "Terminal Services" and CounterName == "Total Sessions"
| summarize TotalSessions = max(CounterValue) by bin(TimeGenerated, 1d), Computer
Top 10 hosts by CPU utilization
Perf
| where ObjectName == "Processor" and CounterName == "% Processor Time"
| summarize AggregatedValue = avg(CounterValue) by bin(TimeGenerated, 1h), Computer
| where AggregatedValue > 80
| order by AggregatedValue desc
| take 10
Disk performance
Perf
| where ObjectName == "PhysicalDisk" and CounterName == "Avg. Disk Bytes/Read" and InstanceName !contains "Total"
| parse InstanceName with * " " DriveLetter
| summarize AggregatedValue = avg(CounterValue) by bin(TimeGenerated, 10m), Computer, DriveLetter
Add the Windows Virtual Desktop workbook your Azure dashboard
Creating a custom dashboard as a landing page for your Azure portal is beneficial. This dashboard can also be used as a central page for your IT department.
- Open the custom Windows Virtual Desktop workbook you created in Azure Monitor.
- Select the pin buttons for the views you want to add to your Azure dashboard.
 Pinning views of monitoring data to the dashboard
- You can add all views at one time by selecting Pin Workbook in editing mode.
- When you are finished pinning the workbook, select Done Pinning.
 Selecting Done Pinning button
- Select the Dashboard menu.
 Selecting the Dashboard to prepare for personalizing it with resource tiles
- Arrange the resource tiles to personalize the dashboard.
- Select Done customizing,
 Arranging resource tiles on the Windows Virtual Desktop Workspace Dashboard
This is an example of a workspace dashboard with tiles arranged:
 Screenshot of a Windows Virtual Desktop Workspace Dashboard with resource tiles arranged
- Select the Auto refresh interval for the dashboard. Log Analytics metrics will refresh at the same rate as the dashboard.
- Select Apply.
 Selecting and applying refresh intervals for the dashboard
Learn more
If you run into issues during setup, see Troubleshooting overview, feedback, and support for more information.
To stay informed about the latest Windows Virtual Desktop enhancements, join the Windows Virtual Desktop community on Tech Community, where you can also connect with the Windows Virtual Desktop Engineering team and your fellow public preview participants. For more information on tools that can help you empower end users to work securely in a remote work world, see Brad Anderson’s post on New tools to help IT empower employees securely in a remote work world.
This blog post, which comes from a collaboration of different teams within Microsoft, aims to empower our customers on the ARM-based Windows Virtual Desktop. The information in this post is community driven. Nothing is officially launched by the Windows Virtual Desktop product team. I want to highlight @VanessaBruwer, @JasonByway and @ThomasVuylsteke at Microsoft for their work creating the custom workbook.
We welcome your feedback, comments, and questions below.

Recent Comments