This article is contributed. See the original author and article here.
In today’s connected world, voice communication remains a cornerstone of customer engagement. Whether it’s a support call for customer service or a telehealth session with a doctor, call quality and reliability are critical. That’s where our enriched telemetry and insights come in. Equipped with comprehensive telemetry data, developers and IT teams can monitor, detect, diagnose, and resolve issues with voice call performance, regardless of the calling service provider.
This blog post will guide you through the powerful diagnostics and telemetry tools available in Dynamics 365. You’ll see how they can enhance your contact center’s efficiency and customer satisfaction. By leveraging these tools, you can ensure seamless voice communication, proactively address potential issues, and deliver an exceptional experience to your customers!
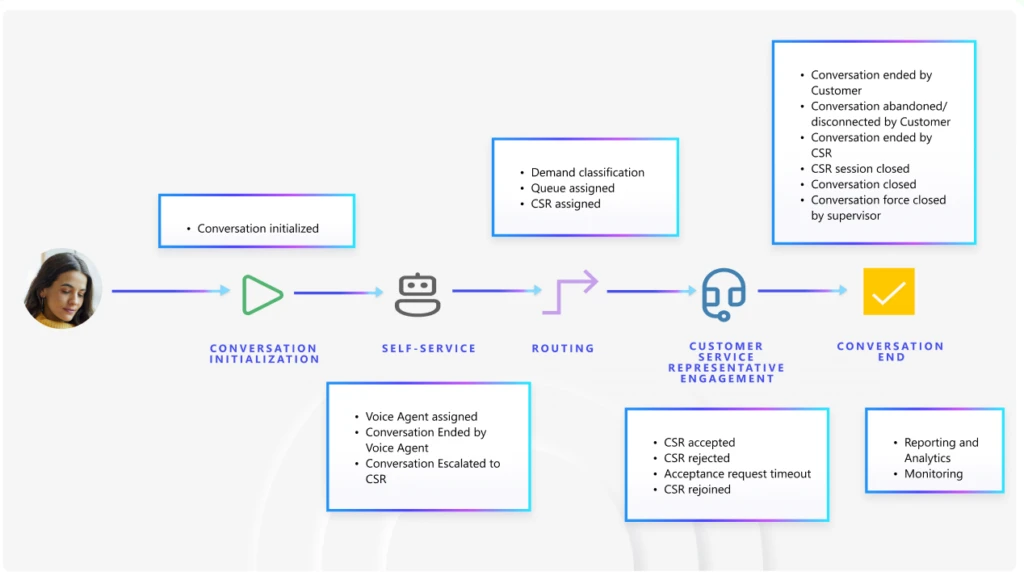
For either an inbound call where callers are calling into the contact center, or outbound calls where agents are contacting customers, there is a lifecycle to every conversation. This lifecycle is typically as below.
We have a wide range of Azure monitoring tools, including Application Insights and Azure Communication Service (ACS) Call Diagnostics in Call Diagnostics Center (CDC). These tools, integrated through Azure Monitor and AppInsights, serve different layers of the communication stack and can be complementary when used together. The telemetry in these tools is usually available within 15 minutes, making them apt for monitoring.
The conversation lifecycle in Application Insights
The conversation lifecycle paints a full picture of the call and does the following:
- Captures operational conversation events: initiation, voice agent handoff, routing to queues, and agent assignment until resolution.
- Enables monitoring workflow health, agent performance, and customer service representatives’ performance, as well as customer experience.
- Integrates directly with Application Insights to track conversation telemetry and build custom dashboards.
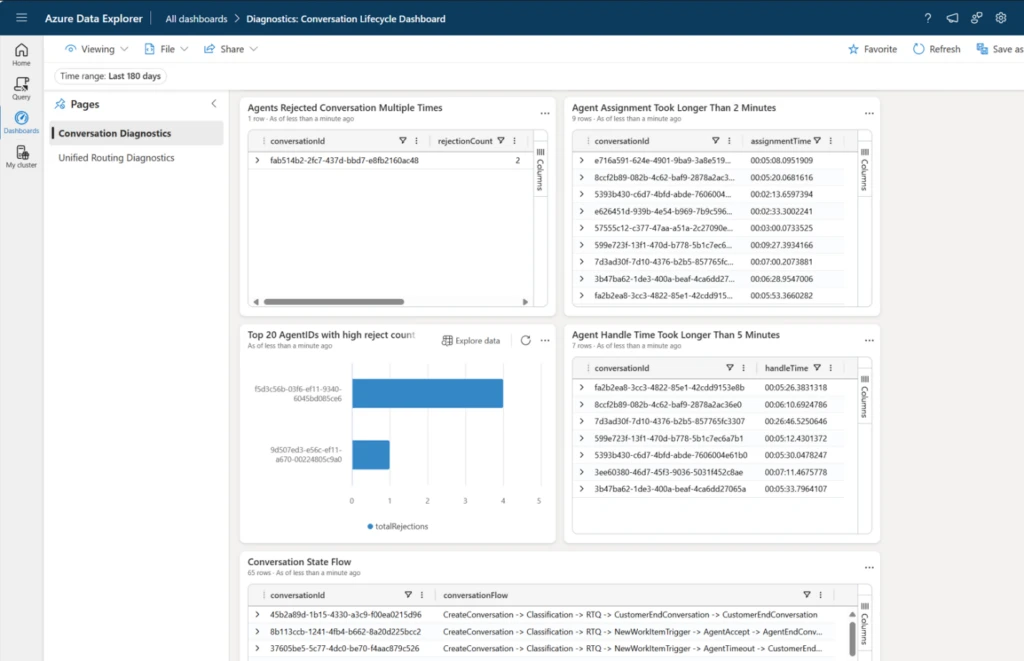
- Enables telemetry analysis using our pre-built Azure Data Explorer dashboards. Or, you can simply use these queries to create your own custom queries suited to your business needs. See the sample query here: Configure conversation diagnostics (preview) | Microsoft Learn
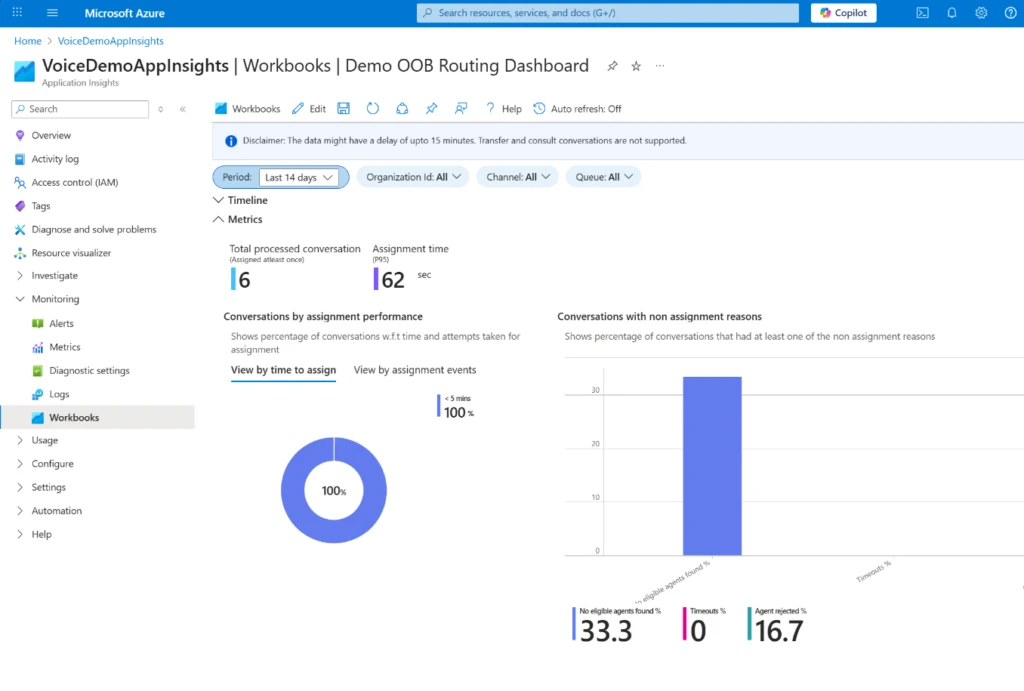
You can now enable out-of-the-box workbooks for viewing all this telemetry in one place. These are in preview right now to try out. Reach out to D365CS_Diagnostics@microsoft.com to enable the reports.
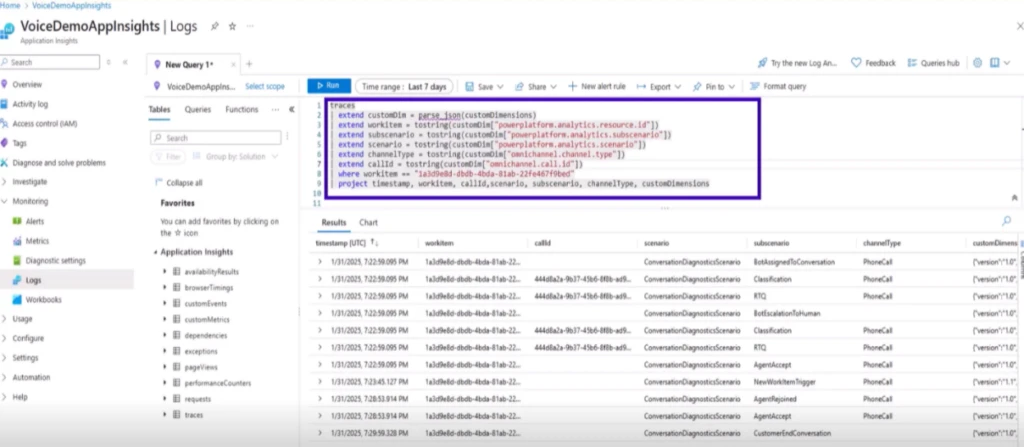
You can also build and edit your own queries in the editor to answer your business questions.
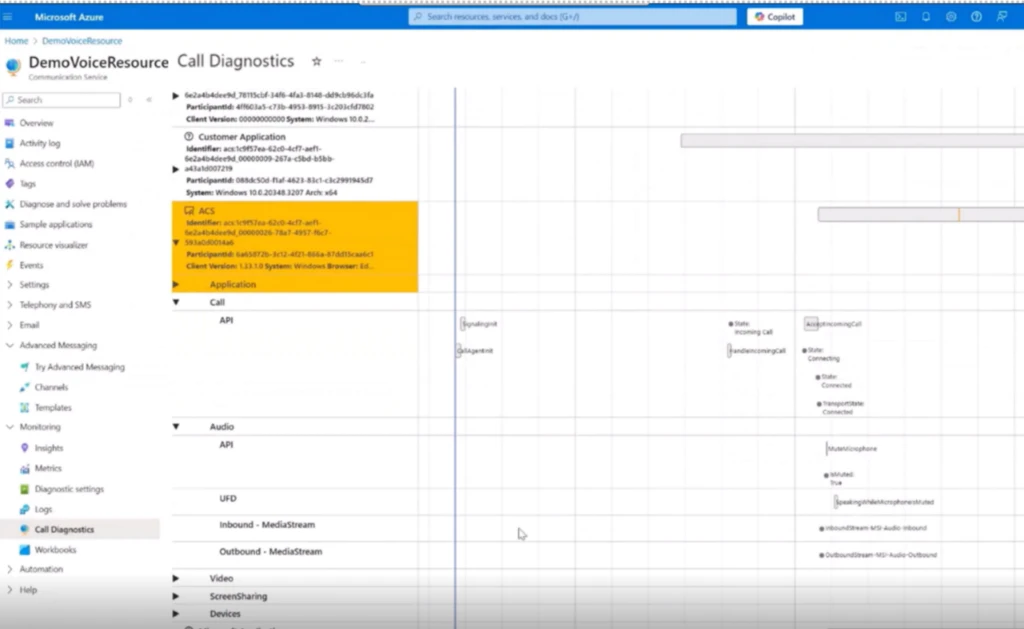
ACS call diagnostics
Azure Communication Service (ACS) call diagnostics in Call Diagnostics Center (CDC) help you analyze call telemetry and does the following:
- Focuses on media telemetry: audio/video quality, jitter, packet loss, latency, device issues.
- Enables technical troubleshooting of call quality and client-side performance.
- Can be used for calls from any PSTN operator.
- Enables data to be routed to Log Analytics via Azure Monitor for querying and alerting.
You can see these insights in interactive timelines and log analytics workbooks, making it easier to pinpoint the root cause of call quality issues. To learn more, go to Azure Communication Services Call Diagnostics | Microsoft Learn.
Performance in voice and video
ACS recently rolled out additional telemetry on performance that is handy for identifying and debugging scenarios that have higher than normal latency. You can:
- Identify calling SDK APIs that are high latency, for P95 or even P99.
- Drill down into individual API scenarios to show detailed performance trend.
Additional information is available in Azure Communication Services Voice and Video Insights | Microsoft Learn
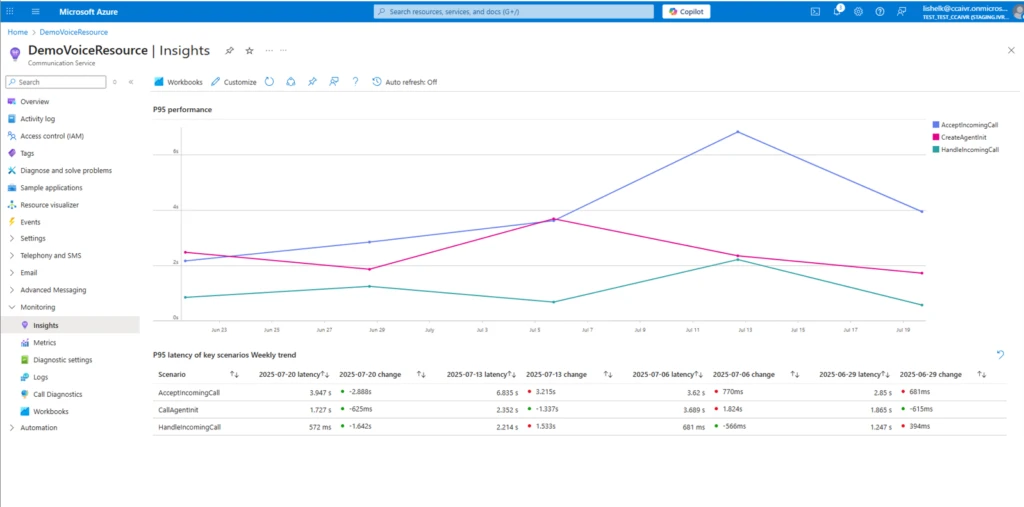
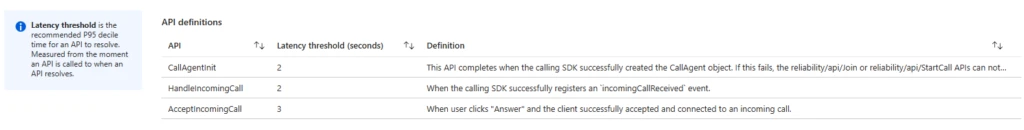
You can also see the P95 latency thresholds on this page to use as guidance.
Use cases
Let’s understand how you can use these tools through a couple of common use cases.
Case 1: Optimizing for assignments
As a supervisor, you are tasked with keeping customer service representative assignment time around 3 minutes on average. If assignment time begins to rise, maintaining the same service level requires proactive measures. With assistance from an IT admin, you configure a monitor in Application Insights using conversation lifecycle telemetry. You set the average assignment time to 2 minutes and receive email alerts if the number rises, enabling adjustments.
traces

| extend customDim = parse_json(customDimensions)

| extend

       conversationId =tostring(customDim["powerplatform.analytics.resource.id"]),

       subscenario = tostring(customDim["powerplatform.analytics.subscenario"])

| where subscenario in ("RTQ", "AgentAccept")

| project timestamp, conversationId, subscenario;

let latestRTQsBeforeAgentAccept = subscenarios

| where subscenario == "RTQ"

| join kind=inner (subscenarios

    | where subscenario == "AgentAccept"

    | project agentAcceptTime = timestamp, conversationId) on conversationId

| where timestamp  2min

| project conversationId, assignmentTime
With this query, the alert has a severity of 2, indicating Warning. Additionally, you can select how and when to summarize results, and how frequently to evaluate the calls, and where to send the alerts to. For a critical metric such as assignment time, selecting your evaluation to run every 15 minutes will cost $0.50 a month.
In the midst of a typical day, an alert notifies you that assignment time has exceeded 150 seconds for more than 10 calls in the past 15 minutes. You reach out to the IT admin, who swiftly jumps into action.
Leveraging the tools at their disposal, they begin diagnosing. They first look at the conversations exceeding 150s in the dashboard they set up using Azure Data Explorer Dashboards. There are more than 30 conversations by now where assignment time has exceeded 150 seconds. They choose a few and view their conversation state flow within the built-in views. The IT admin observes an unusually high queue volume. To manage the surge, an overflow rule is triggered, initiating callbacks. The callback duration is then factored into the assignment time, resulting in a higher-than-normal average assignment times.
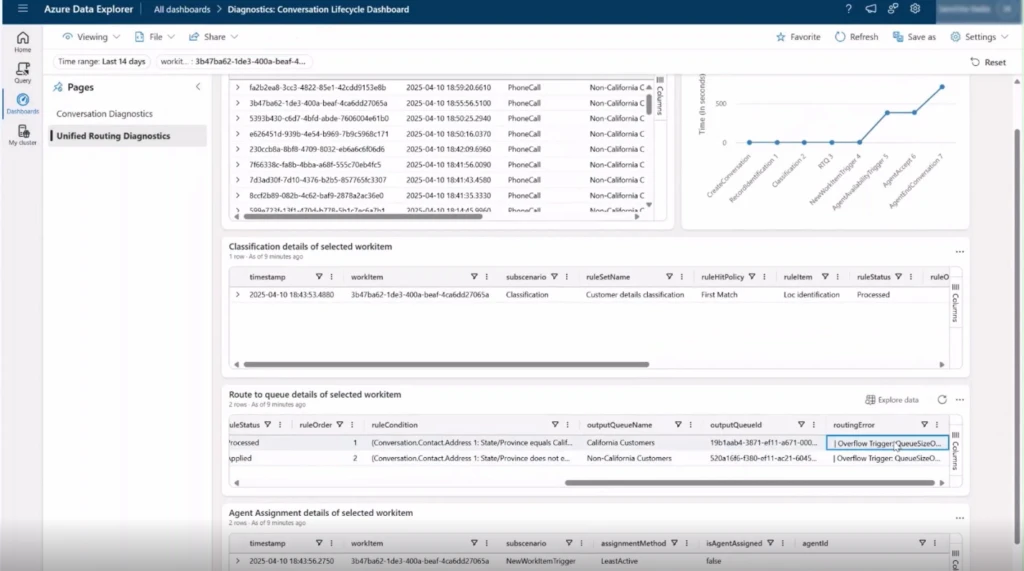
The IT admin quickly runs a query in AppInsights and identifies a queue with lower call volume. By routing calls to this queue as an overflow action, they can alleviate the strain on the queue experiencing higher assignment times. What once required extensive troubleshooting with Microsoft Support is now effortlessly resolved, with the answers at your fingertips.
Case 2: Optimizing for network issues
As a supervisor, a few of your Customer Service Representatives (CSRs) report dropped calls and network error messages during calls. To investigate, you gather the conversation IDs from your team and reach out to your IT admin for support. The IT admin retrieves the call ID for these conversations by using a query in Application Insights.
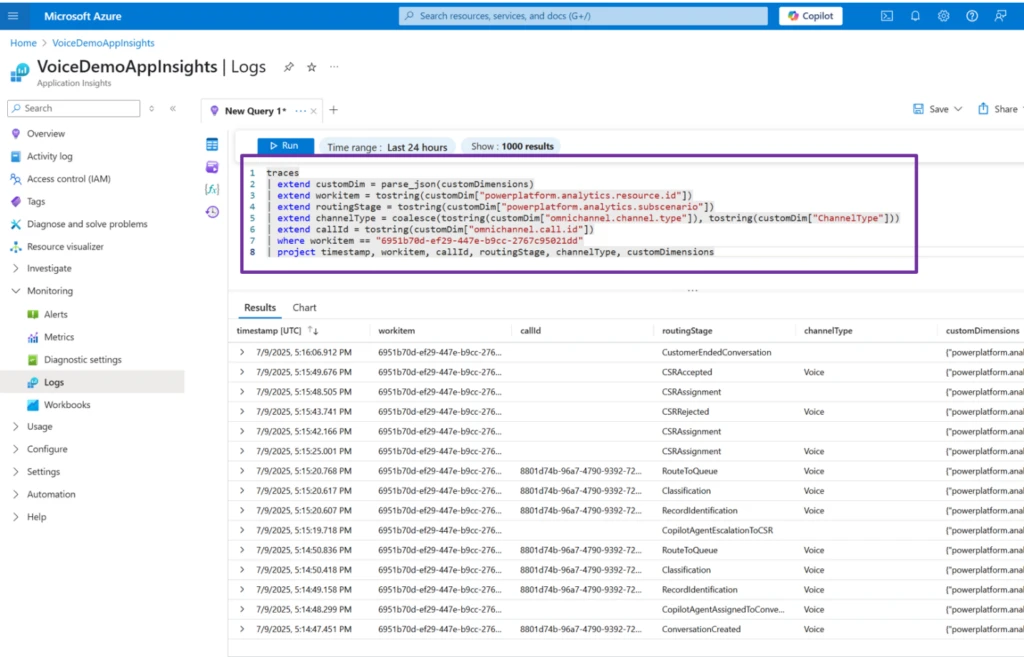
The IT Admin then filters for these call IDs in ACS Call Diagnostics and uncovers a recurring no network error confirming a contact center-wide outage rather than isolated network failures.
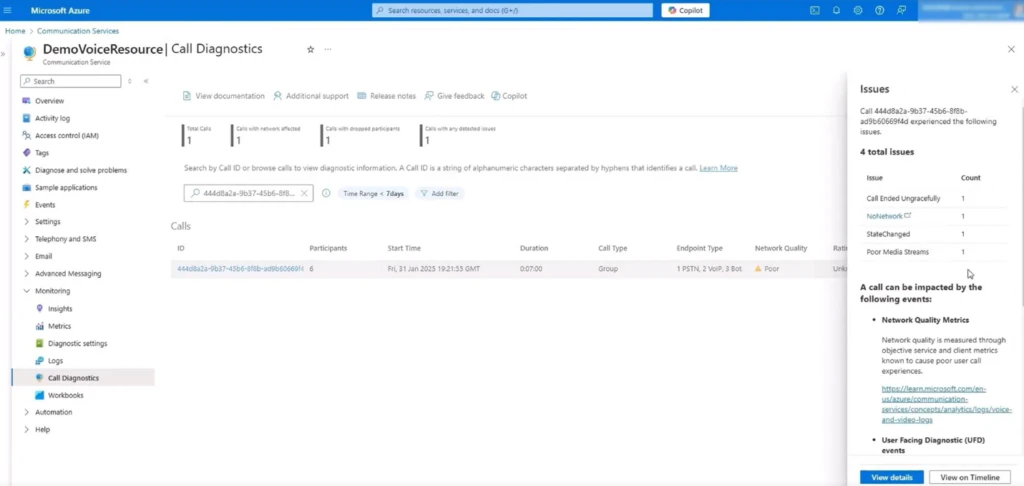
To prevent future disruptions, the supervisor ensures calls automatically switch to a backup connection when the primary network goes down, maintaining stability and avoiding dropped calls.
Case 3: Optimizing for call connectivity with SBC
As an IT admin, you are responsible for diagnosing calling issues that may involve a non-Microsoft telephony system connected to Azure Communication Services (ACS) via Direct Routing. These complex calling issues will span both Direct Routing SBCs and ACS. When you see a support ticket about a specific incoming call that traversed your Direct Routing SBC, you start with the call ID generated by the SBC. Your goal is to map this trunk call ID to its corresponding ACS correlation ID and uncover the root cause using end-to-end telemetry.
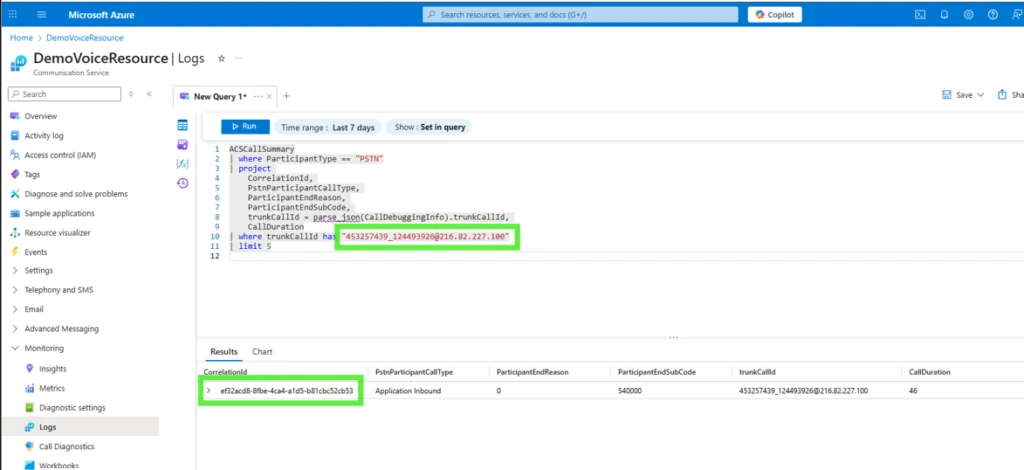
Inside your ACS resource, you navigate to Azure Monitor, then to Monitoring > Logs. There, you run a targeted query on the ACSCallSummary table. Replace trunkCallId with the specific call ID from the Direct Routing SBC for the call you want to troubleshoot.
ACSCallSummary

| where ParticipantType == "PSTN"

| project

    | CorrelationId, PstnParticipantCallType, ParticipantEndReason, ParticipantEndSubCode,

    | trunkCallId = parse_json (CallDebuggingInfo).trunkCallId, CallDuration

| where trunkCallId has ""
This query returns the ACS correlation ID linked to your SBC-generated call ID. With this correlation ID in hand, you proceed to ACS Call Diagnostics. Running the correlation ID through the diagnostic tools, you discover a recurring pattern: “No Network” errors appear consistently for calls routed through this path, confirming that the problem is not isolated to a single user or device.
Instead, your investigation reveals a contact center-wide network outage impacting all calls passing through the affected Direct Routing SBC. With actionable evidence, you escalate the incident for resolution, ensuring future calls are routed via healthy trunks, and document your findings for compliance and proactive monitoring.
By leveraging intuitive dashboards, real-time alerts, and deep integration with Azure services, organizations can quickly identify bottlenecks, optimize performance, and deliver consistently exceptional customer experiences. Embrace these powerful tools to transform your operations, delight your customers, and stay ahead of the competition.
Learn more
To learn more, see Understand conversation diagnostics (preview) | Microsoft Learn
The post Diagnostics and telemetry for Dynamics 365 Contact Center voice channel appeared first on Microsoft Dynamics 365 Blog.
Brought to you by Dr. Ware, Microsoft Office 365 Silver Partner, Charleston SC.

Recent Comments