by Scott Muniz | Sep 8, 2020 | Azure, Technology, Uncategorized
This article is contributed. See the original author and article here.
This installment is part of a broader series to keep you up to date with the latest features in Azure Sentinel. The installments will be bite-sized to enable you to easily digest the new content.
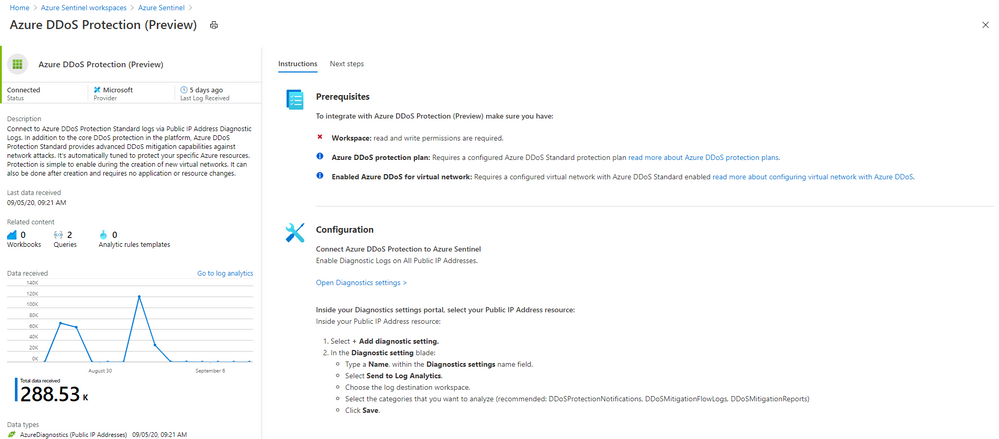
Even more Azure Sentinel connector news for you! If you are using Azure DDoS Standard Protection, you can now ingest this via our connector into your Azure Sentinel workspace.
In addition to the core DDoS protection in the Azure platform, Azure DDoS Protection Standard provides advanced DDoS mitigation capabilities against network attacks. It’s automatically tuned to protect your specific Azure resources. Protection is simple to enable during the creation of new virtual networks. It can also be done after creation and requires no application or resource changes.
Connecting Azure DDoS Protection Standard logs to Azure Sentinel enables you to view and analyze this data in your workbooks, query it to create custom alerts, and incorporate it to improve your investigation process, giving you more insight into your platform security.

How to enable Azure DDoS Protection log ingestion in Azure Sentinel
Prerequisite – You must have a configured Azure DDoS Standard protection plan.
1. From the Azure Sentinel navigation menu, select Data connectors.

2. Select Azure DDoS Protection from the data connectors gallery, and then select Open Connector Page on the preview pane.
3. Enable Diagnostic logs on all the firewalls whose logs you wish to connect:
a. Select the Open Diagnostics settings > link and choose a Public IP Address resource from the list.


b. Select + Add diagnostic setting.

c. In the Diagnostics settings screen
- Enter a name in the Diagnostic setting name field.
- Mark the Send to Log Analytics check box. Two new fields will be displayed below it. Choose the relevant Subscription and Log Analytics Workspace (where Azure Sentinel resides).
- Mark the check boxes of the rule types whose logs you want to ingest. We recommend DDoSProtectionNotifications, DDoSMitigationFlowLogs, and DDoSMitigationReports.

d. Click Save at the top of the screen. Repeat this process for any additional firewalls (public IP addresses) for which you have enabled DDoS protection.
4. To use the relevant schema in Log Analytics for Azure DDoS Protection alerts, search for AzureDiagnostics. Here’s an example query below:
AzureDiagnostics
| where ResourceType == "PUBLICIPADDRESSES"
| sort by TimeGenerated
And that’s it! You will now have Azure DDoS Standard logs connected to your Sentinel workspace.
Get Started Today!
Try out the new connector and let us know your feedback using any of the channels listed in the Resources.
You can also contribute new connectors, workbooks, analytics and more in Azure Sentinel. Get started now by joining the Azure Sentinel Threat Hunters GitHub community and follow the guidance.
by Scott Muniz | Sep 8, 2020 | Uncategorized
This article is contributed. See the original author and article here.
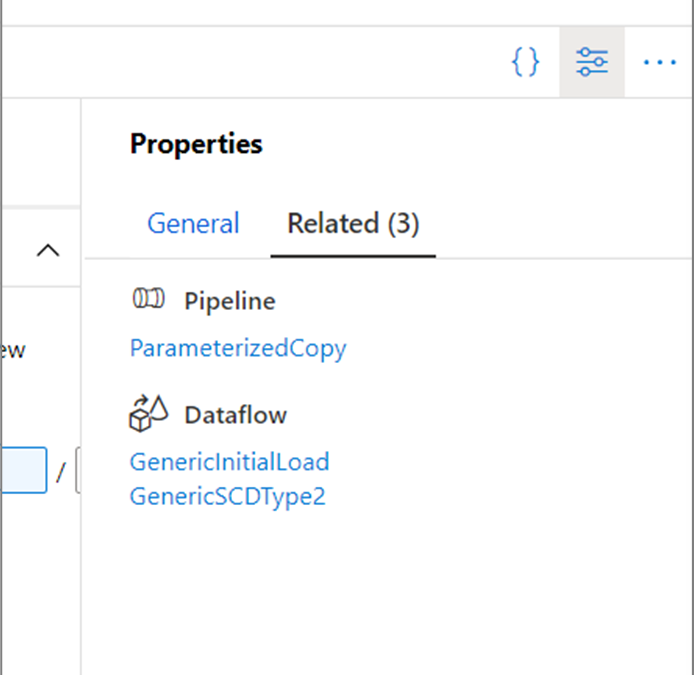
Starting this week in Azure Data Factory, every top-level resource (pipelines, datasets, and data flows) has a new Related tab in the properties pane. Here, you can see what resources depend on the current entity being edited.

For example, if you are authoring a dataset, you can see if any pipelines or data flows reference it in a source or activity. This lets you see the impact of your changes before saving or publishing them!
For more information, learn about authoring using the Azure Data Factory UX.
by Scott Muniz | Sep 8, 2020 | Uncategorized
This article is contributed. See the original author and article here.
Intune provides a host of application management features, such as app availability, App Policies, and app inventory, among others. The Intune discovered apps pane displays a list of detected apps on your managed devices. To learn more about discovered apps in Intune, see .
We were recently alerted to an issue whereby not all versions of applications are being reported, inconsistencies of information between Discovered apps report and Discovered apps per devices, and Discovered apps reported under devices blade differs from the actual device. Upon investigation, we discovered an issue with our data aggregation service not collecting all application information. In addition, since the data collection occurs every 7 days, feedback from admins was that they wanted to see applications from newly added devices or updated application versions.
Steps to reproduce:
- Sign in to the Microsoft Endpoint Manager admin center
- Select Apps > Monitor > Discovered apps
- View the # of devices with a specific app, then newly add that app to an Intune enrolled device
- Confirm that # Devices does not increase after Step 3
Note: The pane will update # Device after 7 days
Another way to verify:
- Select Apps > Monitor > Discovered apps report
- Compare the information displayed with the Device > iOS > Discovered apps
Please note that Android Enterprise Fully Managed and Dedicated devices do not report discovered apps so unfortunately, Intune cannot discover apps on these device types.
Upcoming improvements
Intune has been working on a solution to improve the accuracy and timeliness of discovered apps. We are currently architecting a new data pipeline that will create a more efficient data flow and expect to complete the work by early next calendar year. This work will directly result in the following:
- Increased efficiency of the data pipeline which will drive improvements in reporting/data warehouse
- Improved timeliness of discovered apps by reducing the data collection from every 7 days to every 24 hours
- Improvements to the aggregation workflow in reporting
- Addition of discovered apps from Android enterprise devices · Discovered apps data will be added to the Azure Log Analytics (Specialist) pipeline
Resources
Let us know if you have any additional questions on this by replying back to this post or tagging @IntuneSuppTeam out on Twitter.
by Scott Muniz | Sep 8, 2020 | Uncategorized
This article is contributed. See the original author and article here.
We have heard your feedback and are taking action to provide a more seamless experience for those managing monthly updates on-premises.
To keep devices up to date, IT administrators who manage devices using on-premises methods must select and deploy the correct servicing stack update (SSU) with the latest cumulative update (LCU). In some cases, a specific version of the SSU must already be installed in order to install the latest LCU. If the device in question does not have the required SSU already installed, the LCU will fail to install.
This scenario can be confusing for two reasons. First, it doesn’t occur every month. Second, the error message that the LCU failure can produce, “update isn’t applicable,” doesn’t make the root cause immediately apparent. As a result, having an LCU fail to install can be confusing and frustrating for the end user and IT admin alike, but can also hurt security compliance.
With the Windows Update experience where the SSU and LCU are deployed together to the device. The update stack automatically orchestrates the installation, so both are applied correctly.
Our goal is for all IT administrators, whether managing devices on-premises or from the cloud, to experience the simplicity of having a single cumulative monthly update to deploy that includes the month’s cumulative fixes and the appropriate servicing stack updates for that month, if applicable.
Our upcoming changes will ensure that the SSU and LCU are provided together under a single payload to both Windows Server Update Services (WSUS) and Microsoft Catalog.
If you use management tools backed by WSUS, such as the Configuration Manager, you will have to select and deploy the monthly cumulative update. The latest SSU will automatically be applied correctly. If you acquire and apply Dynamic Update packages to existing Windows 10 images prior to deployment, the latest SSU will no longer be available as a separate package in the Microsoft Catalog. If your process requires the SSU, you’ll simply use the new combined SSU and LCU package.
Things you will no longer need to worry about
- Searching for both the SSU and LCU KB articles. All release notes and file information for monthly cumulative updates, including those related to the servicing stack, will be in a single KB article!
- Determining if this month’s LCU has a dependency on a specific SSU version or newer and ensuring that the right SSU and LCU are deployed and installed in the correct order. The SSU and LCU will be packaged together, and the client will orchestrate the installation. Select the monthly cumulative update you want to deploy, and we will take care of the rest!
- End users confused at seeing multiple servicing releases in a month. The Window Update Settings and History pages will now look the same as it does for those who update from the cloud today!
How to take advantage of these innovations
To move forward with receiving a single monthly cumulative update package containing the SSU and LCU, you will first need to broadly deploy the September 2020 SSU or any later SSU on all Windows 10, version 2004 devices in your organization.
While these changes are not yet live for any in-market version of Windows, we hope you are excited about what is coming. This announcement gives you plenty of time to prepare for the upcoming changes and deploy the September 2020 SSU and LCU broadly across your organization.
Keep an eye out over the next few months as we release more information!
by Scott Muniz | Sep 8, 2020 | Uncategorized
This article is contributed. See the original author and article here.

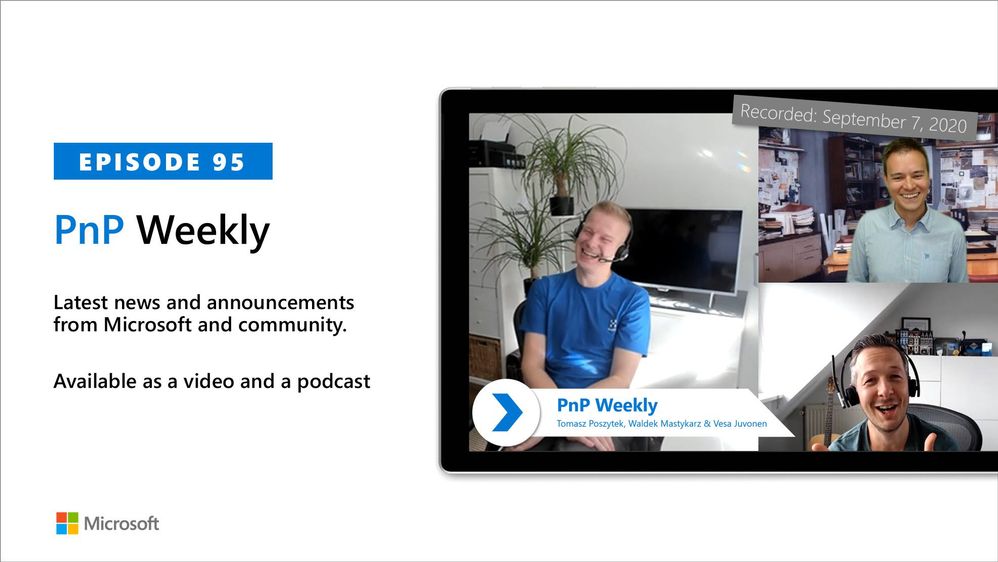
In this weekly discussion of latest news and topics around Microsoft 365, hosts – Vesa Juvonen (Microsoft), Waldek Mastykarz (Rencore), are joined by Tomasz Poszytek, an independent consultant and MVP from Poland.
They talk about Thomasz’s background and how we crew to be an independent consultant running his own business. Key tips from him for anyone who might be looking into doing the same. Discussions on the business automation and the different tools which we have had around these processes in past. Touching the challenge of the licensing models from Microsoft and how that has been simplified from the past… but could be further simplified in future.
Thomasz also talks about this experiences on being a project manager and how he decided to rather be a consultant. In this episode, 21 recently released articles from Microsoft and the PnP Community are highlighted.
This episode was recorded on Monday, September 7, 2020.
Did we miss your article? Please use #PnPWeekly hashtag in the Twitter for letting us know the content which you have created.
As always, if you need help on an issue, want to share a discovery, or just want to say: “Job well done”, please reach out to Vesa, to Waldek or to your PnP Community.
Sharing is caring!
by Scott Muniz | Sep 8, 2020 | Uncategorized
This article is contributed. See the original author and article here.
The Workplace Analytics team is excited to announce our feature updates for September 2020. (You can see past blog articles here). This update describes these new features:
- Inform your return to worksites plan
- Customize the definition of meeting attendance
- Teams metrics are now available
Inform your return to worksites plan
Workplace Analytics has released the Return to worksites Power BI template and supporting playbook. Inspired by recovery-planning efforts with Workplace Analytics customers, this offering provides an objective, data-driven approach to informing the limited capacity “soft opening” plan for worksite locations. It should prove especially valuable for a company’s “re-entry” coordinators – a high-visibility cross-functional team typically consisting of facilities, HR, security, legal, and strategy.
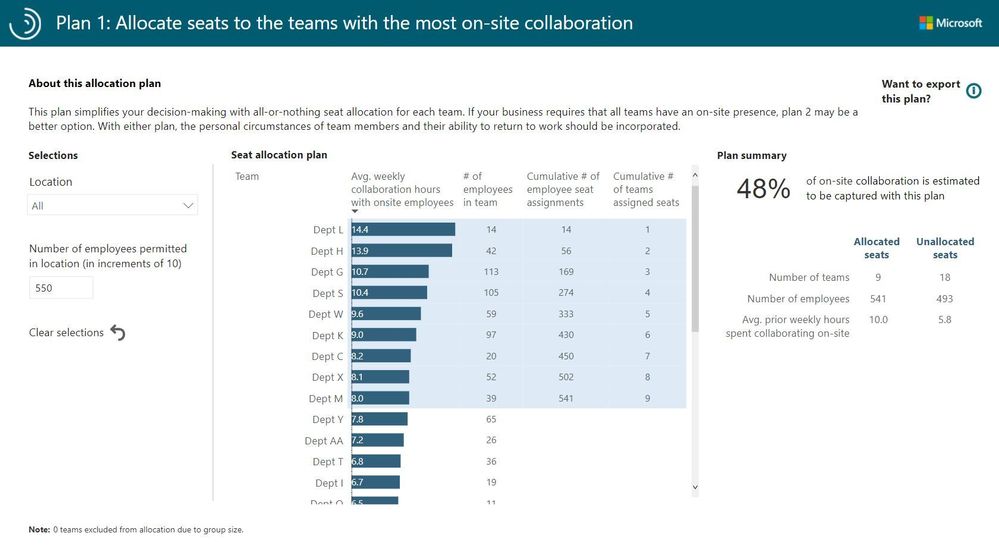
The Power BI template makes it possible to create two alternative worksite seat-allocation plans that prioritize teams that collaborate extensively with their co-located colleagues. Here is one example seat-allocation plan:

The Return to worksites playbook further guides the analyst in the who, where, when, and how of limited-capacity worksite openings for each individual worksite:

For instructions on how to get started, see Return to worksites.
Customize the definition of meeting attendance
The Workplace Analytics team has released the ability to customize the definition of meeting attendance. Until now, having accepted a meeting invitation was equivalent to attending. But what does it mean if the invitee doesn’t respond, or if they respond as “Tentative”? Now you can decide.
How does this help? In some countries, it is a cultural practice not to “decline” a meeting; rather, a “Tentative” response means “I won’t be attending but I still want to keep this meeting on my calendar.” You, the analyst, can now decide what it means for the collaboration-analysis data when an invitee tentatively accepts an invitation but does not in fact attend the meeting..
To do this, you can use an Attendee exclusion to exclude invitees who accepted the invitation as Tentative from that meeting’s attendee count. (You can do the same with meeting invitees who did not respond to the invitation.)
Analysts can choose the type of exclusion they want to create in the Analysis settings > Exclusions > New exclusions page:

After you create an attendee exclusion, the Create exclusion page shows you the number of attendees who’ll be excluded from calculations if this exclusion is applied.
The use of an attendee exclusion will affect many metrics, including After-hours collaboration, Generated workload meeting attendees, Manager coaching hours 1:1, Meetings with manager, Peer average, Total emails sent during meetings, Attendees, and Total meeting costs.
Teams metrics are now available
Note: In last month’s Workplace Analytics blog, we previewed this feature and offered means for early access to it. We’re happy to announce that this feature is now enabled for all customers.
With the recent shift to remote work, large numbers of users are relying on Teams for much of their remote collaboration. In other words, communication over Teams is at an all-time high. To maintain the ability to produce accurate analyses when using Workplace Analytics, we have added Teams chat and call data to Workplace Analytics metrics.
Data about calls and chats will now be reflected in several metrics, including Workweek span. This will improve the quality of data that’s available to analysts by more accurately delineating the actual workweek span of users. By using these new metric values, you’ll be able to better analyze connectedness across the company, analyze changes in the workweek span, gauge the effect of Teams in improving organizational connectivity, and support Business Continuity scenarios. Here is the complete list of metrics that are being updated:
|
Metric
|
Brief description
|
|
Internal network size
|
The number of people within the company with whom the person had at least two meaningful interactions in the last four weeks.
|
|
Networking outside organization
|
The number of distinct organizational units within the company that the person had at least two meaningful interactions with in the last four weeks.
|
|
Networking outside company
|
The number of distinct external domains outside the company a person has had at least two meaningful interactions in the last four weeks.
|
|
Workweek span
|
The time between the person’s first and last sent email, IM, Teams call, or meeting attended for each day of the workweek.
|
|
Network size
|
The number of people in the collaborator group who had at least two meaningful interactions in the last four weeks with the time investor.
|
Note: For complete definitions of these metrics, see Metric descriptions for Workplace Analytics.

Recent Comments