
by Scott Muniz | Sep 19, 2020 | Uncategorized
This article is contributed. See the original author and article here.
|
This year’s move to digital for Microsoft Ignite 2020 has created new opportunities for you to connect with Microsoft experts and technology professionals from around the globe. Ignite represents an opportunity for you to discover the latest developments in productivity, find innovative ways to build solutions, migrate and manage your infrastructure, all from the comforts of your own home.
This year you’ll find Surface throughout Ignite in announcements, keynotes, digital breakout sessions, and on demand sessions. In addition to Ignite Sessions, the Surface team will be launching a set of digital skilling sessions to provide a deeper level of technical content that you have come to expect from Ignite. You’ll be able to discover all of the great content landing at Ignite on the Surface page in the Virtual Hub launching at 8:00 AM on Tuesday, September 22.
|
Microsoft Ignite Registration
Don’t miss the digital-only Microsoft Ignite! There is no cost to attend and registration is now open for all attendees. Sign up today for full access to all the information and innovative content packed into our new two-day agenda.
Wherever you are, we’re coming to you! So get ready to connect with Microsoft experts, technology professionals and customers from around the world during this exciting digital event.
Event Details
- Where: Digital Event
- When: September 22nd – September 24th, 2020
- Why: Get a look on Microsoft latest technology
Microsoft Ignite 2020
Registration is now open and free to all attendees
|
Surface Sessions and Skilling Launched at Ignite
Ignite Sessions
Below are the list of sessions where specific news, announcements, and Surface owned content will land at Ignite as part of the Ignite catalog and scheduled programming. Sessions will be repeated across time zones, so be sure to check out the Ignite session catalog to find a time that works best with your schedule.
Following the event, these sessions recordings will also be copied to the Surface page in the Virtual Hub and posted to the Surface YouTube channel.
Surface Skilling Sessions
The list of sessions below are the deeper level of session content and skilling that will be launched and timed with Ignite. They are included in the Virtual Hub and showcased on the Surface YouTube channel. Content will go live on Tuesday, September 22 at 8:00 AM PST.
|
Surface Social Amplification
Watch for Microsoft Ignite posts on Surface LinkedIn and Surface Twitter leading up to and throughout the global, digital event. We’d love your promotion of our Surface presence by sharing posts that unveil Surface news and detail Surface sessions – both live and on-demand. Look for curated Surface content on LinkedIn Elevate to share with your network and be sure to use the combination of these hashtags: #SurfaceForBusiness and #MSIgnite.
Be sure to leverage links and point attendees to the Surface page in the Virtual Hub as a central location to explore all of the news the Surface team is launching at Ignite and beyond.
|
Surface Virtual Hub
Launching, Tuesday, September 22, 2020 | 8:00 AM PST
Location: Surface page in the Virtual Hub
We are excited to be launching the Virtual Hub at Ignite! This evergreen page will be a one-stop resource designed to enable the IT Community to explore content, resources, and engagement opportunities throughout the year across whatever channel or portal it may live.
The Virtual Hub launching at Ignite will provide a single source location and landing page for attendees to explore news, announcements, content, skilling, and more both aligned to Ignite and beyond. This central page will enable the Surface team to drive greater visibility and connections with our ITPro community.
Following the event, Ignite session content will be moved from the Ignite Catalog to the Surface page in the Virtual Hub and posted to the Surface YouTube channel. Additionally, resource links for each of the Surface sessions in the Ignite catalog will point attendees to the Virtual Hub, where IT Pros can go deeper on content and training throughout the year.
|
by Scott Muniz | Sep 19, 2020 | Uncategorized
This article is contributed. See the original author and article here.
When working on the internals of Citus, an open source extension that transforms Postgres into a distributed database, we often get to talk with customers that have interesting challenges you won’t find everywhere. Just a few months back, I encountered an analytics workload that was a really good fit for Citus.
But we had one problem: the percentile calculations on their data (over 300 TB of data) could not meet their SLA of 30 seconds.
To make things worse, the query performance was not even close to the target: the percentile calculations were taking about 6 minutes instead of the required 30 second SLA.
Figuring out how to meet the 30 second Postgres query SLA was a challenge because we didn’t have access to our customer’s data—and also because my customer didn’t have the cycles to compare the performance for different approaches I was considering. So we had to find ways to estimate which types of percentile calculations would meet their SLA, without having to spend the engineering cycles to implement different approaches.
This post explores how—with the help of the Postgres open source community—I was able to reduce the time to calculate percentiles by 45x by using the t-digest extension to Postgres.
Importance of calculating percentiles in analytics workloads
My customer operates a multi datacenter web application with a real-time analytics dashboard that displays statistics about a variety of signals—and they store the analytics data in Hyperscale (Citus) on our Azure Database for PostgreSQL managed service. They ingest over 2 TB of data per hour and needed to get < 30 second performance for their queries over a 7-day period This analytics dashboard is used by their engineers to debug and root cause customer-reported issues. So they query metrics like latency, status codes, and error codes based on dimensions such as region, browser, data center, and the like.
Latency is of course an important metric for understanding these types of issues. However, average latency can be very misleading—which is where percentiles come in. If 1% of your users are experiencing super slow response times, the average query response time may not change much, leading you to (incorrectly) think that nothing is wrong. However, you would see a notable difference in P99, allowing you to isolate issues much faster.
Which is why metrics like P99 are so important when monitoring analytics workloads. A P99 query response time of 500ms means that the response time for 99% of your queries are faster than 500ms.
Native percentile functions in Postgres didn’t do the trick for this use case
Postgres provides native support for selecting the value of a column at a certain percentile with the ordered-set aggregate functions:
percentile_contpercentile_disc
Having native support for percentile calculations in Postgres is super powerful: all you have to do is specify you want the percentile and then you can let Postgres figure out how to get it.
And yet… percentiles can’t be sped up by indexes in Postgres.
When diving into the implementation of percentile_cont in Postgres, you will find the transition functions for these aggregates collect, store, and sort the data internally. Meaning Postgres cannot rely on a known sort order of an index to significantly speed up the calculation.
Add on top that, when Postgres is sharded across multiple nodes by Citus and we want the percentile over a sharded dataset, we cannot combine the percentiles we get back from the distributed shards and expect a correct result. Instead Citus requires all rows to be sent to one location, sorted locally, and find the value at the requested percentile. The copying of data takes the most time in a distributed Citus cluster and this was in fact the problem for our customer: out of the 6 minutes for the query, 4 ½ minutes were spent in just pulling data to the coordinator.
To speed up the percentile calculations with Citus, we needed to reduce the amount of data required at the Citus coordinator to get to a reasonable percentile.
Lucky for us this was not the first time we had needed to find an effective way to run complex SQL calculations—at scale. In the past we have written about similar challenges with COUNT(DISTINCT) queries—which we solved with the HyperLogLog approximation algorithm, also known as HLL.
Hence this epiphany: Using a trusted, mathematically-robust approximation algorithm (sometimes called a sketch algorithm) might help us speed up performance.
Which Percentile approximation technique to use with Postgres?
A quick exploration in the space of percentile approximation pinpointed 3 different Postgres extensions we could consider. Two of these Postgres extensions had been created by Citus engineering interns in years past—and while not yet finished and not yet open source, these two prototype extensions deserved consideration:
- High Dynamic Range Histograms, HDR for short
- t-digest (the one created by our Citus intern)
And one open source t-digest extension contributed by Postgres committer Tomas Vondra:
With 3 competing extensions to Postgres that were all suitable for the approximation the question changes from how to, into the question of which one to use? To decide between the 3 different extensions for approximating percentiles, we needed to answer these 2 questions for each option:
- How fast would the execution of our customer be?
- How production-ready is the extension?
And we wanted to be able to answer these questions without having to integrate each of the approximation algorithms with Citus—and without having to ask our customer to measure how fast each performed.
The challenge: Figuring out if approximation algorithms would meet the SLA, without having to implement & measure all the approaches
Getting to our customer SLA of 30 seconds from over 6 minutes was a hard task. And before doing too much engineering work, we needed to assess if calculating the percentiles using one of these Postgres extensions like t-digest or HDR was going to hit the 30 second SLA.
Given that COUNT DISTINCT had already been solved with HyperLogLog, we realized we could use a query that triggers the HLL code path to establish a ballpark figure on time required for the calculation, omitting some computational details.
To get this information, we asked our customer for the Postgres EXPLAIN plans of the original percentile queries and counting the distinct number of latencies (with HLL). Both were grouped by the desired time interval—minutes of a day—which resulted in 1440 groups.
|
Type of calculation with customer data (based on our customer’s Postgres EXPLAIN plans)
|
Execution Time
|
|
percentile_cont
|
361 seconds (~6 minutes)
|
|
COUNT DISTINCT – via HyperLogLog approximation
|
4 seconds
|
Even though the COUNT DISTINCT via HLL above gives an answer that tells us nothing, the execution characteristics for approximating the counts is very similar on how we would approximate the percentiles.
The shared execution characteristics between COUNT DISTINCT via HLL and approximating percentiles are:
- to iterate over all values,
- change a summary we keep,
- send the summaries to the Citus coordinator, and finally
- combine the summaries to come to an answer.
From the COUNT DISTINCT via HLL row in the table above, you can see that using an approximation algorithm (and maintaining the summary) seemed to get us in the ballpark of the desired execution times.
But it was unclear how the time it would take to do percentile approximations compares to the time it takes to approximate COUNT DISTINCT.
We needed to figure out, would it be 2X or 20X more expensive to approximate percentiles vs. to approximate COUNT DISTINCTs?
The good news: to get a multiplier for the compute required, we did not have to rely on the environment of our customer.
Instead we set a baseline by running roughly the same approximation. In this case, the number of rows and the number of expected groups, could give a good indication. By running both a count distinct approximation and a percentile approximation, we were able to measure how much more work one requires over the other on the same data. This multiplier also shed light on whether we would be able to meet the target execution time of 30 seconds.
We used these queries to estimate the performance:
WITH data AS (
	SELECT
		(random()*60*24)::integer AS minute,
		(random()*60000)::integer AS latency
	FROM generate_series(1,1000000)
)
SELECT
	minute,
	aggregate_to_create_summary(latency) AS summary
FROM data
GROUP BY minute;
Executing these experiments gave us a workload multiplier which we applied to the runtime as measured at the target infrastructure. We ran these experiments for the 3 extensions we had identified earlier (t-digest, t-digest, and HDR) and the HyperLogLog (HLL) extension used for count approximations. The multipliers in the table below are against the baseline of the HLL extension.
|
Approximation algorithm
|
Runtime
|
Multiplier vs. HLL
(lower means faster)
|
|
HDR – prototype
|
2023 ms
|
~2x
|
|
t-digest – prototype
|
4089 ms
|
~4x
|
|
t-digest – open source
|
1590 ms
|
~1.5x
|
|
HyperLogLog (baseline)
|
1026 ms
|
1
|
Data sizes matter
Besides compute time, the size of the data being transferred from the shards to the coordinator has a big influence on the total execution time. That is why we started this investigation in the first place: because transferring all rows to the coordinator had been taking the majority of the 6 minutes. Due to simplicity and portability, Citus uses the text-based protocol for transferring rows from the workers to the coordinator. To get an idea of data sizes involved, we can cast the summaries created above to text and sum their lengths to get an idea of the size of data transferred. This is again not an exact size but more an order of magnitude check.
To get an estimated guess on how long the final execution would take using t-digest, we compared the transfer sizes and then we used a multiplier on the transfer times (measured in the target environment.)
WITH data AS (
	SELECT
		(random()*60*24)::integer AS minute,
		(random()*60000)::integer AS latency
	FROM generate_series(1,1000000)
),
summary_sizes AS (
	SELECT
		minute,
		octet_length(aggregate_to_create_summary(latency)::text) AS percentile_size
	FROM data
	GROUP BY minute
)
SELECT sum(percentile_size)*200 FROM summary_sizes;
|
Postgres Extension
|
Amount of data transferred to Citus coordinator
|
Multiplier
(lower is better)
|
|
HDR prototype
|
3.8 GB
|
~6x
|
|
t-digest prototype
|
1.7 GB
|
~2.7x
|
|
t-digest (open source)
|
218 MB
|
~0.34x
|
|
HyperLogLog (baseline)
|
646 MB
|
1
|
Based on both the measurements of compute time as well as the expected data transfer sizes it became clear the open source t-digest extension created by Postgres committer Tomas Vondra would yield the best performance for Citus and specifically for the analytics use case we were targeting.
If you can’t beat them, join them
At this point, we had a good understanding of the speeds that could be achieved for percentile approximation with the different Postgres extensions we were considering. And the good news was, the projected speeds were well within our customer’s SLA.
The hard question we had to answer: should we spend time to productize our own t-digest or HDR prototype extensions—or should we adopt (and try to improve) the existing open source t-digest extension?
A quick chat with the author of the open source github.com/tvondra/tdigest extension, Tomas Vondra, revealed that he uses the extension to great satisfaction. Also, Tomas was open to contributions to the extension to make it work well for Citus. The documented use of the open source t-digest extension by at least 1 user was already infinitely more than our internal prototypes. And fixing a bug we had encountered was also straightforward. One pull request later and we had an open source t-digest extension that would work with Citus.
The next step was to integrate t-digest with Citus. Given our experience with HLL in the past, the integration of t-digest with the Citus distributed Postgres planner was straightforward. It was time to go back to our customer to validate that we could meet their SLA. And we did meet our customer’s SLA: with t-digest and Hyperscale (Citus) , our customer’s Postgres queries to approximate percentiles now ran in 7.5 seconds, which was 45 times faster compared to their initial 6 minute Postgres query.
More open source adoption of t-digest (with Citus)
One positive side-effect of embracing the existing open source t-digest and contributing back to the t-digest project: we found more users that were interested in using t-digest with Citus!
Min Wei from the Windows Data & Intelligence team—who uses Citus with Postgres on Azure to support over 6M queries per day—also needs to do percentile approximation at scale. And while working on this project we discovered that Min is looking to use the exact exact same t-digest extension to Postgres, too.
Matt Watson from Stackify recently published a blog about calculating percentiles with t-digest in Citus. Matt even helped improve the extension by documenting an edge case where the calculations were off, making t-digest work better for Stackify and pretty much all users—including the original author and all of our Citus users. Were we to have selected a closed source extension, our efforts would not have helped other customers like Stackify and Min Wei of Microsoft, and we would have run into similar bugs that we would have had to fix ourselves. By adopting an open source solution and improving it collectively, we make it work better for all.
by Scott Muniz | Sep 19, 2020 | Uncategorized
This article is contributed. See the original author and article here.
In this article we are going to clarify a topic which has been causing a lot of confusion and questions among our customers: “How do we securely share emails and documents with someone outside of our organization using sensitivity labels?”
Disclaimer: Considering diversity of operating systems and productivity applications used these days and vast amount
of possible combinations of identities and software used, we will not be able to cover all possible scenarios in this
article but will focus on the most common ones instead.
We assume that the reader has some basic knowledge about sensitivity labels, their purpose, how to create, apply, and manage them. If you are new to this field, a good place to start is here. We also highly recommend to spend fair amount of time reviewing documentation on Azure Right Management Service (RMS), which is a critical component of all our Information Protection solutions, responsible for encryption and access control management.
Before we jump into it, let’s set the stage by clarifying a few things first. Everything we are going to cover in this article is applicable to both the client-based solution a.k.a. Azure Information Protection (AIP) as well as the modern built-in labeling capability in Office 365 applications which is part of a broader Microsoft Information Protection (MIP) framework. Both solutions use the same unified sensitivity labels.
Note: If you for some reason have not migrated your existing sensitivity labels to the Unified Labeling yet, it is
about time to do that as the AIP classic client and label management in the Azure portal will be deprecated on
March 31, 2020. Please find more info on deprecation notice here.
We are also going to be focusing on Microsoft Office and Adobe PDF as the most used file types and that have full classification and protection support.
Alright, let’s say you need to implement a solution that will allow your users to securely share emails and documents with people outside of your organization (consumers, partners, auditors, etc.). In other words, share it with someone whose identity and device is out of your control.
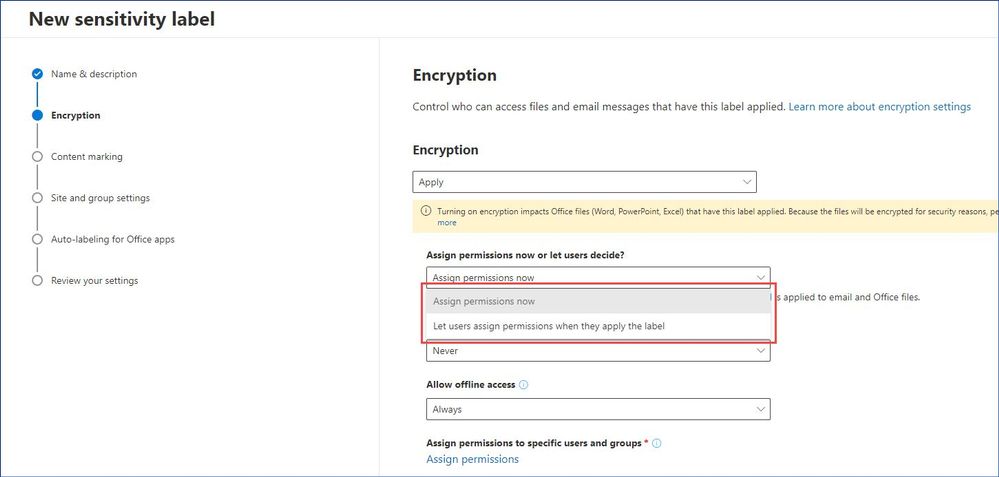
When you create a sensitivity label, you can either determine which users get which permissions to content that has the label applied, or you can allow your users make this decision when they apply the label (also commonly known as user-defined permissions or UDPs).
 Figure 1: Creating a new sensitivity label in the Microsoft 365 Compliance center.
When it comes to the predefined permissions (Assign permissions now), we have four options as shown below.
 Figure 2: Assign permissions dialog.
“Add all users and groups in you organization” is pretty much self-explanatory, all existing and future users and groups from your Azure Active Directory (AAD) tenant will be able to access and consume the protected content (emails and documents). This is a great option for secure internal collaboration, therefore, we are not going to spend a lot of time here.
“Add any authenticated users”, with this option we can encrypt content and limit what users can do with protected emails or documents, but can’t limit those who should be able to access this protected content – any authenticated user will be able to do so.
An example scenario might be when you need to share certain information (e.g. financial reports) with your customers or partners. Even if it’s overshared, it won’t cause any issues to your business, but you want prevent this information from being copied and re-used outside of your documents. In addition to that, it is possible to make the protected content time-bound as well as control whether users can access it offline and for how long. In this case your label may look like this:
 Figure 3: A sensitivity label granting Authenticated users view-only access.
“Add users and groups”, this option allows you to provide a list of AAD users and groups and specify what permissions that user or group will have for the protected content.
Note: There are several identity and software requirements and limitations that we are going to cover in detail
later in this article.
For example, you can create a label for a team working on a specific project and allow them to use that label to securely collaborate with an approved list of external partners.
 Figure 4: Assigning permissions to AAD groups.
You can invite anyone to collaborate with your organization by adding them to your directory as a guest user. Guest users can sign in with their own work, school, or social identities.
Note: Please take a moment to review current Azure Active Directory limitation and restrictions.
 Figure 5: Group membership containing guests accounts from different providers.
 Figure 6: Adding a new guest user.
This is a very granular and flexible way of managing who will be able to access your protected content but it does add additional work to your AAD administrators.
“Add specific email addresses or domains”, with this option you can specify a list of specific emails or the whole domains.
For instance, if you are a group of companies, each one with its own AAD tenant, you can list all domain names so that every user of those orgs will be able to access content protected by this label.
 Figure 7: Permissions assigned to multiple domains.
If you have very complex requirements for your label you can mix and match any of those four options.
Last option that we have is “Let users assign permissions when they apply the label” a.k.a. the user-defined permissions, that lets users specify who should be granted permissions and what those permissions are.
 Figure 8: Creating a label with the user-defined permissions.
This is a good option when you do not know upfront who your users will be sharing the protected content with and you feel comfortable with transferring responsibility of making an appropriate security decision to the end users.
Note: As of this writing (9/15/2020) not all platforms support the user-defined permissions yet. Please keep an eye
on our documentation to track our progress.
Now, let’s switch sides and talk about what kind of identity and software your partners/recipients would need to have in order to successfully consume the protected content (emails and documents) you would like to share with them.
When it comes to identity, we can determine five main categories: Work or school accounts (AAD), Microsoft Accounts, Federated social providers, Public email providers, and everything else.
Protected emails.
|
Identity type
|
OS
|
Email clients to open protected emails
|
|
Work or school account (Azure Active Directory)
|
Windows
|
|
|
MacOS
|
|
|
Android
|
- Outlook for Android
- Samsung Email App for Android
- Outlook on Web (OWA)
- In other cases, recipients would likely need to use Office 365 Message Encryption (OME) web portal using either their work credentials or a One-time passcode (OTP)
|
|
iOS
|
- Outlook for iOS
- Outlook on Web (OWA)
- In other cases, recipients would likely need to use Office 365 Message Encryption (OME) web portal using either their work credentials or a One-time passcode (OTP)
|
|
Microsoft Account (live.com, outlook.com, hotmail.com)
|
Windows
|
- Office 2013 SP1 and newer
- Microsoft 365 App for enterprise (ex- Office 365 ProPlus)
- Windows 10 Mail and Calendar App
- Outlook.live.com
- In other cases, recipients would get an OME-protected message redirecting them to outlook.live.com
|
|
MacOS
|
- Microsoft 365 Apps for Mac (ex- Office 365 for Mac)
- Outlook.live.com
- In other cases, recipients would get an OME-protected message redirecting them to outlook.live.com
|
|
Android
|
- Outlook for Android
- Outlook.live.com
- In other cases, recipients would get an OME-protected message redirecting them to outlook.live.com
|
|
iOS
|
- Outlook for iOS
- Outlook.live.com
- In other cases, recipients would get an OME-protected message redirecting them to outlook.live.com
|
|
Federated social providers (gmail.com, yahoo.com)
|
Windows
|
- Recipients would need to use Office 365 Message Encryption (OME) web portal using their federated social provider credentials or a One-time passcode (OTP)
|
|
MacOS
|
|
Android
|
|
iOS
|
|
Other public email providers (e.g. mail.com)
|
Windows
|
|
|
MacOS
|
|
Android
|
|
iOS
|
|
Other identity and email providers (e.g. corporate on-premises infrastructure)
|
Windows
|
|
|
MacOS
|
|
Android
|
|
iOS
|
Here are a few examples of what user experience depending on a platform and type of identity used would be.
 Figure 9: Seamless access to a protected email in Mail and Calendar App on Windows 10.
 Figure 10: Seamless access to a protected email in Outlook for Mac.
 Figure 11: Accessing a protected email using Outlook, Samsung Email App and Gmail App on Android.
 Figure 12: Protected email sent to a mail.com user.
 Figure 13: OME authentication page for different types of identity.
 Figure 14: One-time passcode sent to a mail.com user.
 Figure 15: Accessing a protected email using the OME portal.
 Figure 16: Unintended recipient trying to access a protected email.
Protected documents.
|
Identity type
|
OS
|
Applications to open protected documents
|
|
Work or school account (Azure Active Directory)
|
Windows
|
For Office documents:
For PDF documents:
- Adobe Acrobat DC or Acrobat Reader DC with MIP plug-in
- AIP Viewer (part of the AIP client)
|
|
MacOS
|
For Office documents:
For PDF documents:
|
|
Android
|
For Office documents:
For PDF documents:
- AIP Viewer App for Android
|
|
iOS
|
For Office documents:
For PDF documents:
|
|
Microsoft Account (live.com, outlook.com, hotmail.com)
|
Windows
|
For Office documents:
For PDF documents:
|
|
MacOS
|
Not supported. Please keep an eye on our documentation for updates.
|
|
Android
|
For Office documents:
For PDF documents:
- AIP Viewer App for Android
|
|
iOS
|
Not supported. Please keep an eye on our documentation for updates.
|
|
Federated social providers (gmail.com, yahoo.com)
Recipients would have to create a Microsoft Account using their Gmail/Yahoo email address.
|
Windows
|
For Office documents:
For PDF documents:
|
|
MacOS
|
Not supported. Please keep an eye on our documentation for updates.
|
|
Android
|
For Office documents:
|
|
iOS
|
Not supported. Please keep an eye on our documentation for updates.
|
|
Other public identity providers (e.g. mail.com)
Recipients would have to create a Microsoft Account using their public email address.
|
Windows
|
For Office documents:
For PDF documents:
|
|
MacOS
|
Not supported. Please keep an eye on our documentation for updates.
|
|
Android
|
For Office documents:
|
|
iOS
|
Not supported. Please keep an eye on our documentation for updates.
|
|
Other identity and email providers (e.g. corporate on-premises infrastructure)
|
Windows
|
Recipients would need to sign up for RMS for Individuals using their company email address
|
|
MacOS
|
|
Android
|
|
iOS
|
Here are a few examples of what user experience of accessing a protected document depending on a platform and type of identity used would be.
 Figure 17: Accessing a protected document shared by a user from a different AAD tenant using Office 365 for Mac.
 Figure 18: Accessing a protected document using a Microsoft Account associated with a mail.com email address in Office 365 on Windows.
 Figure 19: Accessing a protected document using a Microsoft Account associated with a mail.com email address in Office 365 on Windows.
 Figure 20: Accessing a protected PDF file using AIP Viewer App on Android.
Now you are probably wondering what’s about SharePoint Online, OneDrive and Teams? There is a lot of work is being done to enable different B2B and B2C scenarios for secure information sharing there and it is a subject for its own blog post. So, stay tuned…
References:
Configuring usage rights for Azure Information Protection
Applications that support Azure Rights Management data protection
Message Encryption
Revoke email encrypted by Advanced Message Encryption
Automatically encrypt PDF documents with Exchange Online
Configuring secure document collaboration by using Azure Information Protection
Sharing encrypted documents with external users
RMS for individuals and Azure Information Protection
Which PDF readers are supported for protected PDFs?
Update history for Microsoft 365 Apps
Known issues with sensitivity labels in Office
by Scott Muniz | Sep 18, 2020 | Azure, Technology, Uncategorized
This article is contributed. See the original author and article here.
Final Update: Saturday, 19 September 2020 01:13 UTC
We’ve confirmed that all systems are back to normal with no customer impact for our USGov Virginia, USGov Texas, USGov Arizona, DoDCentral, and DoDEast regions of the US Gov cloud as of 9/18, 20:00 EDT. Our logs show the incident started on 5/18, 13:00 EDT and that during the 7 hours that it took to resolve the issue customers using Diagnostic Settings to export logs and metrics to Log Analytics would have experienced data loss/gaps in their Log Analytics workspaces during this time. Due to this customers may have also experienced false and missed alerts.
- Root Cause: The failure was due to an authentication issue that took down our data export to Log Analytics.
- Incident Timeline: 7 Hours – 5/18, 13:00 EDT through 9/18, 20:00 EDT
We understand that customers rely on Azure Log Analytics as a critical service and apologize for any impact this incident caused.
-Ian
by Scott Muniz | Sep 18, 2020 | Azure, Technology, Uncategorized
This article is contributed. See the original author and article here.
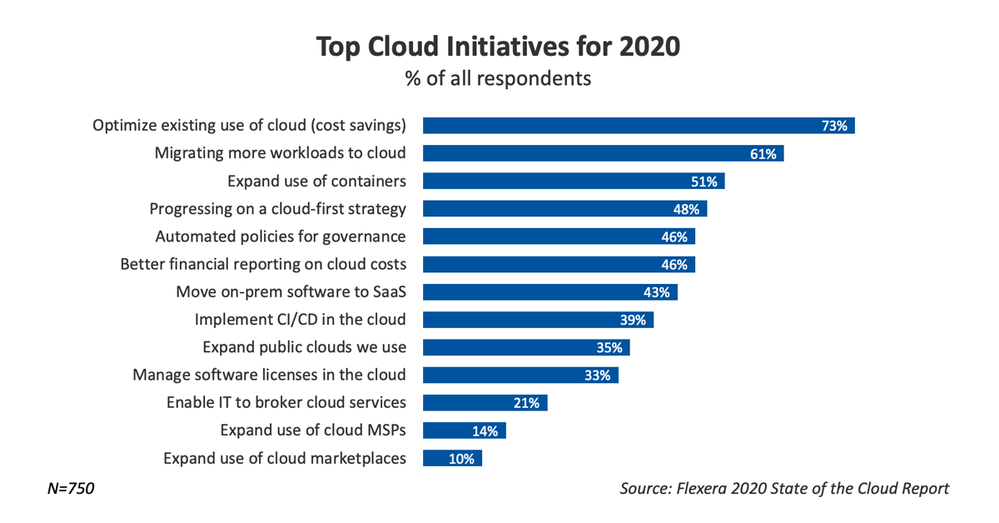
The Microsoft Azure Well-Architected Framework has 5 aligned and connected pillars, one of which is Cost Optimization. Azure providing services as a utility, being consumed on demand it drives a fundamental change that impacts planning, bookkeeping, and organization. The ability to have virtually unlimited compute resources at one’s disposable means your organization must always be wary of excess costs that are not providing business value. The tools listed here will help your organization get an idea of where it is spending the most and where some cost optimization might be had. Cost Optimization is one of the top priorities for organization across industries as shown by the Flexera 2020 State of the Cloud Report:

Discover your Azure Costs
Microsoft over time has provided multiple tools to evaluate and optimize costs which are always being improved on. To truly optimize your costs though you have to understand your current spend and workloads by gathering data, lets review some of the tools.
Tools to Use
- Azure Advisor – personalized cloud consultant that recommends best practices to optimize your Azure deployments. It will recommend optimizations such as resizing or shutting down under utilized virtual machines, optimize spend for MariaDB, MySQL and PostgreSQL by right-sizing, and buying reserved instances for several resource types to save money over pay-as-you-go costs.

- Azure Cost Management & Billing Power BI Template – assists in analyzing and managing your cloud cost using Power BI to monitor costs, usage trends, and identify cost options to reduce expenditures NOTE: Only supports customers with Enterprise Agreement

- Microsoft Azure Well-Architected Review – While this assessment doesn’t directly assess your Azure consumption it will review where you are at in controlling costs via governance and policies along with making recommendations to improve.

- Azure Cost Management – Review all costs related to your Azure consumption, download billing statements, set budgets are all done in the Cost Management pane of the Azure portal.

Using the Well Architected assessment and tools listed here you can start getting an idea of the major consumers of your organizations Azure spend and start to formulate a plan to optimize moving forward. The most important part of that is making sure your governance and policies get setup as those are the main guardrails that will make sure your Azure environment doesn’t get bloated with additional costs.
Want to learn more?
There is a free learning path course at Microsoft Learn that will teach you to monitor and control your spending while also walking you through more on the Well-Architected Framework – Cost Optimization:
Control Azure Spending
by Scott Muniz | Sep 18, 2020 | Uncategorized
This article is contributed. See the original author and article here.
The Intune Company Portal app allows you to access corporate data, apps, and resources. It’s important to keep your app up to date with the latest version of Company Portal. We recently had a change in enrollment certificates which required a Company Portal update for some users, and after talking with a few customers who weren’t aware of why and how to keep the company portal updated, we thought it would be good to provide this support tip.
Here are a few reasons to keep your Company Portal updated:
- Prevent security risks that can occur on older OS versions
- Certificate expirations which could prevent access
- New features, bug fixes, or changes to the UI
How to keep your device updated
When using Android devices, it is up to you as a user to keep the app updated. There are two options to keeping your Company Portal updated:
- Recommended: Turn on Auto-Updates within the Google Play store, this will ensure that you always have the latest version on your device.
- Ensure your notifications are turned on for Google Play Store to let you know when your app needs to be updated. (Don’t delay after seeing the notification or you might forget!)
Note: You won’t see a prompt within the Company Portal app that an update is needed.
How to update automatically
If you choose to turn on auto-updates follow these steps:
- Open Google Play store and select the Menu icon
- Select Settings
- Select Auto-update apps and choose one of the following:
- Over any network. Data charges may apply
- Over Wi-Fi only
 Fig 1. Google Play Store
  Fig 2. Google Play Store Settings
 Fig 3. Auto-update apps
  Fig 4. Auto-update apps options
If you choose to auto-update over Wi-Fi to save on possible data charges, see below on how to connect to Wi-Fi automatically.
How to update manually
If you decide to update manually by receiving Google Play notifications do the following:
- Open Google Play store and select the Menu icon
- Select My apps & games
- Select the Intune Company Portal app to update (or select Update All)
- If prompted, review App Permissions, then select Accept to proceed with the app update
 Google Play Store – Manually update apps
Set up your Wi-Fi to connect automatically
If your settings for updates are limited to Wi-Fi connections to prevent possible data usage, it’s helpful to set up your device to connect to Wi-Fi networks automatically:
- Open your device’s Settings menu
-
Select Network & Internet
-
Select Wi-Fi
-
Select Wi-Fi preferences
-
Turn on Connect to open networks
 Android Settings
  Android – Network & internet settings
 Android – Wi-Fi settings
  Android – Wi-Fi preferences
Administrative options for updating apps
Device restrictions
As an IT admin, you can also ensure your user has the latest Company Portal version by setting up device restrictions for users enrolled with fully managed, dedicated, and corporate-owned devices by following these steps:
- Navigate to Devices > Android > Configuration policy
- Click Create Profile
-
Platform: Android Enterprise
-
Profile: Select Device restrictions under Fully Managed, Dedicated, and Corporate-Owned Work Profile
<<Screenshot>>
- Open Applications within the accordion
- Set App auto-updates: Devices check for app updates daily. Choose when automatic updates are installed:
-
Not configured: Intune doesn’t change or update this setting.
-
User choice: The OS might default to this option. Users can set their preferences in the managed Google Play app.
-
Never: Updates are never installed. This option isn’t recommended.
-
Wi-Fi only: Updates are installed only when the device is connected to a Wi-Fi network.
-
Always: Updates are installed when they’re available.
 Android Enterprise – Device restriction profile
For more information on Device restrictions for Android Enterprise see this documentation. App auto-updates aren’t available for devices enrolled with Android device administrator or Android work profile.
Configure Conditional Launch
Another option as an IT admin is to configure a minimum Company Portal version within conditional launch settings to prevent users from accessing company resources if they need to update Company Portal. This can be configured by doing the following:
- Navigate to Apps > App protection policy
- Click Create policy and choose Android
- Under Conditional Launch > Device conditions, select Min Company Portal version
 Android Enterprise – Device restriction profile settings
- Once selected, insert a minimum Company Portal version to Value
- Choose an action:
-
Block access: Prevent users from accessing company resources until Company Portal is updated.
-
Wipe data: The user account that is associated with the application is wiped from the device.
-
Warn: This will let users know that they need to update the Company Portal.

Note: If you choose Block access, forcing an update could lead to unexpected data charges at the time of the update. Learn more about Android app protection policy settings in Microsoft Intune.
We hope this support tip is useful for your users. For more on updating the Company Portal on Android devices, see this documentation:
Let us know if you have any additional questions on this by replying back to this post or tagging @IntuneSuppTeam out on Twitter!

Recent Comments