by Contributed | Oct 1, 2020 | Azure, Technology, Uncategorized
This article is contributed. See the original author and article here.
This year at NVIDIA GTC, we’re excited to expand on our announcement of new GPU VM sizes available to Azure customers that continue our promise of providing VMs for every workload, at any scale- from a few inferences, to training multi-billion parameter natural language models.
The first is a flagship scale-up and scale-out offering, built on the NVIDIA A100 Tensor Core GPU– the ND A100 v4 platform- for users requiring the next frontier of AI training capabilities, which we unveiled in August. Equally important, however, in rounding out the Azure AI GPU portfolio, is a new and efficient NVIDIA T4 Tensor Core GPU-equipped VM series. The NC T4 v3 VMs are a cost-effective yet powerful option for customers looking to deploy machine learning in real-time production contexts.
Azure is committed to offering our customers the performance, pricing, unique features and worldwide availability they need to be successful in the rapidly changing landscape of accelerated cloud infrastructure. Four other generations of NVIDIA GPUs are also available to our customers worldwide, with a dozen Virtual Machine size options, including the industry’s only public cloud VMs with NVIDIA Mellanox InfiniBand scale-out networking.
Flagship NVIDIA A100– powered Azure VMs for Demanding AI Training and Compute
During the AI and GPU Infrastructure at Every Scale in Azure session [A22245TW] at GTC, we’ll be disclosing more details around the NVIDIA A100-powered ND A100 v4 product for high-end GPU computing in the cloud. This brand new offering, built around eight NVIDIA A100 Tensor Core GPUs, is poised to fulfill the most demanding AI training requirements for customers with large models, and enable a new class of tightly coupled, distributed HPC workloads. With ND A100 v4, customers can harness the power of interconnected GPUs, each connected via PCIe Gen 4 with an independent NVIDIA Mellanox HDR 200 Gigabit InfiniBand link.
Scalable from eight GPUs and a single VM, to hundreds of VMs and thousands of A100 GPUs- a scale rivaling some of the world’s largest supercomputers- clustering is turnkey with out-of-box support for NVIDIA’s NCCL2 communication library. Distributed workloads benefit from topology-agnostic VM placement and a staggering 1.6 Terabits of interconnect bandwidth per virtual machine, configured automatically via standard Azure deployment constructs such as VM Scale Sets.
Designed in close partnership with NVIDIA, the ND A100 v4 supports the same industry standard Machine Learning frameworks, communication libraries, and containers commonly deployed on-premise as a standard Azure VM offering.
The ND v4 is in limited preview now, with an expanded public preview arriving late this year.
NVIDIA T4–Powered Azure VMs for Right-Sizing Cloud GPU Deployments
Also new to Azure are NVIDIA T4 Tensor Core GPUs, providing a hardware-accelerated VM for AI/ML workloads with a low overall price point.
The NC T4 v3 series provides a cost-effective, lightweight GPU option for customers performing real-time or small–batch inferencing, enabling them to right-size their GPU spending for each workload. Many customers don’t require the throughput afforded by larger GPU sizes, and desire a wider regional footprint. For these use cases, adopting the NC T4 v3 series with no additional workload-level changes is an easy cost optimization. For customers with larger inferencing needs, Azure continues to offer NVIDIA V100 VMs such as the original NC v3 series, in one, two and four GPU sizes.
The NC T4 v3 is an ideal platform for adding real-time AI-powered intelligence to services hosted in Azure. The new NC T4 3 VMs are currently available for preview in the West US 2 region, with 1 to 4 NVIDIA T4 Tensor Core GPUs per VM, and will soon expand in availability with over a dozen planned regions across North America, Europe and Asia.
To learn more about NCasT4_v3-series virtual machines, visit the NCasT4_v3-series documentation.
Azure Stack Hub and Azure Stack Edge is now available with GPUs
Azure Stack Hub is available with multiple GPU options. For example the NVIDIA V100 Tensor Core GPU, which enables customers to run compute intense machine learning workloads in disconnected or partially connected scenarios. The NVIDIA T4 Tensor Core GPU is available in both Azure Stack Hub and Azure Stack Edge and provides visualization, inferencing, and machine learning for less computationally intensive workloads. With NVIDIA Quadro Virtual Workstation running on the NVIDIA T4 instance of Azure Stack Hub, creative and technical professionals can access the next generation of computer graphics and RTX-enabled applications, enabling AI-enhanced graphics and photorealistic design.
Learn more about these recent announcements here: Azure Stack Hub and Azure Stack Edge.
Microsoft Sessions at NVIDIA GTC
|
Session Title
|
Location
|
Speakers
|
Session Type
|
|
Accelerate Your ML Life Cycle on Azure Machine Learning (A22247)
Azure Machine Learning helps scale out deep learning training and inferencing using distributed deep learning frameworks to parallelize computation with NVIDIA GPUs. See how you can scale your ML workflows in a repeatable manner and automate and drive cost efficiencies into the entire ML life cycle across model building, training, deployment, and management.
|
US
|
Keiji Kanazawa Principal Program Manager, Microsoft
|
Live
Tuesday, Oct 6, 08:00 – 08:50 PDT
|
|
Accelerating PyTorch Model Training and Inferencing with NVIDIA GPUs and ONNX Runtime [A22270]
Extend the Microsoft experience of training large natural language model with ONNX Runtime and Azure Machine Learning to your own scenarios.
|
US
|
Natalie Kershaw
Senior Program Manager, Microsoft
|
On Demand
|
|
Visualization and AI inferencing using Azure Stack Hub and Azure Stack Edge [A22269]
Learn how you can use Azure Stack Hub or Edge to run machine learning models at the edge locations close to where the data is generated. We’ll demonstrate how to train the model in Azure or Azure Stack Hub to run the same application code across cloud GPU and edge devices and distribute these models to edge, using hosted services like Azure IoT Edge or as Kubernetes containers.
|
US
|
Vivek N Darera
Principal Program Manager, Microsoft
|
On Demand
|
|
|
|
|
|
|
AI and GPU Infrastructure at Every Scale in Azure [A22245]
Join us for a brief walkthrough of Azure’s GPU-equipped infrastructure capabilities, from visualization to massively-parallel AI training supercomputers powered by the latest NVIDIA A100 GPUs and Mellanox HDR InfiniBand. From the cutting edge of AI research to production deployment of ML services worldwide — and any scenario in between — Azure has a VM for every workload.
|
US
|
Ian Finder
Senior Program Manager, Microsoft
|
On Demand
|
by Contributed | Oct 1, 2020 | Azure, Technology, Uncategorized
This article is contributed. See the original author and article here.
Given the richness and potential sensitivity of data stored in security solutions such as Azure Sentinel they can become important targets for external threat actors who gain access to the environment as well as malicious insiders and therefore should be monitored for specific threats. To assist in this a new feature was recently added to Log Analytics (the technology the underpins Azure Sentinel’s log storage and query capabilities), that allows you to capture an audit log of all queries run against the workspace. In this blog we will look at how we can use this new audit feature to monitor and hunt in these audit logs to find potentially malicious activity.
My colleague Sarah Young has shared a great blog covering some aspects of the audit log and how it can be combined with Azure Activity data to give you a wider perspective on user activity. In this blog I am going to take it a step further and deep dive into the details of the logs and look at some hunting and detection queries for this log source that we recently released.
Details of how to set up this audit logging can be found in the audit log documentation. For this blog we are assuming you are writing the audit logs into an Azure Sentinel workspace. Whilst it is possible to write the logs to other sources such as Azure Storage it is recommended for monitoring that you store in an Azure Sentinel Workspace so that you can leverage its capabilities to support hunting and detections.
Anatomy of the Audit Log
Before we start hunting in the logs we need to understand the structure of it and where to find the most valuable data. From a security perspective there are a few fields of particular interest which the table below details. Once you start collecting these audit logs you should spend some time to ensure that you fully understand what they contain.
|
Column Name
|
Details
|
|
Time Generated
|
This is the UTC time that the query was submitted.
|
|
AADEmail
|
This is the email/UPN of the user who submitted the query.
|
|
RequestClientApp
|
This is the name of the client type used to run the query, for queries made via the Azure Sentinel UI it will be populated with “ASI_Portal” – this is broadly analogous to a UserAgent.
|
|
QueryText
|
This is as string of the query text that is being executed. It often includes elements not present in the UI, for example you may see “set query_take_max_records=10001;set truncationmaxsize=67108864;” at the start of a query, this is automatically added by the client and was not necessarily entered by the user themselves.
|
|
RequestContext
|
This is the Azure resource the query was run against. This field is useful if you have the audit log from multiple workspaces aggregated in one workspace as this helps you identify the target workspace for the query. If the query covers multiple workspaces there will be multiple values here.
|
|
ResponseCode
|
The is the HTTP response code from submitting the query i.e. 200 indicates the query executed without issue.
|
|
ResponseRowCount
|
The number of result rows the query returned.
|
|
ResponseDurationMs
|
How long the query took to execute and return a response.
|
Hunting and Detection Opportunities
ATT&CK T1530, T1213, T1020
One of the most obvious and easy detection opportunities with these audit logs is to look for specific key words in the queries being run. Given that security logs often contain an abundance of personal detail a malicious user may want to search the data for specific user activity. We can easily identify this by looking for queries that contains unique identifiers for those users. Below is an example of a query that looks for queries that contains the email addresses of specified VIP users. You could also modify this to include searches for display names or other identifiers. Whilst a security analyst may have legitimate reason to search based on a specific user identifier such as this it would not be expected to be a regular search unless analysts were given specific tasking.
let vips = dynamic(['vip1@email.com','vip2@email.com']);
  let timeframe = 1d;
  LAQueryLogs
  | where TimeGenerated > ago(timeframe)
  | where QueryText has_any (vips)
  | project TimeGenerated, AADEmail, RequestClientApp, QueryText, ResponseRowCount, RequestTarget
ATT&CK T1530, T1213
In a similar manner as the query above we can also look for users querying for secrets within logs. It is not uncommon for passwords and other secrets to leak into logs and a malicious actor could easily use KQL to search for these. There have been several high profile incidents where plain text credential’s appeared in logs, such as the incident Twitter reported in 2018, and attackers are likely to take advantage of access to a SIEM solution such as Azure Sentinel to check for this. For more on hunting for credentials in datasets please take a look at this RSA blog.
Given the numerous cases where a user might legitimately search of strings such ‘password’ you will need to tailor the keyword and exclusion lists for your environment.
 // Extend this list with items to search for
  let keywords = dynamic(["password", "pwd", "creds", "credentials", "secret"]);
  // To exclude key phrases or tables to exclude add to these lists
  let table_exclusions = dynamic(["AuditLogs","SigninLogs", "LAQueryLogs", "SecurityEvent"]);
  let keyword_exclusion = dynamic(["reset user password", "change user password"]);
  let timeframe = 7d;
  LAQueryLogs
  | where TimeGenerated > ago(timeframe)
  | where RequestClientApp != 'Sentinel-General'
  | extend querytext_lower = tolower(QueryText)
  | where querytext_lower has_any(keywords)
  | project TimeGenerated, AADEmail, QueryText, RequestClientApp, RequestTarget, ResponseCode, ResponseRowCount, ResponseDurationMs, CorrelationId
  | extend timestamp = TimeGenerated, AccountCustomEntity = AADEmail
  | join kind=leftanti ( LAQueryLogs
  | where TimeGenerated > ago(timeframe)
  | where RequestClientApp != 'Sentinel-General'
  | extend querytext_lower = tolower(QueryText)
  | where QueryText has_any(table_exclusions) or querytext_lower has_any(keyword_exclusion))
  on CorrelationId
ATT&CK T1530, T1213
An attacker who compromises an account could leverage that account to access Azure Sentinel/Log Analytics even if that user does not regularly use the service. Therefore we can hunt for situations where we see a user executing queries who has not recently done so. This query is likely to be too false positive prone to be useful as detection logic but makes a useful hunting starting point.
let lookback = 7d;
  let timeframe = 1d;
  LAQueryLogs
  | where TimeGenerated   between(startofday(ago(lookback))..startofday(ago(timeframe)))
  | summarize by AADEmail
  | join kind = rightanti (LAQueryLogs
  | where TimeGenerated > ago(timeframe))
  on AADEmail
  | project TimeGenerated, AADEmail, QueryText, RequestClientApp, RequestTarget
  | extend timestamp = TimeGenerated, AccountCustomEntity = AADEmail
ATT&CK T1530, T1213
As with new user query we can also hunt for new Service Principals running queries. It is important to cover this perspective as well as Service Principals can also be given access to run queries. Whilst the number of Service Principals running queries is likely to be more static than with users this query is still likely to be false positive prone and therefore is better suited as a hunting query.
 let lookback = 7d;
  let timeframe = 1d;
  LAQueryLogs
  | where TimeGenerated between (ago(lookback)..ago(timeframe))
  | where ResponseCode == 200 and RequestClientApp != "AppAnalytics" and AADEmail !contains "@"
  | distinct AADClientId
  | join kind=rightanti(
  LAQueryLogs
  | where TimeGenerated > ago(timeframe)
  | where ResponseCode == 200 and RequestClientApp != "AppAnalytics" and AADEmail !contains "@"
  )
  on AADClientId
  | extend timestamp = TimeGenerated, AccountCustomEntity = AADEmail
ATT&CK T1530, T1213, T1020
Often when an account is compromised by an external attacker there are indicators that the account is not being controlled by a legitimate user, one of these indicators can be when the account uses a technology not commonly associated with regular users. We can look for this in the audit log by monitoring for queries executed by a client type we have not previously seen. This query can also be combined with some of the anomaly detection queries detailed later in order to create a more refined detection or hunting query.
let lookback = 7d;
  let timeframe = 1d;
  LAQueryLogs
  | where TimeGenerated between (ago(lookback)..ago(timeframe))
  | where ResponseCode == 200
  | join kind= rightanti(
  LAQueryLogs
  | where TimeGenerated > ago(timeframe)
  )
  on RequestClientApp
  | extend timestamp = TimeGenerated, AccountCustomEntity = AADEmail
ATT&CK T1030
A malicious actor with access to a data source may look to exfiltrate date from the source for persistent offline access. During the 2014 breach of Anthem attackers searched across datasets to find material of interest and then extracted these in bulk queries . We can monitor this activity such as this by looking for multiple large queries made by a single user. Most legitimate users are unlikely to run multiple queries that return many thousands for rows as data that size is unmanageable from an analysis perspective.
  let UI_apps = dynamic(['ASI_Portal','AzureMonitorLogsConnector','AppAnalytics']);
  let threshold = 3;
  let timeframe = 1d;
  LAQueryLogs
  | where TimeGenerated > ago(timeframe)
  | where (ResponseRowCount == 10001 and RequestClientApp in(UI_apps)) or (ResponseRowCount > 10001 and RequestClientApp !in(UI_apps))
  | summarize count() by AADEmail
  | where count_ > threshold
  | join kind=rightsemi (
  LAQueryLogs
  | where TimeGenerated > ago(timeframe)
  | where (ResponseRowCount == 10001 and RequestClientApp in(UI_apps)) or (ResponseRowCount > 10001 and RequestClientApp !in(UI_apps)))
  on AADEmail
  | extend timestamp = TimeGenerated, AccountCustomEntity = AADEmail
ATT&CK T1030
As well as just looking for large query results, we can use KQL’ timeseries capabilities to look for anomalies in the volume of data being returned by a user. Whilst this may generate some false positives for users who only use the service occasionally it is an effective tool for identifying suspicious changes in regular user’s activity.
 let lookback = 7d;
  let threshold = 0;
  LAQueryLogs
  | make-series rows = sum(ResponseRowCount) on TimeGenerated in range(startofday(ago(lookback)), now(), 1h)
  | extend (anomalies, score, baseline) = series_decompose_anomalies(rows,3, -1, 'linefit')
  | mv-expand anomalies to typeof(int), score to typeof(double), TimeGenerated to typeof(datetime)
  | where anomalies > threshold
  | sort by score desc
  | join kind=rightsemi (
  LAQueryLogs
  | summarize make_set(QueryText) by AADEmail, RequestTarget, TimeGenerated = bin(TimeGenerated, 1h))
  on TimeGenerated
  | project TimeGenerated, AADEmail, RequestTarget, set_QueryText
  | extend timestamp = TimeGenerated, AccountCustomEntity = AADEmail
ATT&CK T1530, T1213, T1020
As well as looking for anomalies in data volume we can also look for anomalies in the number of different workspaces that a user is querying. A user who regularly runs queries against a single workspace who then suddenly starts querying multiple workspaces is a potential indicators of malicious activity.
 let lookback = 30d;
  let timeframe = 1d;
  let threshold = 0;
  LAQueryLogs
  | where TimeGenerated between (ago(lookback)..ago(timeframe))
  | mv-expand(RequestContext)
  | extend RequestContextExtended = split(RequestTarget, "/")
  | extend Subscription = tostring(RequestContextExtended[2]), ResourceGroups = tostring(RequestContextExtended[4]), Workspace = tostring(RequestContextExtended[8])
  | summarize count(), HistWorkspaceCount=dcount(Workspace) by AADEmail
  | join (
  LAQueryLogs
  | where TimeGenerated > ago(timeframe)
  | mv-expand(RequestContext)
  | extend RequestContextExtended = split(RequestTarget, "/")
  | extend Subscription = tostring(RequestContextExtended[2]), ResourceGroups = tostring(RequestContextExtended[4]), Workspace = tostring(RequestContextExtended[8])
  | summarize make_set(Workspace), count(), CurrWorkspaceCount=dcount(Workspace) by AADEmail
  ) on AADEmail
  | where CurrWorkspaceCount > HistWorkspaceCount
  // Uncomment follow rows to see queries made by these users
  //| join (
  //LAQueryLogs
  //| where TimeGenerated > ago(timeframe))
  //on AADEmail
  //| extend timestamp = TimeGenerated, AccountCustomEntity = AADEmail
ATT&CK T1530, T1213, T1020
As well as looking for timeseries based anomalies in data volume we can also look for situations where a specific users total returned rows of data for a day increases significantly from the last seven days. Whilst this may produce false positives in occasional users it can be a useful hunting query when looking at users who regularly run queries but who suddenly exhibit suspicious behavior.
let threshold = 10;
  let lookback = 7d;
  let timeframe = 1d;
  let baseline = 10000;
  let diff = 5;
  let anomolous_users = (
  LAQueryLogs
  | where TimeGenerated between(startofday(ago(lookback))..startofday(ago(timeframe)))
  | summarize score=sum(ResponseRowCount) by AADEmail
  | join kind = fullouter (LAQueryLogs
  | where TimeGenerated > startofday(ago(timeframe))
  | summarize score_now=sum(ResponseRowCount) by AADEmail)
  on AADEmail
  | extend hist_score = iif((score/29)*threshold > baseline, (score/29)*threshold, baseline)
  | where isnotempty(score)
  | where score_now > hist_score*diff
  | project AADEmail);
  LAQueryLogs
  | where TimeGenerated > ago(timeframe)
  | where AADEmail in(anomolous_users)
  | extend timestamp = TimeGenerated, AccountCustomEntity = AADEmail
  // Comment out the line below to see the queries run by users.
  | summarize total_rows = sum(ResponseRowCount), NoQueries = count(), AvgQuerySize = sum(ResponseRowCount)/count() by AADEmail
ATT&CK T1020
Another indicator of suspicious activity is the repeated failure of queries. Regular users are unlikely to have many queries that fail repeatedly. Instead this is likely be caused by misconfigured automated queries. Legitimate services are likely to catch and remediate such issues quickly so searching for repeated failures can help to identify malicious services.
let lookback = 7d;
  let timeframe = 1h;
  let threshold = 10;
  LAQueryLogs
  | where TimeGenerated > ago(lookback)
  | where ResponseCode != 200
  | summarize count() by AADEmail, bin(TimeGenerated, timeframe)
  | where count_ > threshold
  | join kind=rightsemi (
  LAQueryLogs
  | where TimeGenerated > ago(lookback)
  | summarize make_set(QueryText) by AADEmail, bin(TimeGenerated, timeframe))
  on AADEmail, TimeGenerated
  | extend timestamp = TimeGenerated, AccountCustomEntity = AADEmail
All of the queries detailed here are available via the Azure Sentinel GitHub, in addition we are continuing our work to look at these audit logs and we hope to publish additional material on how to use them to make you queries, and team operations more efficient in the near future.
Thanks to Ashwin Patil, Christopher Glyer and Shain Wray for thier input, and ideas on this topic.
by Contributed | Oct 1, 2020 | Azure, Technology, Uncategorized
This article is contributed. See the original author and article here.
Azure Security Center assesses your environment and enables you to understand the status of your resources, to help you improve the Security Posture. The heart of the Security Center lies in its recommendations. Security recommendations help you to reduce the attack surface across your workloads. One important recommendation that Security Center has is to identify if your computers have an endpoint protection solution installed.
Azure Security Center monitors the status of antimalware protection and reports this under the ‘Enable Endpoint protection’ security control when it identifies the Antimalware solution is not installed or unhealthy. Security Center highlights issues, such as detected threats and insufficient protection, which can make your virtual machines vulnerable to antimalware threats. This is a very important recommendation because malware cannot only be downloaded or installed by threat actors, but also inadvertently by legitimate users who are supposed to access your machines.
Azure Security Center covers a variety of Antimalware vendors today. You can find the list of supported versions in this article. However, in a scenario where you’re using an antimalware protection that is not in the Azure Security Center supported list but you still want to have visibility over the status of this antimalware using Security Center dashboard, how would you tackle this scenario? In this blog, I would like to walk you through a Github artifact that will help you monitor any antimalware you may be using even if it is not in the Security Center supported list.
The Github artifact will deploy a Guest Configuration policy to monitor antimalware in your machines. For context, Azure Guest Configuration Policy can audit settings inside a machine, both for machines running in Azure and Arc Connected Machines, the validation is performed by the Guest Configuration extension and client. Before we deploy this artifact, let’s understand the resources that’s making it all possible.
Expected contents of this Custom Guest Configuration artifact
The completed package is used by Guest Configuration to create the Azure Policy definitions. The package consists of:
– Modules folder
- AzureGuestConfigurationPolicy module
- DscResources module
- (Windows) DSC resource modules required by the MOF
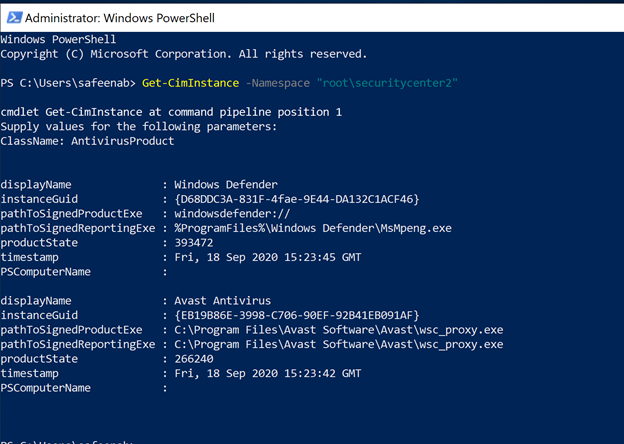
The DSC module in the artifact, is checking CIM Instance (Get-CimInstance) in the SecurityCenter namespace to check for any antivirus product installed in the Windows VM and the query returns the list of antimalware installed in the machine (an example is as shown in Image 1).
 Image 1: Get-CimInstance output
In my example here, the VM is running Windows Defender as well as Avast Antivirus. Azure Security Center can discover Windows Defender however, Avast Antivirus discovery is not supported.
The DSC is then trying to identify if there is a process running that executable on the VM, which evaluates the Antivirus is not just installed but it’s running and healthy in a given VM.
The DSC is using Get-Process that will find the process running in the machine (an example is as shown in Image 2). If there’s no instance of a process running the Antivirus executable found, the validation will stop and returns a status of Stopped providing you a clear description.

 Image 2: Get-Process output
In summary, If the antimalware is not found in the CIMInstance list, then the DSC returns Absent. If it is found, but doesn’t identify the process running, it will return:
Ensure = “Present”
Status = “Stopped”
If the process is found, then:
Ensure = “Present”
Status = “Running”
For an overview of DSC concepts and terminology, see PowerShell DSC Overview.
Under AzureGuestConfigurationPolicy folder, you’ll find a module (AzureGuestPolicyHelper.psm1) that will help you create policy package, upload it directly to your Azure subscription and will configure everything for you. Let’s take a step back and review the resources in here.
When auditing Windows, Guest Configuration uses a Desired State Configuration (DSC) resource module to create the configuration file. The DSC configuration defines the condition that the machine should be in. If the evaluation of the configuration fails, the policy effect auditIfNotExists is triggered and the machine is considered non-compliant.
In our example, under the Configuration folder you’ll notice a bogus configuration which is needed for Azure Guest Configuration policy during execution. So here, the configuration that will be used for the policy. In our scenario, we want to monitor Antivirus making sure the antivirus is installed and the agent is running. Find the sample below for reference,
Configuration MonitorAntivirus
{
Import-DscResource -ModuleName EndPointProtectionDSC
Node MonitorAntivirus
{
EPAntivirusStatus AV
{
AntivirusName = “Windows Defender”
Status = “Running”
Ensure = “Present”
}
}
}
cd $env:Temp
MonitorAntivirus
NOTE: Though I’m specifying Windows Defender as the AntivirusName in the configuration file, it could really be anything. You could monitor for any Antivirus software you might be running, during the compile time, which takes me to my next section – Parameters file.
The script is using parameters file (sample below for reference) which basically tells the Azure Guest Configuration policy to monitor for that specific Antivirus software that you specify during the assignment.
Remember, you can use wildcard entry too. For eg., if you want to monitor for ‘Avast Antivirus’ and you’re not sure what is the complete name of the Antivirus Windows is referring it as, you can simply type in as Avast*
@(
@{
Name = ‘AntivirusName’
DisplayName = ‘Antivirus Name’
Description = “Name of the Antivirus Software to monitor.”
ResourceType = “EPAntivirusStatus”
ResourceId = ‘AV’
ResourcePropertyName = “AntivirusName”
DefaultValue = ‘Windows Defender’
#AllowedValues = @(‘Avast’,’Windows Defender’,’CrowdStrike’,’Sentinel One’)
}
)
This entire configuration is compiled into a .MOF file which will eventually be stored in the Azure blob storage account that you specify during the execution.
Make sure to read about how Azure Policy’s Guest Configuration works that will help you understand this script in detail.
Execution of this Custom Guest Configuration policy:
Pre-requisites:
- Make sure to download the entire artifact from the Github repository and save the unzipped folder to your local machine under ‘C:Program FilesWindowsPowerShellModules’ before the execution.
- To audit settings inside a machine, the Guest Configuration extension and a managed identity is required to audit Azure virtual machines. To deploy the extension at scale, make sure to choose appropriate scope and assign the policy initiative ‘Deploy prerequisites to enable Guest Configuration policies on virtual machines’ under Azure Policies as shown in the image (Image 3) below.
 Image 3: Deploy Prerequisites to enable Guest Configuration Policies in VMs
Refer to this article, to understand Scope in Azure Policy.
 Image 4: Policies under Guest Configuration Policy Initiative
To understand the Effect Type of the policies, please refer to this article
Once you’ve assigned the Guest Configuration policy to a specific Scope, you can monitor the Compliance of the policy from the ‘Compliance’ section under ‘Azure Policy’. As shown in the below Image 5.
 Image 5: Guest Configuration Policy Initiative showing Compliance
Once you have taken care of the pre-requisites, proceed with the execution of the policy.
Execution:
- Open the PowerShell as an administrator and run the command ‘New-EPDSCAzureGuestConfigurationPolicyPackage’ which will create policy package for you in your Azure Subscription.
- You’ll first be prompted to enter a Resource Group Name, Resource Group Location, Storage Container Name, Storage account name and Storage SKU name
- You’ll then be prompted to login to your Azure Subscription
Refer to this article to learn about Storing Guest Configuration artifacts.
- Once connected to your subscription, the script will compile the DSC configuration to a MOF file and will publish the Configuration package to the storage account (you defined in Step 2) in the blob storage (as shown in the below image 6)
- This eventually generates a Guest Configuration policy and publishes the Initiative under Definitions of the Azure Policies as a Guest configuration policy.
- Under the Policies tab, you’ll notice all the individual policy definitions in the initiative that contribute to this control, as shown in image 7 and Image 8.
 Policy Execution
 Image 6: Configuration file that’s uploaded to Storage blob Container
 Image 7: Initiative to monitor Antivirus
 Image 8: Policies under the Initiative
Now it’s time to assign this Initiative to the scope you desire to target. The term scope refers to all the resources, resource groups, subscriptions, or management groups that the definition is assigned to.
Please refer this article, to learn more about the assignment and for steps to assign it via PowerShell and Azure CLI.
While you’re assigning this Initiative to a Scope, you could modify the Assignment name if required as shown in the gif below.
 Policy Assignment
Once you’ve assigned the custom policy, review the Compliance state of the policies by navigating to ‘Compliance’ under Azure Policy and selecting the Initiative. The Resource compliance tab provides a granular view of each resource that’s evaluated by a member policy of the currently viewed control.
 Checking Compliance
In my example, I’m monitoring to gather details of VMs which do not have installed and not running. I’ve two resources (epptest (VM without Avast Installed) and vmclient (VM with Avast Installed)) in the selected scope. The script is identifying the VM that do not have Avast installed and raising the non-compliance of the resource with the help of ‘Audit policy’.
Assign the Custom Initiative to Azure Security Center
You can add the custom Initiative to Security Center to receive recommendations if your environment doesn’t follow the policy you created. As we learnt above, Security Center automatically runs continuous scans to analyze the security state of your Azure resources. When Security Center identifies potential security vulnerabilities, it creates recommendations that guide you through the process of configuring the needed security controls. Security Center updates the Endpoint Protection issue recommendations within 8 hours.
To assign this Custom Initiative, navigate to Security Policy under Security center and choose the desired subscription or Management Group. Click on ‘Add a Custom Initiative’ under Your Custom Initiatives that should take you to a screen as below (Image 9), find the Initiative created above and click on ‘add’
 Image 9: Add Custom Initiative
Your new Initiative takes effect and you can see the impact in two ways:
- From the Security Center sidebar, under Policy & Compliance, select Regulatory compliance. The compliance dashboard opens to show your new custom initiative alongside the built-in initiatives.
- You’ll begin to receive recommendations if your environment doesn’t follow the policy you’ve defined.
To see the resulting recommendations for your policy, click Recommendations from the sidebar to open the recommendations page. The recommendations will appear with a “Custom recommendations” label as shown in Image 10
 Image 10: Custom Recommendations
NOTE: Make sure to disable the Endpoint protection policy (in the built-in ASC initiative) that generates missing Endpoint protection recommendation inorder to prevent it appearing again and to avoid it to be counted to the overall Secure score.
The disable policy changes can take up to 12 hours to take effect.
Refer to this article to disable a recommendation to appear by disabling the specific policy that generates the recommendations.
Enhance custom Recommendations
You can further enhance your custom recommendations similar to the built-in recommendations. The built-in recommendations supplied with Azure Security Center includes details such as severity levels and remediation instructions. If you want to add this type of information to your custom recommendation, follow this article
This GitHub Artifact as well as many other can be found here:
Direct Link to GitHub sample
Azure Security Center GitHub Repo
Additional Resource:
Big shoutout to Microsoft365DSC which made this all possible. Check it out.
Are you an organization using Endpoint protection outside of what ASC supports? Don’t worry anymore, go ahead and deploy this policy to witness the magic.
Reviewer
Special Thanks to @Yuri Diogenes, Principal Program Manager in the CxE ASC Team for reviewing this article.

by Contributed | Oct 1, 2020 | Azure, Technology, Uncategorized
This article is contributed. See the original author and article here.
|
Microsoft partners like Unravel Data, Tidal Migrations, and NGINX deliver transact-capable offers, which allow you to purchase directly from Azure Marketplace. Learn about these offers below:
 |
Unravel for Azure HDInsight: This monitoring, tuning, and troubleshooting tool from Unravel gives you instant visibility into Microsoft Azure HDInsight clusters with a single click. Unravel provides AI-powered recommendations and automated actions to optimize big data pipelines and applications, maximizing cost savings. Unravel for Azure HDInsight installs Unravel on an edge node in your cluster. Try it free for 14 days.
Unravel for Azure Databricks and Azure HDInsight: Unravel’s monitoring, tuning, and troubleshooting tool for Spark on Microsoft Azure Databricks and HDInsight provides granular chargeback and cost optimization for big data workloads. Evaluate your migration from on-premises Hadoop to Azure, optimize your cluster resources, provide essential context to DataOps teams, and maximize Spark performance and reliability in the cloud.
|
 |
Tidal Migrations Platform: The Tidal Migrations platform provides your team with a simple, fast, and cost-effective cloud migration management solution. Its efficient tools enable you to gather and organize information in an application-centric way, with source code analysis and PDF cloud application assessment reports. Share dashboards and collaborate as you discover, assess, plan, and execute your migration to Microsoft Azure.
Tidal Migrations -Premium Insights for Database: This add-on to your Tidal Migrations subscription enables you to quickly analyze your databases, identifying roadblocks to cloud migrations based on more than 100 unique characteristics. Databases are analyzed based on their metadata, looking at specific schema objects and permissions, as well as any proprietary features that won’t be available in the target platforms.
Tidal Migrations -Premium Insights for Source Code: Use this add-on to your Tidal Migrations subscription to provide insights about the applications you plan to refactor or replatform to Microsoft Azure. Scan your application source code, identifying roadblocks to cloud migrations based on 140+ patterns. Detect the frameworks in use (Struts, Rails, jQuery, etc.) as well as vulnerabilities in your code today.
|
 |
NGINX Plus: Deliver applications with performance, reliability, security, and scale with NGINX Plus on Microsoft Azure. NGINX Plus is lightweight yet serves as an all-in-one load balancer, reverse proxy, API gateway, and content cache. Deploy quickly and cost-effectively with NGINX Plus, and benefit from speeds of less than 30 milliseconds.
|
|
by Contributed | Oct 1, 2020 | Uncategorized
This article is contributed. See the original author and article here.
Edited by @Edwin Hernandez
Please find below a collection of publicly available tools that I find valuable for QA/Test Engineers, either for Performance Testing or UI Test automation. These tools have been passed around internally on the MSFT Test Team, some of them for years. Most of them cover a tiny niche and thus can be considered a bit buried or obscure, but if they are what you need, they can help you.
BUILD QUALITY CHECKS
(First reported by Bernhard Vogel)
- Using Azure DevOps “Build Quality Checks“ tasks, you can easily control that the quality steadily goes up from build to build. There are various smart metrics to use, i.e. compare test coverage of the previous build with the current build and if it trends down > fail the build.

- Policies:
-
The Build Quality Checks task currently supports two policies (click the link for details):
-
Warnings Policy – Allows you to fail builds based on the number of build warnings.
-
Code Coverage Policy – Allows you to fail builds based on the code coverage value of your tests.
Available here: https://marketplace.visualstudio.com/items?itemName=mspremier.BuildQualityChecks#overview
SCREEN TO GIF
(First reported by Johnathan Liu)
- This tool allows you to record a selected area of your screen and save it as a Gif.
- I have to share out this very cool tool called ScreenToGif that was shown to me by a couple of TAMs in the UK. It allows you to record your actions on screen and turn them into awesome animated gifs. I could see this being incredibly useful for tutorials, repros, and demos.
- You can share animated gifs on Twitter/Yammer and other social networks.

Features:
- Record your screen and save directly to a gif looped animation.
- Pause and continue to record.
- Move the window around to record what you want.
- You can add Text, Subtitles, and Title Frames.
- Edit the frames, add filters, revert, make yoyo style, change frame delay, add a border, add progress bars.
- Export frames.
- Crop and Resize.
- You can work even while the program is recording.
- Remove frames that you don’t want.
- Select a folder to save the file automatically or select one before encoding.
|
- Add the system cursor to your recording.
- Very small-sized, portable, and multi-language executable.
- Start/Pause and stop your recording using your F keys.
- Multi-language: Portuguese, Spanish, Romanian, Russian, Swedish, Greek, French, Simplified Chinese, Italian, Vietnamese, and Tamil.
- GreenScreen unchanged pixels to save kilobytes.
- You can apply actions/filters to selected frames.
- Fullscreen Recording.
- Snapshot Mode.
- Drag and Drop to add frames in the editor.
|
Available here: https://www.microsoft.com/en-us/p/screentogif/9n3sqk8pds8g?activetab=pivot:overviewtab#
BOT SERVICE STRESS TOOLKIT
(First reported by Bernhard Vogel, a tool created by Daniel Amadei)
-
Bot Service Stress Toolkit is based on Apache JMeter (which is an open-source stress-testing product provided by the Apache Software Foundation).
- Features
- Leverages JMeter to make it easy and visual to perform stress tests on Bots.
- Capable of not only making requests to the Bots but also receiving responses and correlating them back to the original requests, measuring the whole cycle.
- Capable of asserting responses if needed, by leveraging native JMeter assertions.
- Capable of loading test data from files or other data sources supported by JMeter.
- Capable of displaying test results in graphs, tables, and/or saving it to CSV files by leveraging native JMeter capabilities as well.
- Measures throughput and latency of your Bot Service applications taking consideration of the whole cycle from the request to when the response is received.
- Able to stress test bots built-in Bot Builder SDK v3 or v4.
- Able to stress test bots running locally or in Azure Bot Service.
You can find more info along with the documentation on how to install, create & run tests here: http://github.com/damadei/BotServiceStressToolkit.
WINDOWS 10 MODERN TERMINAL
(Reported by Edwin Hernandez)
-
New Modern Terminal was created by Microsoft as an open-source project. This Windows 10 app can have several types of shells as tabs on the same terminal window, even Unix shell.
- The project is still on preview but looks great so far:

Give it a try:
https://www.microsoft.com/store/productId/9N0DX20HK701
AZURE DEVOPS DEMO GENERATOR
(Reported by Darren Rich)
- Have you been looking for an example VisualStudio.com site that has:
- Docker-based Java web application along with build & release definitions, to deploy the application to the Docker containers in the Azure App Service (Linux) using VSTS
- SonarQube template contains code of MyShuttle, a sample application that will be provisioned and customized to analyze the code during the build and improve code quality.
- Octopus template contains code for a sample PHP application which will be compiled using VSTS Build and deployed using Octopus Deploy on to an Azure App service.
- Can you answer yes to any of the following questions?
- I’m creating my own VSTS site to learn more about (Docker, AKS, GitHub CICD, Octopus, Selenium, Deployment Groups, WhiteSource-Bold)?
- I’m using the PartsUnlimited project to do XXX?
- Let me e-mail SmartPersonName and see if she can quickly create a demo VSTS site for the meeting?
If you answered yes then you should check out the Azure DevOps Demo Generator site and the corresponding docs page at https://docs.microsoft.com/en-us/vsts/demo-gen/use-vsts-demo-generator-v2?view=vsts

UNIX EPOCH CONVERTER
(Reported by Darren Rich)
- It is very common to come across query string parameters that have a HUGE number assigned to them. You look around forever and do not find a solution.
- One VERY COMMON source of these seemingly odd numbers is a value referred to as Unix Time. The next time you are trying to see if that number you are trying to parameterize is the Unix time you can find the current one at a very cool site.
DEBUGGING TOOLS
(By Edwin Hernandez)
There are some tools used by developers and QA Engineers to do debugging of application, either on the front end or backend as well as the communications between them. These are not so obscure, these are known tools that you may already use, but just in case I wanted to include them on this list:
Wireshark. Packet analyzer for network traffic debugging
Fiddler. Http traffic debugger that uses a proxy to look at communication coming in and out of a host.
Performance Analysis of Logs (PAL) Tool. The PAL tool reads in a performance monitor counter log and analyzes it using complex, but known thresholds.
DebugDiag. Assists in troubleshooting issues such as hangs, slow performance, memory leaks or memory fragmentation, and crashes in any user-mode process.
PerfView. Performance-analysis tool that helps isolate CPU and memory-related performance issues. It is a Windows tool, but it also has some support for analyzing data collected on Linux machines. It works for a wide variety of scenarios but has several special features for investigating performance issues in code written for the .NET runtime.
And update on an old tool:
WinDbg Preview. Multipurpose debugger for Windows that can be used to debug kernel-mode and user-mode code, analyze crash dumps, and examine the CPU registers while the code executes. Microsoft just updated WinDbg to have more modern visuals, faster windows, a full-fledged scripting experience, and Time Travel Debugging. WinDbg Preview is using the same underlying engine as WinDbg, so all the commands, extensions, and workflows still work.


by Contributed | Oct 1, 2020 | Uncategorized
This article is contributed. See the original author and article here.

We had a lot of activity this month, including posts around Security, Collaboration, Power BI, Meetings, KidsX, and Medical Imaging Server! See below for our Healthcare and Life Sciences blog summary for September:
HLS “Show Me How” Post:
-
Transcribe and Translate with Microsoft Word Online in Microsoft Teams – Michael Gannotti, Principal Microsoft Teams Technical Specialist: Mike walks through the easy creation of transcriptions from audio recordings, as well as translation for language accessibility. Watch this to see what you can do with recordings made from a smart phone, video files from a meeting recording and more.
Webcasts Recorded:
-
Making the most of Microsoft 365 on iOS – Microsoft + Imprivata: In this HLS Partner Plays webcast recording, Randy Nale, Healthcare Technology Strategist at Microsoft, and Wes Wright, CTO at Imprivata, show us how to boost efficiency in the demanding hospital setting using Imprivata Mobile and Microsoft 365. Check it out here.
-
HLS Security Monthly with Scott: The HLS Security Monthly features Microsoft’s Scott Murray covers relevant enterprise security topics. In this inaugural episode, Microsoft’s Scott Murray and Tony Sims discuss how easy it is to get started with evaluating Defender ATP via the Evaluation Lab offering that is built right into the Defender platform. Watch it here.
-
How To Ensure Collaboration Security in Microsoft Teams: Do you want to ensure security for your users as they collaborate in Microsoft Teams? On Wednesday, September 30th, Microsoft Technical Specialists Pete and Sam brought in speakers from Microsoft’s trusted partner Unify Square. They dove in beyond the basic native Teams governance with third party specialty tools. Click here for the recording and resources.
-
Power Healthcare Hour – Healthcare Data Strategy Workshop and Power BI Licensing: Microsoft’s Greg Beaumont showcases the pilot episode of the Power Healthcare Hour, where Tail Wind Informatics previews an upcoming webinar “Data Strategy for Healthcare Systems”, reviews common challenges and strategic frameworks, and gives general advice for Healthcare industry around data initiatives and leveraging Power BI licensing. Learn more here.
-
Voices of #HealthcareCloud – Multi-disciplinary huddles with Microsoft Teams: Watch as Microsoft’s Shelly Avery and Josh Thompson show us how to leverage the power of the Microsoft cloud to break down functional boundaries and improve cross functional collaboration through multi-disciplinary huddles in Teams.
Upcoming Webcasts:
-
Finding the Right Meeting Solution for your Workspace: All of our work spaces are in the midst of drastic change. Whether you’re coming back to the office, working from home, planning for the future of collaboration, or some combination, there is a best practice out there for you and your organization. On Wednesday, October 14th, at 12 Noon EST, we are teaming up with Poly to deliver a CollabCast with Sam and Pete, focused on finding the right meeting solutions for your workspaces. Details here.
-
HLS Security Monthly with Scott: During this live webcast, Microsoft’s Scott Murray and Jeremy Windmiller are going to touch on some of the security highlights from Ignite focusing on a handful that are directly relevant to Healthcare and Life Sciences. Click here for more information.
Healthcare Industry Expert Posts:
-
Pediatric Hospitals Collaborating to Advance Digital Innovation: In this podcast, Ryan Tubbs, Digital Transformation Officer for Microsoft Healthcare, speaks with Omkar Kulkarni, Chief Innovation Officer for Children’s Hospital Los Angeles, about their latest initiative, KidsX. Watch and learn.
-
Introducing the Medical Imaging Server for DICOM: Microsoft recently released a new Open Source Software (OSS) that provides developers with a powerful tool to migrate medical imaging data to the cloud and integrate imaging metadata with clinical data in FHIR using DICOM Cast technology. Microsoft’s Heather Cartwright explains its impact on the next horizon of health data transformation in this article.
-
Microsoft Azure and PyTorch help AstraZeneca apply advanced machine learning to drug discovery: At a time when biopharmaceutical scientists must comb through massive amounts of data in the quest to deliver life-changing medicines, Microsoft Azure Machine Learning and PyTorch are helping global biopharmaceutical company AstraZeneca aim to accelerate its drug discovery research. Find out more here.
Best Practice Resources:
-
Microsoft Security Matters Newsletter – August 2020 – Jeremy Windmiller, Enterprise Security Architect: Jeremy has been providing a newsletter to customers that consolidates resources for Microsoft Security Products and Services. Check out the August newsletter.
-
Microsoft GxP Cloud Guidelines: Microsoft’s Senior Director of Business Development and Life Sciences, Daniel Carchedi, talks through how to leverage cloud-based solutions on any device, while supporting “good practice” quality guidelines and regulations. More details around operating GxP applications on Azure, Dynamics 365 and Microsoft 365 are in this post.
September’s HLS Blog Contributors:

Claire Bonaci, Director, Business Development, Health and Life Sciences

Michael Gannotti, Principal Technical Specialist, Microsoft Teams

Jeremy Windmiller, Microsoft Senior Technical Specialist, Security and Compliance

Greg Beaumount, Senior Technical Specialist, Microsoft Teams

Vasu Sharma, Microsoft Customer Success Manager

Shelly Avery, Senior Technical Specialist, Microsoft Teams
.jpg")
Scott Murray, Microsoft Senior Technical Specialist, Microsoft Cybersecurity

Heather Cartwright, GM, Microsoft Health Cloud and Data
Thanks for reading and let us know how else our Microsoft team can help!
.jpg")
Sam Brown, Technical Specialist, Microsoft Teams


Recent Comments