This article is contributed. See the original author and article here.
Development containers with Visual Studio Code can serve as a fantastic tool in education to ensure students have a consistent coding environment. Dev containers take care of setup, which can oftentimes occupy the first few days or weeks of the semester and allow students and instructors to instead focus on what’s truly important: learning and coding something great!
The Visual Studio Code Remote – Containers extension lets you use a container as your main coding environment. In the classroom, an instructor can take an existing dev container, or create their own, and share it with the class. Each student can open the container in VS Code and automatically have the tools and runtimes they need to develop their applications. Students will also have access to VS Code’s full feature set, including IntelliSense and debugging, while coding.
We’d love to learn more about your interest in or usage of development containers in the classroom through the quick 5-minute survey below. Whether you’re already using dev containers in education or just hearing about them now, we want to hear from you. You also have the option to leave your contact information to connect with our engineering team:
This article is contributed. See the original author and article here.
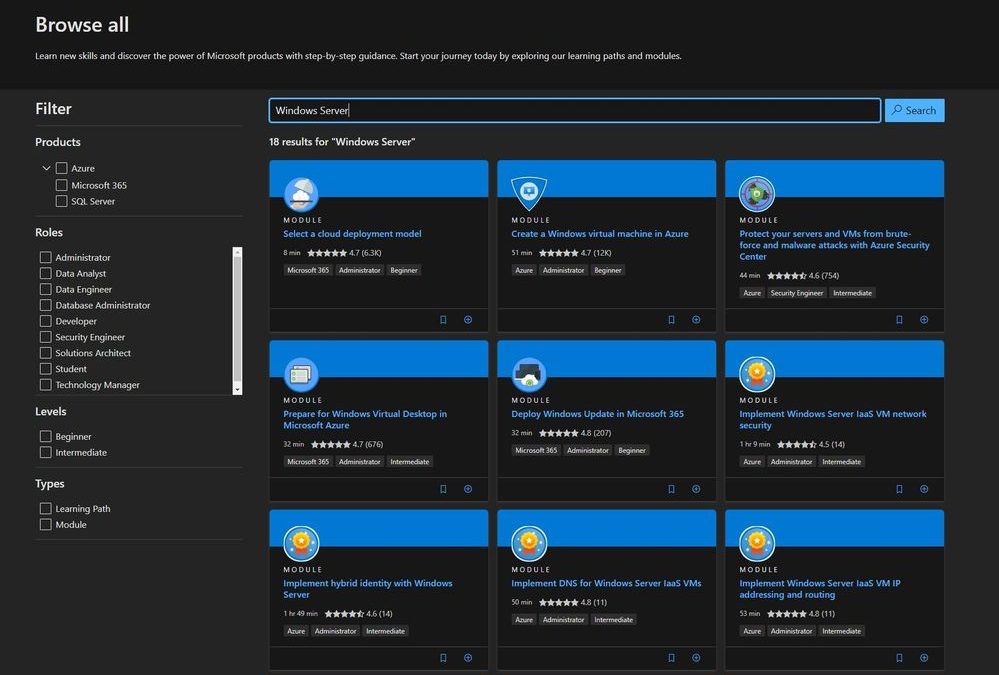
I am sure you already heard of Microsoft Learn. If you haven’t, Microsoft Learn is a free online learning platform around different technology. Whether you’re just starting or an experienced professional, the hands-on approach helps you arrive at your goals faster, with more confidence and at your own pace. In the last couple of days, we published a couple of new Microsoft Learn modules around Azure, Hybrid Cloud, and Windows Server for IT Pros. These modules help you to learn how you can leverage Microsoft Azure in a hybrid cloud environment to manage Windows Server.
New Microsoft Learn Modules for Azure and Windows Server IT Pros
Manage hybrid workloads with Azure Arc
You will learn to describe Azure Arc, implement Azure Arc with on-premises server instances, deploy Azure policies with Azure Arc, and use role-based access control (RBAC) to restrict access to Log Analytics data.
After completing this module, you will be able to:
Describe Azure Arc.
Explain how to onboard on-premises Windows Server instances in Azure Arc.
Connect hybrid machines to Azure from the Azure portal.
Migrate on-premises Windows Server instances to Azure IaaS virtual machines
You’ll be able to plan a migration and select appropriate server migration tools. You will also learn how to use Azure Migrate, how to assess physical servers, and how to migrate those servers.
After completing this module, you will be able to:
Plan your migration.
Describe Azure Migrate.
Migrate server workloads using Windows Server Migration Tools.
You’ll learn about Azure Backup before learning to implement Recovery Vaults and Azure Backup Policies. You’ll learn to implement Windows IaaS VM recovery, perform backup and restore of on-premises workloads, and manage Azure VM backups.
After completing this module, you will be able to:
Describe Azure Backup.
Implement Recovery Vaults.
Implement Azure Backup policies.
Recover Windows IaaS VMs.
Perform file and folder recovery.
Perform backup and recovery of on-premises workloads.
Explain how to manage Azure VM backups with Azure Backup.
This article is contributed. See the original author and article here.
Hi, Jonas here!
Or as we say in the north of Germany: “Moin Moin!” I am a Customer Engineer based in Germany and I recently played a bit with Azure Log Analytics (now called Azure Monitor) and the on-premises monitoring capabilities and I want to show you, how easy it is to monitor your own MECM / ConfigMgr environment.
TL;DR
If you ever saw performance problems in your ConfigMgr environment and if you are interested in an easy way to create a ConfigMgr performance baseline, this is the right article for you. I am explaining the concept and setup and provide a list of useful performance counters in the: “List of useful performance counters” section below. Analyzing the gathered data will be a topic for a next article though, but you will be able to output something like shown in the picture below:
A baseline as a starting point:
When you encounter a performance issue in you environment you might not be able to tell if that is just the result of a normal increase in usage and you simply need more CPU or RAM or if what you encounter is an anomaly were you need to find the root cause to be able to get back to normal without the extra need for resources.
A baseline can help you answer this very basic question and then act before the real problem starts.
So, if you have gathered data for about a month or so and you see something like this:
You have your baseline with some ups and downs, and you should be able to tell, if the next performance decrease is just a normal increase in usage (as shown in the left picture below) or an anomaly which you need to analyze and fix (as shown in the right picture below). (A very simplified graphic visualization)
The setup options:
As mentioned before, I am using Azure Monitor/Azure Log Analytics to monitor my on-premises environment and Log Analytics gives me two options to send data to the Log Analytics service.
You can either send the data directly from the monitoring agent (running on the local machine) to Azure Log Analytics (see option 1 below) or use the Azure Log Analytics Gateway if not every machine has direct access to the internet (see option 2 below).
Since my machines have direct access, I simply installed the Log Analytics agent on them and used option 1 (see above) to send performance data to my workspace and I followed the following steps:
Step 1: Create Log Analytics workspace
All you need is an Azure Subscription where you can create an Azure Log Analytics workspace. The steps are documented here: Create workspace
Step 2: Install Log Analytics agent
Go to your new Log Analytics workspace and click on “Agents management” to download the Log Analytics agent to the machines you would like to monitor.
During the agent setup select “Connect the agent to Azure Log Analytics (OMS)” and click “Next”.
On the next page you need to copy and paste the “Workspace ID” and the “Primary Key” from the “Agents management” site we used earlier to point the agent to the correct workspace. If you need to set up a proxy for the connection, you can do this via the “Advanced” button.
Step 3: Verify connectivity
You can find the installed “Microsoft Monitoring Agent” in Control Panel under “System and Security”. (you will find multiple names for the agent in the documentation)
On the “Azure Log Analytics (OMS)” tab you can verify the successful connection to you Log Analytics workspace:
If you go back to the “Agents management” site in your Log analytics workspace, you can click on “Go to logs” to verify the successful connection of your agents.
You should be redirected to the “Logs” section, where the following query should output your connected machines.
Keep in mind that it can take a minute for the first data to show up and you might need to click on “Get started” if you see the page for the first time:
If not, go to “Logs” and run the following query:
Heartbeat
| where OSType == ‘Windows’
| summarize arg_max(TimeGenerated, *) by SourceComputerId
| sort by Computer
| render table
Defining the baseline
All you have to do is to add the needed performance counters and let the agent gather the data.
Go to “Advanced settings” in your “Log Analytics workspace“ and click on “Data”, “Windows Performance Counters” and add the counters you like with the plus sign:
For most default counters you can simply use the search box next to the plus sign and add them, but what if we need to add some counters not in the list, the ConfigMgr counters for example?
I wrote a little script called “Get-PerfCounterList.ps1” to help you find the correct counter names and be able to easily copy and paste them into Log Analytics.
IMPORTANT: Run the script as an administrator on the machine you want to monitor with Log Analytics, otherwise only a subset of counters might be visible.
The output is a simple grid view showing you all the available performance counters on the machine.
And if you filter for “SMS” for example, you get a list of the ConfigMgr counters and the path you need for Log Analytics.
All you have to do is to choose the counter you like to monitor and copy the path into the counter search field in Log Analytics and hit the plus sign to add the counter to the list.
If there are multiple instances available (as shown in the screenshot above via the green arrows) you can select multiple counters in the grid view and click on “OK” to get another grid view of those specific instances and the correct path names:
The script is also helpful if you use a named instance to store your ConfigMgr SQL DB, because you then need the exact name of the performance counter.
Since I am using a SQL instance called “INST01”, my counters look like this for example: “MSSQL$INST01:Memory…” instead of “SQLServer:Memory…”:
As mentioned before, simply copy and paste the counter you like into the search bar and click on the plus sign next to it:
I added the “SMS Inbox(*)File Current Count” counter in my example and since the counter will only be refreshed every 15 minutes locally, I set the sample interval to 900 seconds.
Since the counter has 32 instances and each instance will have an entry in Log Analytics, the higher sample interval will limit the data which needs to be stored in Log Analytics.
(At the time of writing the maximum sample interval was 1800 seconds (30 minutes))
When you are done adding all the needed counters, click on “Save” and the counter configuration will automatically be sent to every connected agent.
Sizing estimates
The actual amount of data stored in Log Analytics depends on the sample interval per counter, the number of counters, the number of instances per counter and the number of agents sending data to the workspace.
Use the script mentioned above to see how many instances each counter has and check if each instance is needed or if just a subset is enough to get the baseline you need and adjust the sample interval to save storage space if needed.
You will find more details about that topic in the Log Analytics documentation:
I will not explain every counter in detail, because that would be an article on its own, instead I will add some notes to some of them, if I feel that’s important to the baseline for ConfigMgr.
It is also not a complete list of counters, but the list should give you the most useful data for your baseline.
Use the search term: “Windows Performance Counters Explained” to find resources about the counters and how they are helpful.
Operating System related:
LogicalDiskAvg. Disk sec/Read LogicalDiskAvg. Disk sec/Write LogicalDiskCurrent Disk Queue Length LogicalDiskDisk Reads/sec LogicalDiskDisk Transfers/sec LogicalDiskDisk Writes/sec Memory% Committed Bytes In Use MemoryAvailable Mbytes MemoryPage Reads/sec MemoryPage Writes/sec Network AdapterBytes Received/sec Network AdapterBytes Sent/sec Network InterfaceBytes Total/sec Processor(_Total)% Processor Time SystemProcessor Queue Length
SMS Software Metering ProcessorSWM Usage Records Processed/minute
SMS State SystemMessage Records Processed/min
SMS Status Messages(*)Processed/sec
IIS related:
Web Service(*)Bytes Sent/sec
Web Service(*)Bytes Received/sec
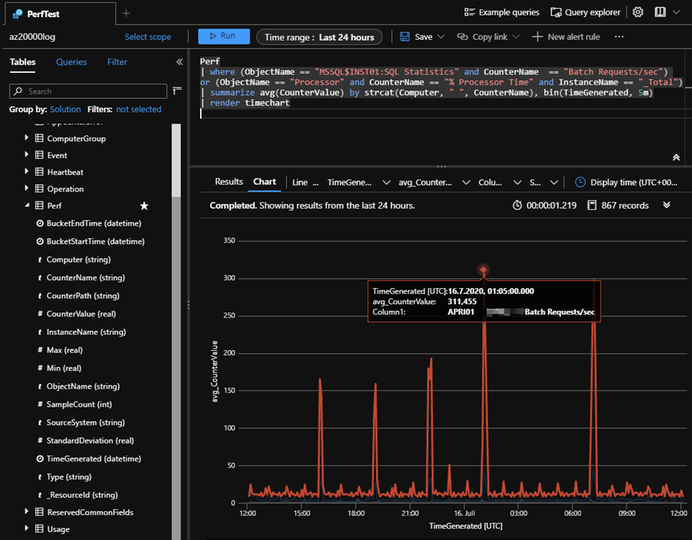
Data visualization
To analyze the gathered data, got to your Azure Log Analytics workspace and click “Logs” (1).
The actual data is stored in the “Perf” table (2) under “LogManagement” and can be queried via the query window (3) using KQL (Kusto Query Language).
In my example, the output is a “timechart” (4), but it can be any type of output Azure Log Analytics is capable of.
The query I am using is just an example, because analyzing the data is a topic on its own and might be worth another article. Other example queries can be found here: LINK
Data preview:
By clicking on the preview icon (see below) you will get a result set with 10 entries back, which helps to explore the gathered data and to finetune your KQL queries:
Alerting and monitoring:
You can create alerts and send out notifications when certain criteria are met, like CPU is at 90% for the last 15 minutes, or a ConfigMgr inbox has over 1000 files in it for the last hour or so and you have the ability to use multiple reporting features to visualize the data like, Azure Monitor Workbooks, Azure Portal Dashboards or PowerBI reports.
I will not explain those topics in this article, since each part would be a topic for its own article. Instead I provide you with a list of links to the documentation if you want to start right away:
Azure Log Analytics / Azure Monitor gives you an easy way of gathering performance data and building your ConfigMgr performance baseline and with KQL and the Alerting feature you have powerful tools to analyze the data and generate alerts when needed.
Have fun monitoring your environment and let me know what you think
Jonas Ohmsen
Microsoft Germany
Disclaimer:
This posting is provided “AS IS” with no warranties, and confers no rights
Every fifteen minutes poachers kill an African elephant. If this continues, elephants will become extinct within ten years. This situation, once desperate, is now dire. And not just for elephants. Grizzly bears, orangutans, lions, and more are also disappearing. Accepting the status quo means losing earth’s treasures, one by one.
But it does not have to be like this.
What if we could save these elephants and other creatures, based on what IoT solutions we already have? Why not use RFID tags and defined MCU sectors that now prevent shoplifting in retail stores to identify when an individual pangolin is stolen? Or repurpose heat mapping cameras that track customer behavior to recognize immediately if a hippo has been off on its own? What if we could learn in real-time, by means of solar-powered drones that monitor oil pipelines, whenever a predator has culled the herd, or a new baby elephant has been born? What about replicating smart cities as smart savannahs?
This is the mission of Microsoft’s Project 15: An animal conservation initiative created to put a spotlight on the problem at hand. Named in recognition of the frequency with which elephants are poached, Project 15 aims to raise awareness in our partner ecosystem and develop positive change through collaboration and IoT technology. To build a bridge for the scientific community to see what solutions we have already, to create the connection to talk to us and our partner ecosystem directly and work to get these problems solved and solutions built out on Azure, the World’s Computer. How can we help?
Hackster.io and Smart Parks are coming together with leading technology and conservation partners to protect the gentle giants in their natural habitats.
Elephant deaths and abuse like those pictured below are much too common, but they can be stamped out with stronger legislation, law enforcement, and conservation. In order to make that a reality, pro-conservation teams need to better data on what is happening, something our collaboration and technology are perfectly positioned to provide.
We’re inviting all Students to join Hackster,io and help develop the world’s most advanced elephant tracking collar, which can help park rangers reduce animal loss from illegal ivory poaching, trophy hunting, human conflict, and environmental degradation. With #ElephantEdge, we’re calling on the community to build ML models using the Edge Impulse Studio and tracking dashboards using Avnet’s IoTConnect, which will be deployed onto 10 production-grade collars manufactured by our engineering partner, Institute IRNAS, and deployed by Smart Parks.
Build machine learning models:
Build ML models with Edge Impulse that will be used for collar deployments. These new models will create a new Human to Elephant Language,powered by TinyML, that will help conservation efforts:
Poaching Risk Monitoring: Build models that can identify an increased risk for poaching. Example: Know when an elephant is moving into a high-risk area and send real-time notifications to park rangers.
Human Conflict Monitoring: Build models and dashboards that can prevent conflict between humans and elephants. Example: Sense and alert when an elephant is heading into an area where farmers live. This collar could detect human presence by scanning if any mobile phones or WiFi hotspots are near, by tapping the available radio modules (Nordic Semiconductor nRF52840, NINA-B30x BLE, Semtech LR1110).
Elephant Musth Monitoring: Build models and dashboards that can recognize when an elephant bull is in musth (a periodic condition in male elephants characterized by highly aggressive behavior and accompanied by a large rise in reproductive hormones). Example: Utilize the motion and acoustic sensors to discern this state of erratic, loud, and aggressive behavior.
Elephant Activity Monitoring: Build models and dashboards that can classify the general behavior of the elephant, such as when it is drinking, eating, sleeping, etc. Example: Detect and report the elephant activity by using accelerometer data. Or go more advanced and use a water detection sensor to see when the elephant goes swimming, drinking, or digging for water.
Elephant Communication Monitoring: Build models and dashboards that can listen for vocal communications between elephants via the onboard microphone. Example: Use sound-recording technology to listen to their vocalizations. Here’s how.
This is an urgent problem that no one has totally solved. Do you have completely out-of-the-box ideas that have never considered?
Courtesy of Alasdair Davies fromArribada.org: Github repo and sensor data containing thermal elephant dataset collected at the ZSL Whipsnade Zoo, made available for use by anyone wishing to train their own models using Edge Impulse for the ElephantEdge competition ( (GPLv3).
Build IoT tracking dashboards:
Build an IoTConnect dashboard that will be used for collar deployments and help park rangers, track, monitor, and get on-demand alerts that are critical to conservation efforts:
Simulate dashboards that track location and leaving protected areas
Build dashboards that report the frequency of entering high-risk areas
Monitor and infer active period vs resting period for the elephants
Simulate alerts when activity deviates from the expected range
Alerts to replace batteries or when a collar malfunctions, goes offline
Design and ideate any other telemetry data and inference
The new collar will use the following hardware and software:
STMicroelectronics LIS2DW12ultra-low-power high-performance three-axis MEMS accelerometer, with configurable single/double-tap recognition, free-fall, wakeup, portrait/landscape, and 6D/4D orientation detections
STMicroelectronics LSM303AGRultra-compact high-performance eCompass module, with a 3D digital linear acceleration sensor and a 3D digital magnetic sensor
STMicroelectronics MP23ABS1high-performance MEMS audio sensor with single-ended analog bottom-port microphone
You do not need any hardware to build the ML models. Use datasets to sample, analyze, and build your TinyML models. You can also use your mobile phone to run simulated data collections and deployment.
You do not need specific hardware to build the dashboards.Use any hardware you already have, from Arduino to Microchip, Seeed, Adafruit to STMicroelectronics, to send data to the IoTConnect platform.
Final software and hardware will be documented and shared freely under the open source license of opencollar.io. Thank you for participating!
Additional Resources
To help you get started on Machine Learning, Data Analysis and Data Visualizations and IOT we have Microsoft Learn.
Microsoft Azure for Students
No credit card needed Simply verify your student status through your school email address, and you’re ready to go with$100in credit.
Free developer tools
Build your skills in trending tech including data science, artificial intelligence (AI), machine learning, and other areas with access to professional developer tools.
This article is contributed. See the original author and article here.
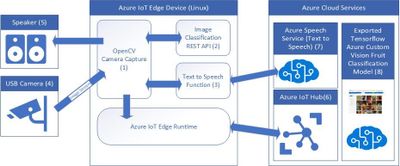
There are lots of applications for image recognition but what I had in mind when developing this application was a solution for vision impaired people scanning fruit and vegetables at a self-service checkout.
This article is contributed. See the original author and article here.
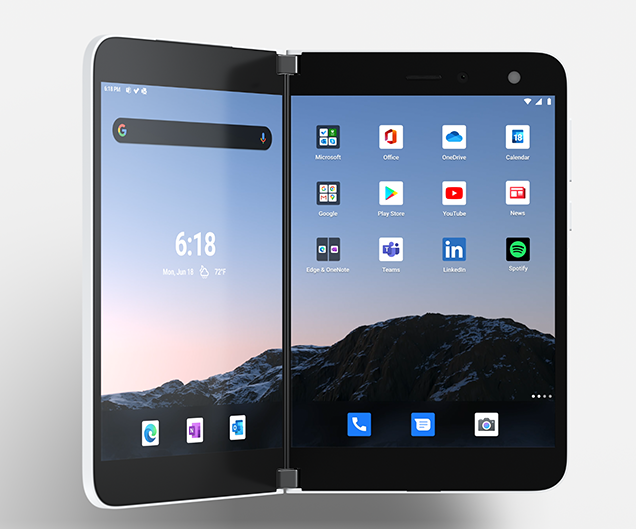
Today we are super pleased to announce another milestone in the Surface journey with the release of a major new form factor.
Unveiled today and shipping September 10, Surface Duo represents the next wave of mobile productivity, inspiring people to rethink what is possible with the device in their pocket. Surface Duo delivers the easiest way to multitask on the go, bringing together the power of Microsoft 365 experiences and the full ecosystem of Android mobile apps. Starting at $1,399, Surface Duo opens into the thinnest mobile device on the market with an 8.1″ PixelSense Fusion display connected by a revolutionary 360-degree hinge, allowing you to use each 5.6″ display individually or together, across a variety of modes. Do more wherever you are with Surface Duo.
Commercial customers can go here to find a commercial reseller for Surface Duo. You can get technical documentation about managing Surface Duo from our newly published site on Microsoft Docs with more content coming soon.
Enterprise-level security from chip to cloud
Surface Duo has protection built in at every layer with deeply integrated hardware, firmware, and software to keep your devices, identities, and data secure. Part of what makes this happen is that we built in our custom engineered Unified Extensible Firmware Interface (UEFI) which enables full control over firmware components. Microsoft delivers Enterprise-grade security to Surface Duo by writing or reviewing every line of firmware code in house, enabling Microsoft to respond directly and agilely, to potential firmware threats and to mitigate supply chain security risks. To learn more, check out the Surface Duo security overview.
Another new capability that also helps raise the bar on productivity is the option of connecting to a full Windows 10 experience in the cloud with Windows Virtual Desktop. To learn more, take a look at Windows Virtual Desktop on Surface.
Simply put, Surface Duo is a perfect fit for the modern workplace.
Stay in control with cloud-based management
You can manage the entire Surface Duo experience for employees and protect work data with a variety of mobile device management (MDM) options, including Microsoft Intune.
We understand how challenging it can be to balance the needs of your end users bringing their own device (BYOD) with enterprise requirements to protect corporate data. Intune app protection helps address this balance by protecting data without requiring users to enroll their device into their company portal. App protection policy settings only take effect when handling corporate data such as using Outlook to send a draft presentation for review. If the same user logs into Outlook with a personal account, the app protection policies have no effect.
Intune lets you manage Google play to distribute line of business and store applications to your non- enrolled devices in the app protection scenario. All this helps make App protection and Android enterprise work profiles the most implemented MDM scenarios. And that’s the reason we designed Surface Duo to be fully optimized for both. You can also manage Surface Duo in highly managed, corporate-owned device scenarios using Full device management or Dedicated device management.


Recent Comments