This article is contributed. See the original author and article here.
Hello Azure Communication Services users!
As we enter 2024, we’d like to take the opportunity to hear what you think of the Azure Communication Services platform. We’d love to hear your insights and feedback on what you think we’re doing well and where you think we have an opportunity to better meet your needs. We’d really appreciate it if you would take 5-7 minutes to complete our survey HERE and share your thoughts with us. We’ll use this information to help guide future development, and to help us focus on the areas that our customers tell us are most important to them.
Please note – This survey is specifically designed for developers who’ve built something (even a demo or sample) with
Azure Communication Services. We will offer additional opportunities for other users to share their feedback as well.
That survey link, again, is HERE. Thanks for your feedback, and here’s to a productive and successful 2024!
This article is contributed. See the original author and article here.
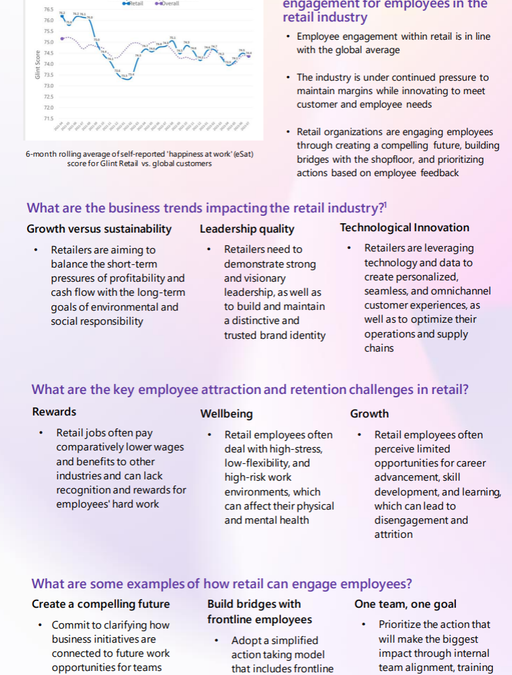
Welcome to the fourth edition of Microsoft Viva People Science industry trends, where the Viva People Science team share learnings from customers across a range of different industries. Drawing on data spanning over 150 countries, 10 million employees, and millions of survey comments, we uncover the unique employee experience challenges and best practices for each industry.
In this blog, @Jamie_Cunningham and I share our insights on the state of employee engagement in the retail industry. You can also access the recording from our recent live webinar, where we discussed this topic in depth.
Let’s first look at what’s impacting the retail industry today. In summary, we are hearing about market volatility, supply chain constraints, changing consumer behavior, technological advancements, labor pressures, and rising costs. According to the Deloitte Retail Trends 2023 report, the top-of-mind issues for retail leaders are:
Growth versus sustainability: Retailers need to balance the short-term pressures of profitability and cash flow with the long-term goals of environmental and social responsibility.
Consumer confidence and retail sales: Retailers need to cope with the uncertain and volatile consumer demand, which is influenced by factors such as inflation, health concerns, and government policies.
Leadership quality and brand strength: Retailers need to demonstrate strong and visionary leadership, as well as to build and maintain a distinctive and trusted brand identity.
Technological innovation: Retailers need to leverage technology and data to create personalized, seamless, and omnichannel customer experiences, as well as to optimize their operations and supply chains.
These issues require retailers to be agile, resilient, and innovative in their employee experience strategies and execution. The retail industry also faces some specific challenges in attracting and retaining talent, such as:
Rewards:Retail jobs often pay comparatively lower wages and benefits to other industries and can lack recognition and rewards for employees’ hard work.
Wellbeing: Retail employees often deal with high-stress, low-flexibility, and high-risk work environments, which can affect their physical and mental health.
Growth: Retail employees often perceive limited opportunities for career advancement, skill development, and learning, which can lead to disengagement and attrition.
According to Glint benchmark data (2023), employee engagement in retail has declined by two points between 2021 and 2022. It’s clear that retailers need to invest in improving the employee experience, especially for the frontline workers, who are the face of the brand and the key to customer loyalty. So, how do they do this? Here are three examples of how retailers we’ve worked with have addressed the needs of their employees with the support of Microsoft Viva:
1. Create a compelling future
We worked with the leadership team of a MENA (Middle East and North Africa) based retailer to recognize that there was a connection between their ability to communicate the future of the direction of the organization effectively, and the degree to which employees saw a future for themselves in the organization. The team committed to clarifying how the business initiatives they were rolling out connected to future work opportunities for their teams.
2.Build bridges with frontline employees
According to the Microsoft Work Trend Report (2022), sixty-three percent of all frontline workers say messages from leadership don’t make it to them. A global fashion brand recognised after several years of employee listening that the actions being taken by leadership were not being felt on the shop floor. We worked with them to adopt a simplified action taking model with one clear commitment from leaders, that was efficient and effective in terms of communication and adoption. They also increased their investment in manager enablement to support better conversations within teams, when results from Viva Glint were released. This simplified approach led to improved perceptions of the listening process, and greater clarity at all levels on where to focus for a positive employee experience.
3.One internal team, one goal
Through an Executive Consultation with leaders of a UK retailer, it was identified that wellbeing was a risk for the business that unless addressed, would severely impact their priorities. With that in mind, the team created internal alignment – to prioritise wellbeing through both training investment and policy changes, resulting in a thirteen-point improvement in the wellbeing score year over year.
Conclusions
To succeed in this dynamic and competitive market, retailers need to focus on their most valuable asset: their employees. By investing in the employee experience, especially for the frontline workers, retailers can boost their employee engagement, customer satisfaction, and business performance.
A downloadable one-page summary is also available with this blog for you to share with your colleagues and leaders.
Leave a comment below to let us know if this resonates with what you are seeing with your employees in this industry.
This article is contributed. See the original author and article here.
Across industries and around the world, field service leaders face any number of challenges in areas including digitalization and modernization of traditionally paper-based processes, rising customer expectations, and employee training and retention. With these challenges top of mind, we have continually invested in Microsoft Dynamics 365 Field Service as a solution to meet the growing requirements of field service management (FSM) operations. That’s why we take great pride in sharing we’re the only vendor positioned as a Leader in the following four IDC MarketScapes:
A Leader in IDC MarketScape: Worldwide Field Service Management Solutions for Oil and Gas 2023-2024 Vendor Assessment (Doc #US50040023, November 2023)
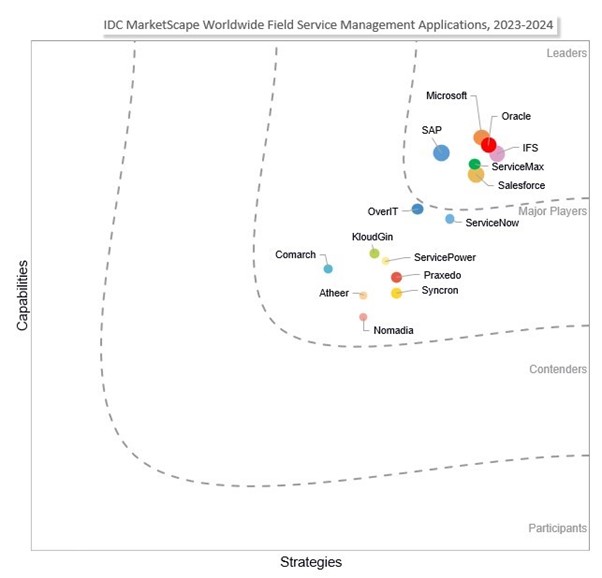
Field service management applications
Source: IDC MarketScape: Worldwide Field Service Management Applications 2023 Vendor Assessment”, Aly Pinder, December 2023 IDC Doc# US49989523.
According to the 2023 report “Product Innovation and Aftermarket Service Survey,” IDC notes that “the top metric prioritized by service leaders as determining success in service was customer satisfaction (46.2%), followed by customer retention (39.0%).” This means frontline worker roles such as service agents and field technicians are absolutely critical to ensuring the best possible customer experience. That’s why we’re continuously developing Dynamics 365 Field Service so that organizations can equip those workers with modern digital tools to make them more responsive and efficient.
Microsoft was positioned as a Leader in the 2023-2024 IDC MarketScape for worldwide field service management applications based on two strengths: “innovation at scale and pace” and “infusion of AI into field service processes.” The IDC MarketScape notes that “Microsoft’s end-to-end service experience capabilities aid field service companies in a continuous transformation journey. As customer expectations evolve, frontline workforces shift, and business models get disrupted, Microsoft leverages its platform to incorporate technologies like the Internet of Things (IoT), mixed reality, industrial metaverse, and digital twins.” In addition, the IDC MarketScape says that in the areas of AI and generative AI, which would include Copilot in Field Service, “Microsoft is enabling service organizations to realize near-term and long-term strategies around this innovative technology.”
The IDC MarketScape suggests that organizations consider Microsoft field service solutions “if they are looking for a vendor that can incorporate end-to-end capabilities with innovative technologies for transformation and growth.”
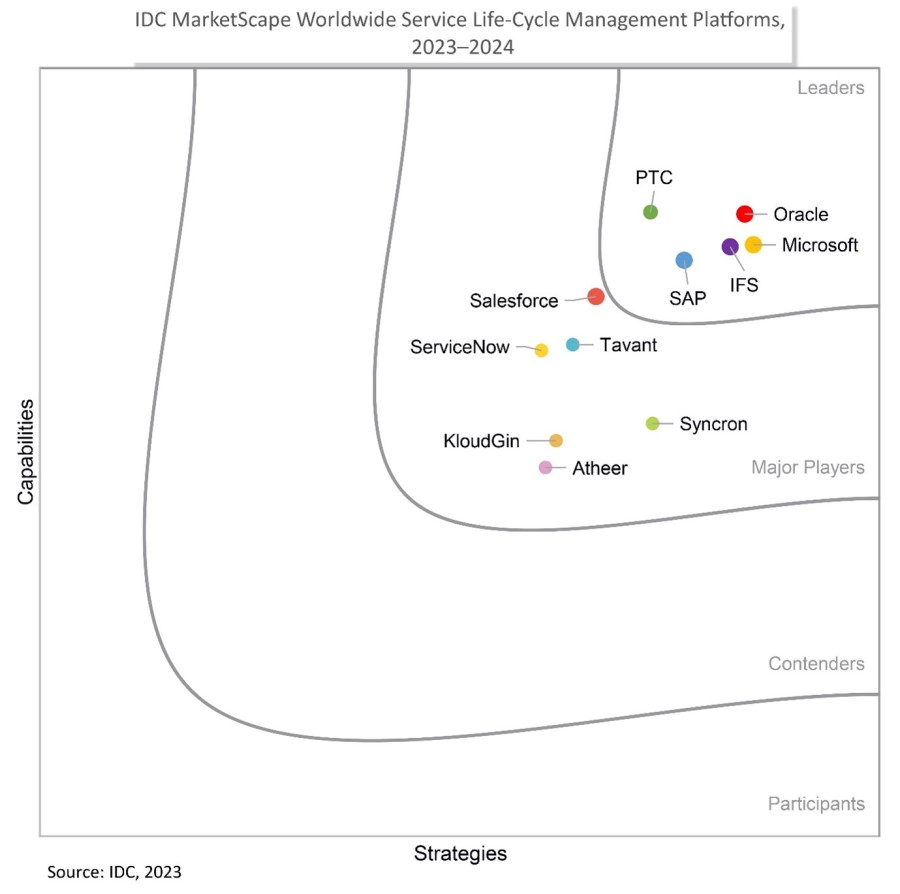
Service life-cycle management
Source: IDC MarketScape: Worldwide Service Life-Cycle Management Platforms 2023–2024 Vendor Assessment, by Aly Pinder, October 2023, IDC Doc# US49989623
IDC has noted that service is no longer something that happens only after a sale is complete. More and more, organizations are aligning services and sales to help drive greater revenue through better alignment and new service offerings. This IDC MarketScape report highlights two key Microsoft strengths: an integrated platform supporting the front and back office, and innovation accelerators that enhance experiences.
From an integration standpoint, the IDC MarketScape notes that “the service team can no longer operate in a silo and requires tools that allow it to connect to other business functions, customers, and the wide network of partners. Microsoft’s integrated platform of back-office, midoffice, and front-office applications aids customers across their digital journey and not just within a single function.” The integration of Dynamics 365 Field Service with Microsoft 365 and Microsoft Teams is key. Dynamics 365 Field Service integrates with Outlook, Teams, and Microsoft Viva Connections so that frontline workers and managers can create, view, and manage work orders within Outlook and Teams. This integration enhances collaboration between dispatchers, frontline technicians, and managers by enabling work order data to sync automatically between Dynamics 365 and Microsoft 365. Additionally, frontline technicians can quickly start their day with access to key workday information at a glance, with work orders visible from the Viva Connections homepage in Teams. Dynamics 365 and Microsoft 365 empower technicians with the right information to resolve issues the first time, which is key to creating a positive customer experience.
When it comes to innovation, the IDC MarketScape explains, “Microsoft through its AI, GenAI, IoT, and mixed reality capabilities and tools allows service organizations to deliver enhanced experiences for the service team and the customer. Microsoft customers value this level of shared innovations, which has cemented partnerships for shared growth.” Dynamics 365 Field Service can be integrated with Microsoft Dynamics 365 Remote Assist on Microsoft HoloLens, Microsoft HoloLens 2, Android, or iOS devices to enable technicians to collaborate more efficiently by working together from different locations. This means service technicians can find and connect with technical experts working at other locations to share what they’re seeing, receive remote assistance, and quickly resolve customer issues. Dynamics 365 Field Service can also be integrated with Microsoft Dynamics 365 Guides to attach mixed reality guides to Field Service tasks. Overall, the integration between Dynamics 365 Field Service, Dynamics 365 Remote Assist, Dynamics 365 Guides, and tools like HoloLens helps to elevate field service operations by enabling them to optimize processes and deliver unparalleled customer experiences.
The IDC Life-Cycle Management report suggests organizations “consider Microsoft when searching for capabilities that will enable continuous exploration of innovation across the service life cycle and partner networks. Microsoft has enabled a broad set of innovation capabilities, which support collaboration, co-innovation, and prescriptive service at speed and a global scale.”
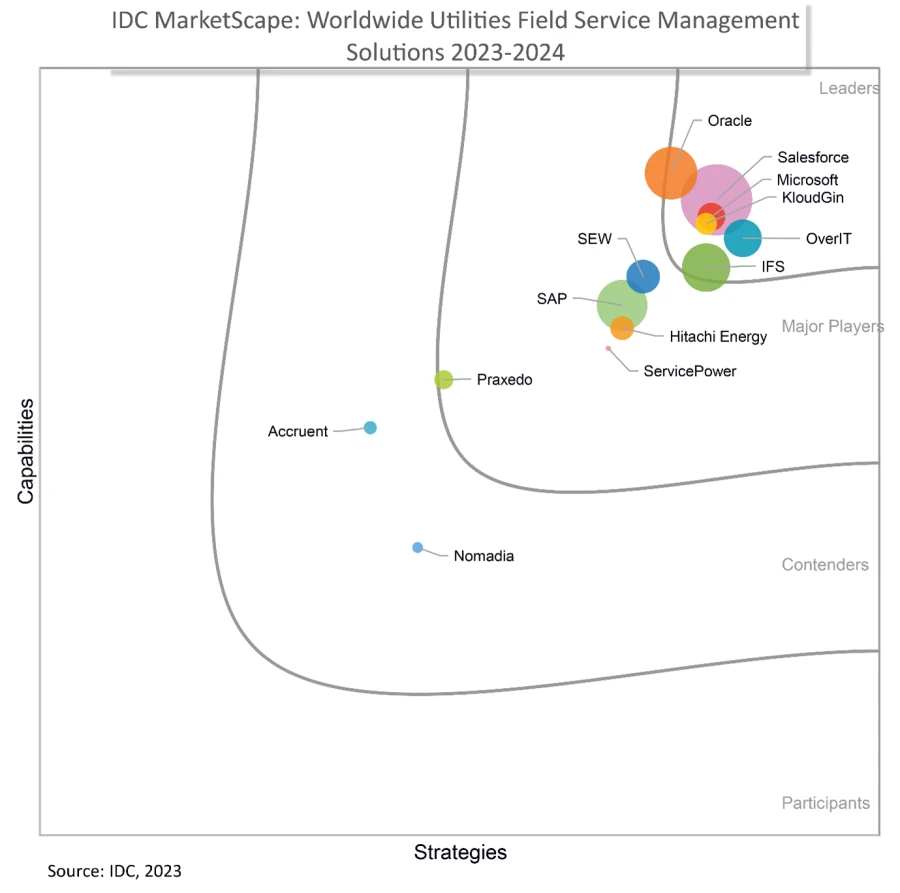
Field service management for utilities
Source: IDC MarketScape: Worldwide Field Service Management Solutions for Utilities 2023-2024 Vendor Assessment, By: Jean-François Segalotto, John Villali and Daniele Arenga, November 2023, IDC Doc #US50036223
For customers in the utilities industry, the IDC MarketScape explains that a key strength for Microsoft is that “[customers] recognize Dynamics 365 Field Service as a well-engineered, flexible FSM solution, offering a solid user experience in terms of usability, configurability, ease of integration into complex landscapes, and extensibility thanks to the Microsoft portfolio.”
The IDC MarketScape also notes, “Microsoft is putting considerable resources behind the product, including significantly increasing the engineering budget this year.” It also states that “[the] ability to instantly access this innovation through a pure-play SaaS ultimately results in good value for money.” Many Field Service customers experienced this with the addition of the Copilot in Dynamics 365 Field Service Outlook add-in, which streamlines work order creation with relevant details pre-populated from emails and optimizes technician scheduling with data-driven recommendations based on factors such as travel time, availability, and skillset. Frontline managers can see relevant work orders and review them before creating new work orders, and they can easily reschedule or update those work orders as customers’ needs change.
Field service management for oil and gas
For customers in the oil and gas (O&G) industry, the IDC MarketScape stated, “Microsoft’s FSM solution comes in an integrated and comprehensive portfolio catering to core O&G field services and asset operations. By seamlessly integrating FSM with Mixed Reality, Microsoft 365, AI, IoT, and Azure, it provides customers the flexibility to tailor solutions, enhancing efficiency, driving innovation, and boosting productivity in a highly customizable manner.”
“Drawing on its long-established customer base, Microsoft works with major O&G players addressing a wide range of field service challenges. Typically, these collaborations focus on enabling frontline workers and optimizing planning and service workflow automation in vast scale operations spanning large assets such as refineries, petrochemical plants, LNG facilities, renewable gas plants, and the extensive network of gas stations.” For service technicians on the frontline, a primary benefit of Dynamics 365 Field Service is the Field Service mobile app which enables technicians to see their workdays at a glance so they can view and update work orders, customer assets, accounts, and more, no matter where they are working—even in areas with limited connectivity. Technicians can also easily access up-to-date inventory information, eliminating the need for cumbersome manual inventory checks and reducing delays caused by missing parts. The Field Service mobile app also incorporates safety checklists and real-time reporting, helping to ensure compliance with safety regulations and to improve the well-being of service technicians who often work under hazardous conditions.
We invite you to read the following IDC MarketScape report excerpts for full details:
Source: IDC MarketScape vendor analysis model is designed to provide an overview of the competitive fitness of ICT suppliers in a given market. The research methodology utilizes a rigorous scoring methodology based on both qualitative and quantitative criteria that results in a single graphical illustration of each vendor’s position within a given market. The Capabilities score measures vendor product, go-to-market and business execution in the short-term. The Strategy score measures alignment of vendor strategies with customer requirements in a 3-5-year timeframe. Vendor market share is represented by the size of the circles.
This article is contributed. See the original author and article here.
Practice mode is now available in Forms. It’s tailored for EDU users, particularly students, offering a new way for students to review, test, and reinforce their knowledge. Follow me, let’s check out more details of practice mode. You can just try it from this template. (Note: Practice mode is only available for quizzes. )
Practice mode
Instant feedback after answering each question In practice mode, questions will be shown one at a time. Students will receive immediate feedback after submitting each question, indicating whether their answer is right or wrong.
Instant feedback after answering each question
Try multiple times for the correct answer Students can reconsider and try a question multiple times if they answer it incorrectly, facilitating immediate re-learning, and consequently strengthening their grasp of certain knowledge.
Try multiple times to get the correct answer
Encouragement and autonomy during practice Students will receive an encouraging message after answering a question, whether their answer is correct or not, giving them a positive practice experience. And They have the freedom to learn at their own pace. If they answer a question incorrectly, they can choose to retry, view the correct answer, or skip this question.
Encouragement message and other options
Recap questions After completing the practice, students can review all the questions along with the correct answers, offering a comprehensive overview to assess their overall performance.
Recap questions
Enter practice mode Practice mode is only available for quizzes. You can turn it on from the “…” icon in the upper-right corner. Once you distribute the quiz recipients will automatically enter practice mode. Try out practice mode from this template now!
This article is contributed. See the original author and article here.
During the 1st quarter of 2024, D365 Sales conversation intelligence data will migrate from its current storage location (Microsoft provided storage) across to each customer’s Dataverse organization. This blog post describes this change and provides answers to questions raised by admins when preparing their organizations for this data migration.
Sales conversation intelligence data is the general term for any outcome of the processing of phone calls made through the embedded Teams dialer within Dynamics 365. This includes files, such as the audio recording file or transcript file, as well as all the insights collected during a call. Examples include:
Sentiment
Tracked keywords
Asked questions
Summary suggestions
Important: during the migration, no data will be transferred outside of your tenant.
Moving the data into Dataverse allows you to meet the highest data management standards, such as data encryption using Customer Managed Key (CMK) – and management of customer data using Lockbox.
The migration also allows for granular control over the conversation intelligence data: orgs can now allow access to specific types of data only for specific security roles. For example, the admin can assign privileges to the ‘sentiment’ entity in Dataverse only for sales managers. This granular control also allows for deletion of specific types of data while retaining others. For example, the admin can store sentiment data for only 1 month, while storing the transcript of the call for 1 year, and by this maximizing the Dataverse storage capacity.
Having conversation intelligence stored in Dataverse also allows organizations and 3rd party apps to consume the data per the organization’s needs. For example, organizations can create tailored dashboards and visualizations based on the data. Furthermore, the admin can allow third-party apps to access the conversation intelligence data and to provide extensible services based on it.
Storage location by type
The following table describes the storage location of conversation intelligence data before and after the change:
Current storage
Type of data
Before the change
After the migration
Microsoft provided storage
Files (recording, transcript)
Microsoft provided storage
Organization’s Dataverse1
Conversation intelligence insights
Microsoft provided storage
Organization’s Dataverse1
Your own Azure blob storage
Files (recording, transcript)
Your own Azure blob storage
Your own Azure blob storage2
Conversation intelligence insights
Microsoft provided storage
Organization’s Dataverse1
1 After the data is successfully migrated, it will be deleted from the Microsoft-provided storage.
2 No change. This data is not migrated.
After the successful migration of existing data, data from new calls will be automatically saved to Dataverse.
Action required by admins:
For all organizations:
Check the solution version (mandatory): Make sure you have the latest version of the conversation intelligence solution (msdyn_Conversation_Intelligence version 9.0.1.1139 or higher) installed in your organization.
Provide access to new Dataverse entities (mandatory): Make sure the relevant security roles have read and write privileges to the new Dataverse entities (see below a list of entities).
Make sure you have sufficient storage space in Dataverse (mandatory):
Database storage: Multiply the number of calls by 160KB.
File storage (only relevant for orgs previously using Microsoft provided storage): Multiply the number of calls by 0.93MB.
For example: if you had 20,000 calls, and you previously used the Microsoft provided storage, you will need to have 32GB of DB storage and 18.6GB of file storage for the migrated data.
Note: The above numbers are based on average call duration and number of insights per call. Actual sizes may vary.
Set a retention policy (optional): Previously, conversation intelligence data was automatically deleted according to the retention policy set by the admin in the conversation intelligence settings. By default, data saved into Dataverse does not have an automatic retention policy like this. If you wish to set a retention policy for your conversation intelligence data in Dataverse, you can do so by following this documentation.
For organizations currently using own Azure blob storage:
Set up Service principal (mandatory): To allow conversation intelligence access to your blob storage in a more secure way. See this article to learn more on this setup.
Opting out of migrating the existing data into Dataverse
By default, your existing data will be migrated to Dataverse. If you wish to opt out of the migration, (because your organization is no longer using conversation intelligence or you don’t want to migrate the existing files or insights for example), you will need to send an email, containing your first and last name and the organization ID to this email address: CI-data-migration@microsoft.com before January 31st 2024. The data of organizations which opted-out of the migration will be permanently deleted by April 1st 2024.
Frequently asked questions
Here are some answers for questions you might have on this process:
What will happen to my organization’s saved data? The data will be transferred from where it is stored today (Microsoft provided storage) to your organization’s Dataverse database. After verifying the transfer and customer confirmation, the data will be permanently deleted from the previous storage location (data will not be automatically deleted from your Azure blob storage). Note that data older than 90 days will not be migrated.
What type of Dataverse storage will be used? Conversation intelligence uses 2 types of Dataverse storage: File storage will be used for storing the recording and transcript files (unless stored in your org’s Azure blob storage), while DB storage will be used for storing the conversation intelligence insights.
What are the expected implications of moving the data into Dataverse?
Migrating data into your Dataverse will require free Dataverse storage space. See above on how to calculate the required storage space.
Who will have access to the transferred data?
Out-of-the-box security roles (such as Salesperson and Sales Manager) will automatically receive privileges to the new entities where the data is stored. If your org uses custom security roles, make sure you assign them with the required privileges for the new Dataverse tables as listed below. You can do this prior to the migration of the data. List of new Dataverse entities:
Conversation Action item
Conversation Aggregated Insights
Conversation Comment
Conversation Participant Insights
Conversation Participant Sentiment
Conversation Question
Conversation Segment Sentiment
Conversation Sentiment
Conversation Signal
Conversation Subject
Conversation Summary Suggestion
Conversation System Tag
Conversation Tag
Ocrecording
Recording
SCI Conversation
Sci Environment Settings
Sci User Settings
Transcript
Will users in my organization be able to continue using the conversation intelligence app?
Once the data is migrated into Dataverse, the conversation intelligence app will no longer work. The aggregated conversation intelligence data will be available through a new Power BI based dashboard.
How to opt-out of moving my organization’s existing data into Dataverse? You can opt-out of moving the existing data by sending an email to: CI-data-migration@microsoft.com before January 31st 2024. If you chose to do so, the existing data of your organization which is currently saved in the Microsoft-provided storage will be permanently deleted by April 1st 2024.
What’s next? If you don’t choose to opt-out, your organization’s conversation intelligence data will be transferred to Dataverse between February 1st 2024 and March 30th 2024. You will receive an email with a confirmation of successful data migration. After the moves to Dataverse, all new conversation intelligence data will be saved to Dataverse as well.
This article is contributed. See the original author and article here.
Frontline managers have gained greater control, on a team-level, over the capabilities offered in Microsoft Shifts.
With the latest releases now available on the Shifts settings page, we have made updates to improve the end-user experience for frontline manager and workers. The updates are as follows:
Open shifts
Previously, when the Open Shifts setting was off, frontline managers could create but not publish open shifts. Also, they could view open and assigned shifts listed on their team’s schedule (including when workers are scheduled for time off).
Now, when the setting is turned off, frontline managers can’t create open shifts and can only view on their team’s schedule the assigned shifts (including scheduled time off).
See the differences from the past and new experience for frontline managers:
Time-off requests
Previously, when the time-off request setting was turned off, frontline managers couldn’t assign time off to their team members; more over, frontline workers couldn’t request time-off.
Now, when the setting is turned off, frontline managers can continue to assign time off to their team members. However, frontline workers will not have the ability to create time-off requests if this setting remains off.
Your organization can leverage Shifts as the place where the frontline may view their working and non-working schedules despite not using Shifts as your leave management tool.
See the new experience for frontline managers:
Open shifts, swap shifts, offer shifts and time-Off requests
Previously, when any of the request-related setting toggled between on to off, frontline managers couldn’t manage previous requests that were submitted when the setting was on.
Now, frontline managers can directly manage previous requests on the Requests page while frontline workers can view status and details of their individual requests.


.gif")

Recent Comments