Process Advisor for Supply Chain and Warehousing.

Process Advisor for Supply Chain and Warehousing.

This article is contributed. See the original author and article here.

Editor: Denis Conway

Who should use it, why and for what?

Introduction

Performance evaluation has been revolutionized by technology, extending its reach to the individual level. Consider health apps on your smartphone. They gather data breadcrumbs from your daily activities, providing analysis of your movement patterns. This isn’t a generic data compilation, but a near-accurate reflection of your physical activity during a specific period.

In the future, it’s conceivable that these apps might be equipped with an AI companion, or Copilot, to guide your next steps based on your past activities. It could suggest rest days or additional exercise to help you achieve your personal health goals.

This concept of performance evaluation based on collected data is the bedrock of process mining and process comparison. Our Copilot functionality adds a layer of assistance, enabling you to make informed decisions about your warehouse operations.

In this context, Copilot can help you optimize warehouse processes. It can identify bottlenecks in certain processes or compare different methods to achieve the same goal, empowering you to choose the most optimal method for your specific case.

In this blog, we’ll explore the essence of this feature, its intended audience, and how and why you should leverage it for your warehousing operations.

Process Mining Insights:

At first glance, using Process Advisor for material movement analysis is easy. The setup process is straightforward:

  1. Go to Warehouse Management > Setup > Process Mining > Warehouse material movement configuration. In the taskbar, select Deploy New Process.
  2. The configuration Wizard will open. Press Next, then enter the name of the process in the field Process Name, choose company, choose number of months to load (12 months = data from latest 12 months) and choose the appropriate Activity.  Press Next.
  3. Process is deployed.

The configuration wizard looks like this:

graphical user interface, text, application, Word
Image: Configuration wizard screenshot.

The easy part is now complete. We have set up a process, named it, and loaded 12 months of data to prepare for our analysis. The difficult part is making sense of our data and using it to make decisions to improve our warehouse output.

Therefore, we will provide you with some real-life examples on how to use the data analysis functionality to understand your processes, and a scenario where we evaluate two different methods and use the Process Advisor to figure out which method would be preferred for our business operations.

Analysis of data

There are multiple ways to analyze your process data to understand and compare your processes.

  1. Start with opening Power Automate and go to the tab Process Mining. The report is accessible on the main page.
  2. Report: When the report is loaded, it can look like this:
graphical user interface
Image: Process Mining Case Summary.

3. Select Map

Select the Map tab to display the process map:

Process Mining
Image: Process Mining Map.

This is a screenshot of the process map from our example. On the Map, there are separate locations on which actions(tasks) have taken place, as well as the time spent on this location and between locations. You can change the time unit to, let’s say mean duration, to see how long each activity in a particular location takes per average.  

4. Use the Co-Pilot to get started.

We provide you with suggestions for frequent prompts, but you can of course choose to enter whatever you want. In this case, we will use the suggested “provide the top insights” prompt.  
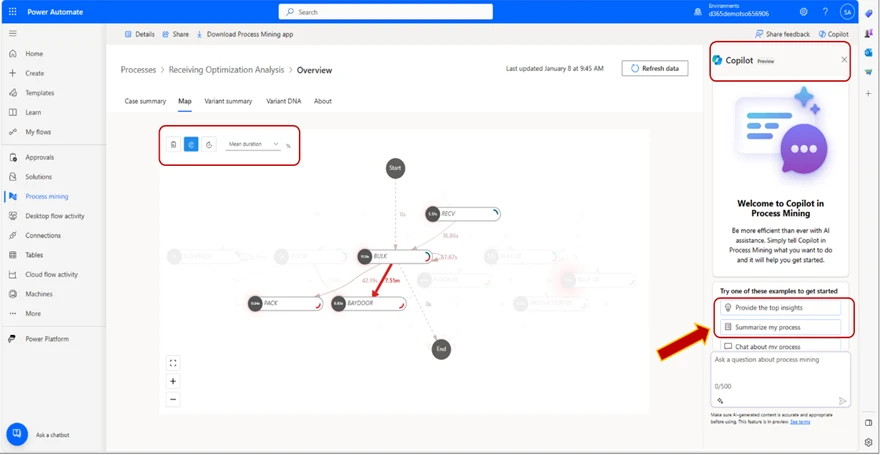
graphical user interface, application, Teams
Image: Process Mining map with Copilot.

5. Copilot Generates

The Copilot generates a response based on the data in your process map. In the example, we can see that the Copilot has found the “BULK” as the longest running activity, and provided us with a list of the activities with the greatest number of repetitions:
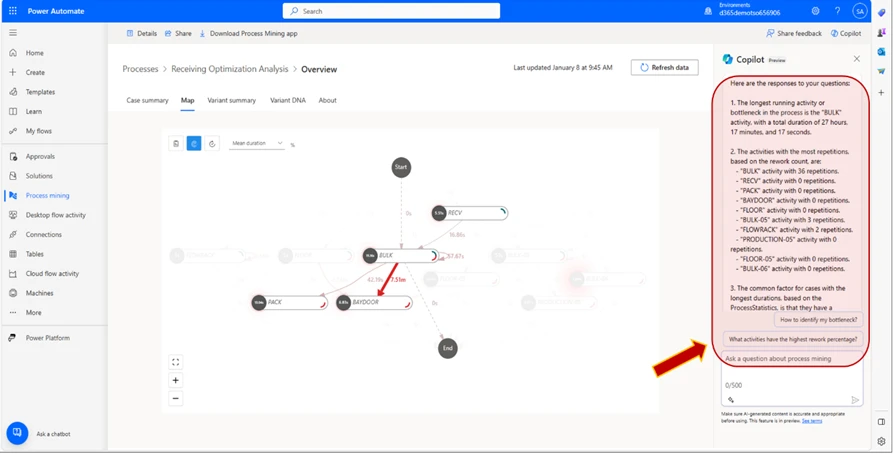
graphical user interface, application, Teams
Image: Process Mining map and Copilot generated answer.

6. Copilot Follow Up

We can also ask the Co-pilot follow-up questions. In this case, we will follow-up with the suggested “How to identify my bottleneck?” and “Find my Bottleneck” prompts. The Co-pilot generates a message explaining what the bottleneck is and its mean duration. In this instance, since we have selected the metric Mean duration, we will generate an answer reflecting this metric.
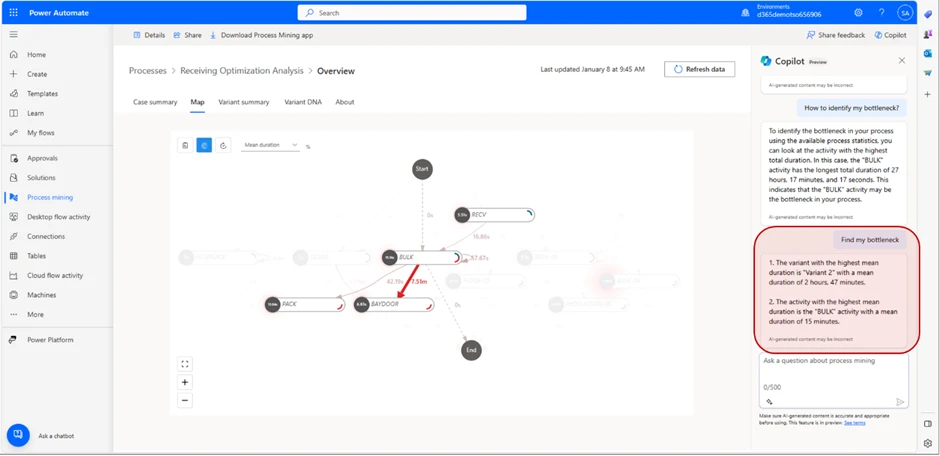
graphical user interface, application, Teams
Image: Process Mining map with Copilot generated answer.

The message we receive tells us that the Variant with the highest duration is “Variant 2” with a mean duration of 2 minutes and 47 seconds.
It also tells us that the activity with the highest mean duration is “BULK” with a mean duration of 15 minutes.

From this, we can draw the conclusion that “Variant 2” is the variant that takes the longest time to complete, and that the most amount of time is spent in the “BULK” location.

By using the process advisor for warehouse movement material analysis, we can streamline warehouse operations and ensure we don’t spend more time than we need on a particular task or operation.
Another example where the Process Advisor can be utilized to enhance operational fluidity in your warehouse is by comparing different methods of achieving a similar goal, to understand which method is more effective to reach your desired goal. We will try to explain how to conduct such a comparison to with a test-case.

In our test-case, we will compare two different methods of picking goods in the Warehouse to figure out which picking method takes less time, so we can increase the Warehouse output.

Test Case : “Single order picking” vs “Cluster picking”

In this test-case, the user wants to know which method of picking is faster, “Single order picking” vs “Cluster picking”. To compare the two, the user goes through the following steps. First, the user creates a Hypothesis for the purpose of this test-case. In this case, the user wants to determine which picking method is faster.

Secondly, the user decides the scope of the test. For both methods, the user will have 5 sales orders with one to five different items per order, in different quantities. Both methods will use identical sales orders for test purposes.
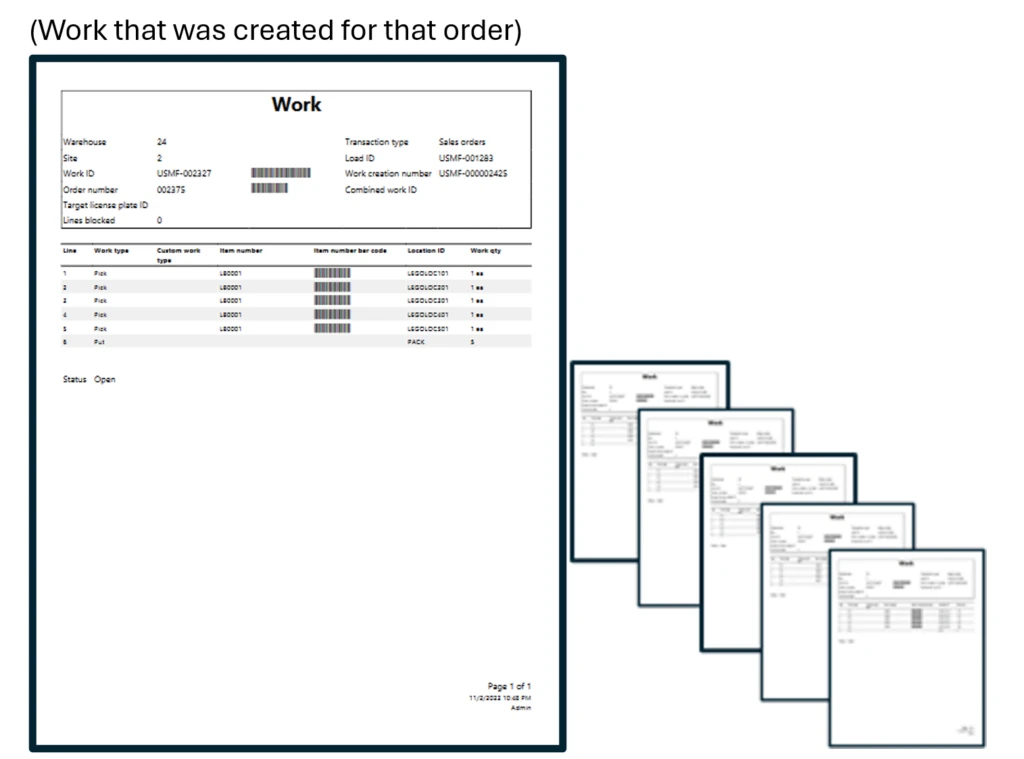
In the Work Details screen, we can see the work details for the work that has been created.
The Variants are the different Variants of work, so in this instance, for work ID USMF-002327 with Order number 002375 (displayed in the picture) the worker will “Pick” 1 piece of item LB0001 in 5 different variations (in this case colors), then “Put” these 5 items away in packing area (location “PACK”).
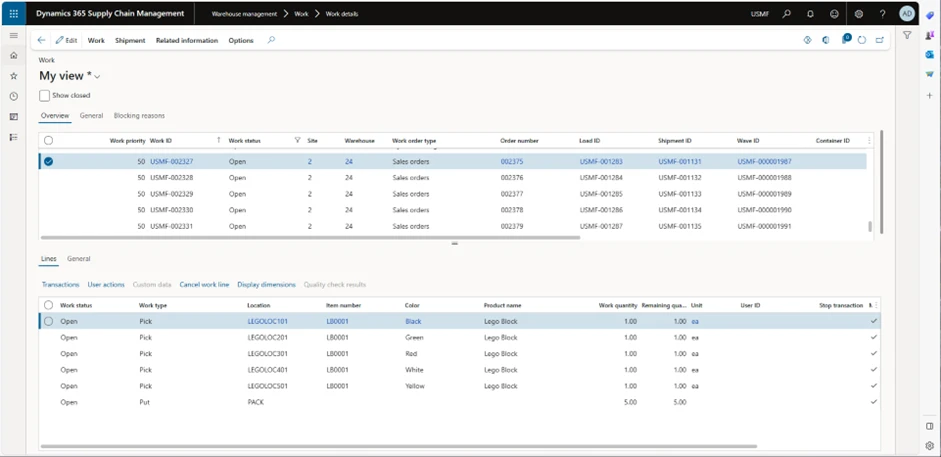
table
Image: Work details screenshot.
diagram
Image: Work details label(s).

With the “Single order picking” method, the worker picks one order at a time and puts it in the packing location. To clarify, the warehouse worker will go to each location where the item is located, pick and scan that item, repeat the process for each item in that order, take the order to pack location and then repeat with next order. 

Worker goes to 5 different locations to pick items, then proceeds to “PACK” location to put items away for packing. Then, the worker repeats the process for the other orders.
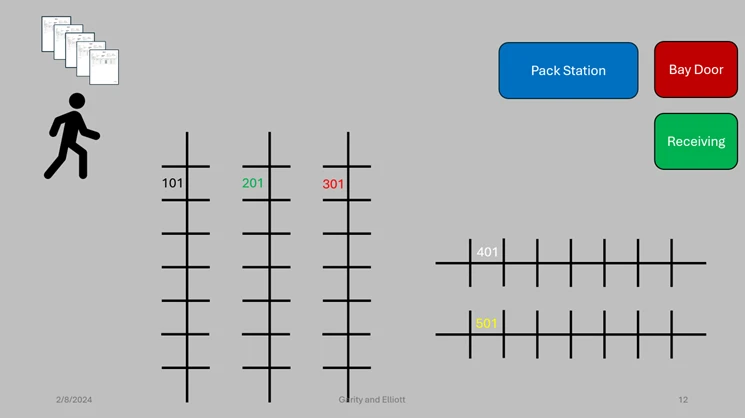
chart, box and whisker chart
Image: Picking locations

After we have constructed our hypothesis and determined the scope, we can go ahead and prepare for the analysis.

First, we will have to deploy our process comparison. We head into Warehouse Management > Setup > Process Mining > Warehouse material process configuration, and in the taskbar, we select Deploy New Process. We select a fitting description as the Process Name, select company and number of months to load. In this test case, we will only be loading one month of data since we don’t need more for this test’s purposes.

Usually, you would want as much correct data(not corrupted/faulty data since this will affect the analysis) and necessary (scope needs to determine how much and what is necessary) data as possible to get a high-quality analysis.  
When our process has been deployed, we can move on to the analysis and evaluate this process.

We load our process map into Power Automate, and in the beginning, it will look something like this:
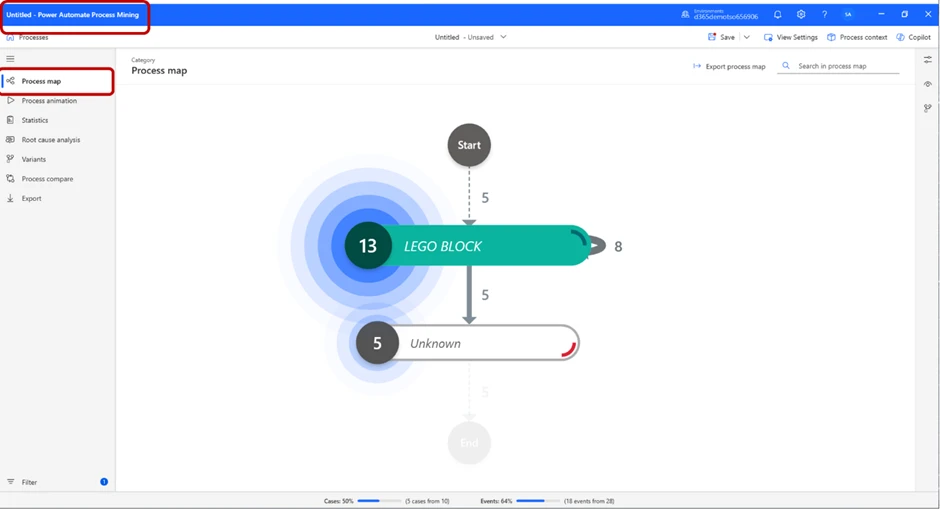
Image: Process Map Starting view.

We can press the Play Animation button to get a representation of the process.
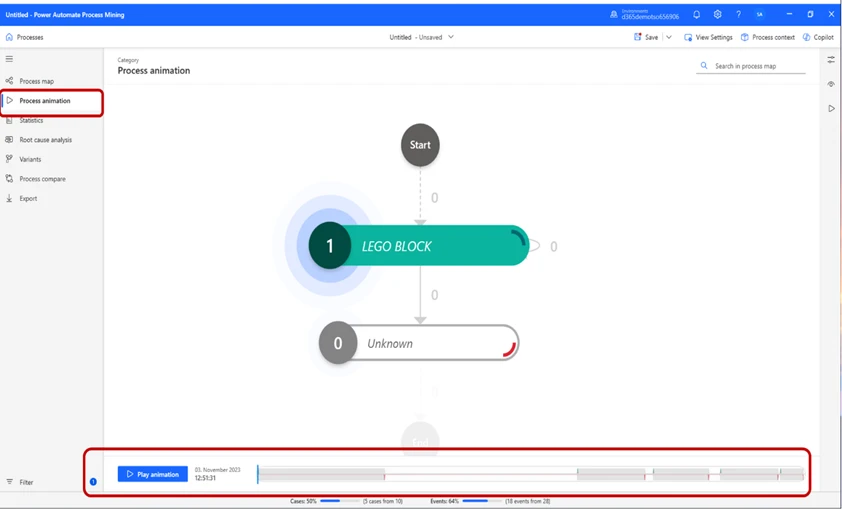
graphical user interface, application
Image: Process Map Starting view.

In the Statistics tab, we can see basic information of the process.
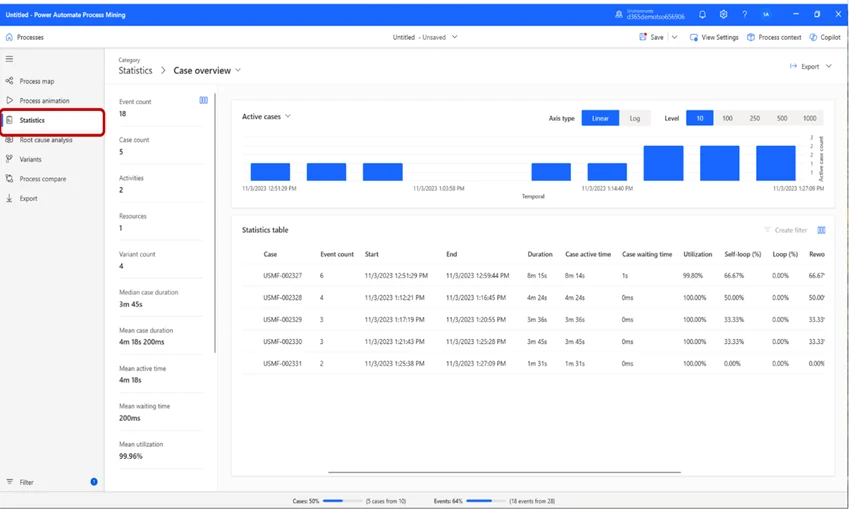
graphical user interface, application
Image: Process mining statistics tab overview.

In the Variants tab, we can view the different work-Variants. By selecting one, we can get an in-depth view of, in this case, “Variant 3”. We can see that in this variant, 6 cases occurred, the total duration was 8 minutes and 15 seconds, and the total active time was 8 minutes and 14 seconds.
In this case, the attribute selected is Zone. If we look closely at the Variants, we can see that “Variant 2” has 2 cases and the others have 1.

This means that two pieces of “work” that was scheduled were so similar that they could be grouped. This is because, from a warehouse management perspective, the operation is identical. This is because the worker goes to one location, picks item(s) 1, goes to another location and picks item(s) 2, then put them away in “PACK”. Thus, it is two “Pick” operations and one “Put”, and therefore they will be grouped in this view.    
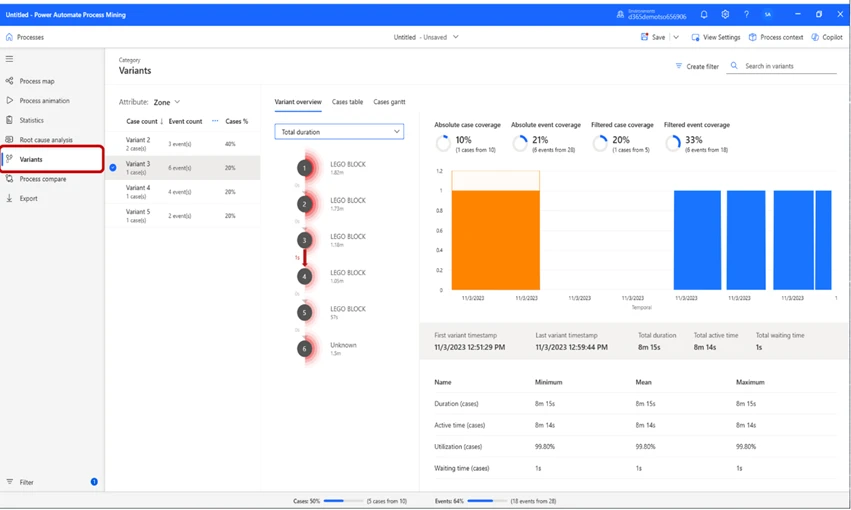
graphical user interface, application
Image: Process mining variants tab zone overview.

We can also change the Variants’ view by changing the Attribute selected. In this case, we will change the attribute from Zone to Order number. This will change our view, so that we see different Variants based on work type. It will in this case show us 5 variants, which at first can seem confusing. A new variant is displayed with these settings, since this now displays Variants by order number instead of zone, which means that we get one variant for each Sales order we created, since all of them were different from each other. 
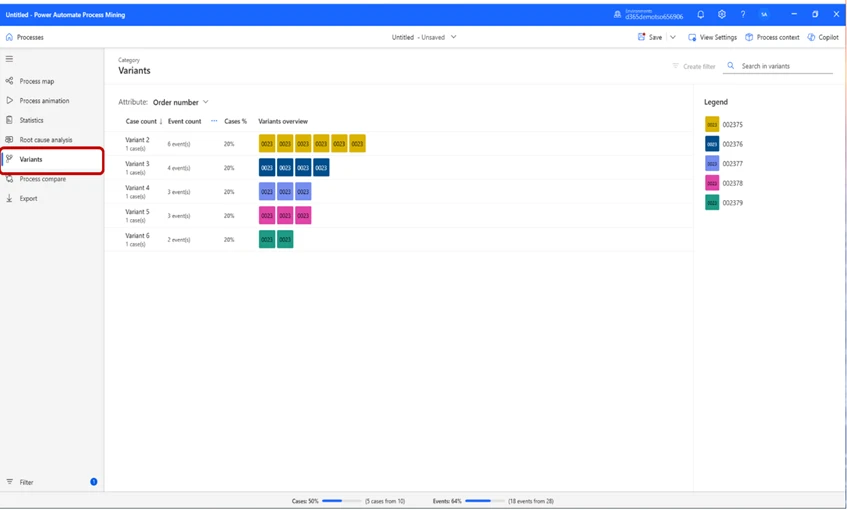
graphical user interface, application
Image: Process mining variants tab order number overview.

In this instance, we can see the order numbers in the legend on the right side. This view tells us that we have 5 different order numbers, and the boxes below Variants Overview represents the number of work operations performed per Order Number. The Case Count per order number, in the case of “Variant 2” there has been a total of 6 operations performed (pick, pick, pick, pick, pick, put, as mentioned previously) and in the case of Variant 4 and 5, there has been a total of 3 case count (Pick, Pick, Put).

For this scenario, it can be helpful to see how much work we are performing per event. If we want a view where we can see how much work we do per event, we can switch Attribute to Work Quantity. This will in this instance allow us to see the quantity of work that needs to be performed for each event. In the example of “Variant 2” the interface tells us that 6 events have taken place, in 5 of the events quantity has been 1, and in one of the events quantities was 5. To put this into a warehouse perspective, this means that we have performed 5 of the events 1 time each, which for Variant 2 is “Pick item 1, Pick item 2, Pick item 3, Pick item 4, Pick item 5” and one event where we “Put” away these items 5 times.
That single operation is performed 5 times and counts as one event because it is the same event occurring multiple times, whilst the other event, even though they are all “Pick” events, will count as individual events due to picking different products, which are all in different locations. When we “Put” away in “PACK” location, we don’t put the items in different locations, thus it counts as one event.
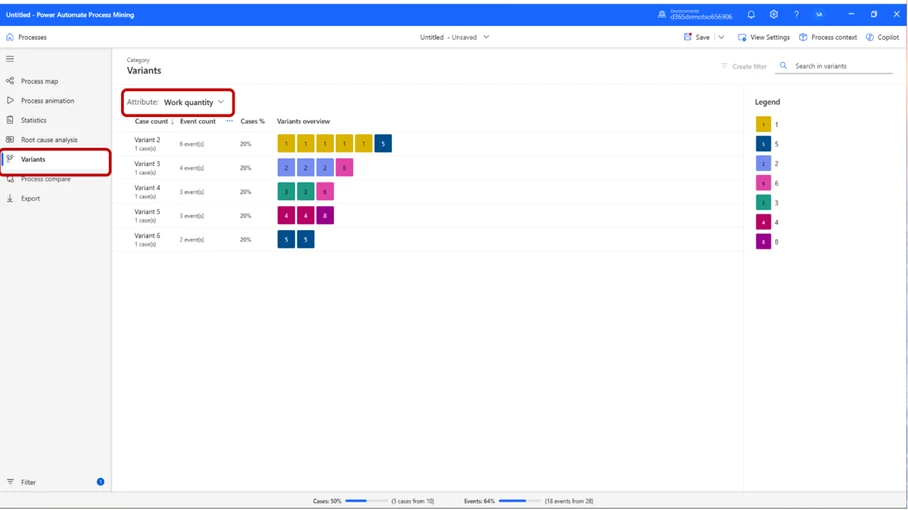
chart
Image: Process mining variants tab work quantity overview.

If we select Attribute by Work type, this becomes clear:
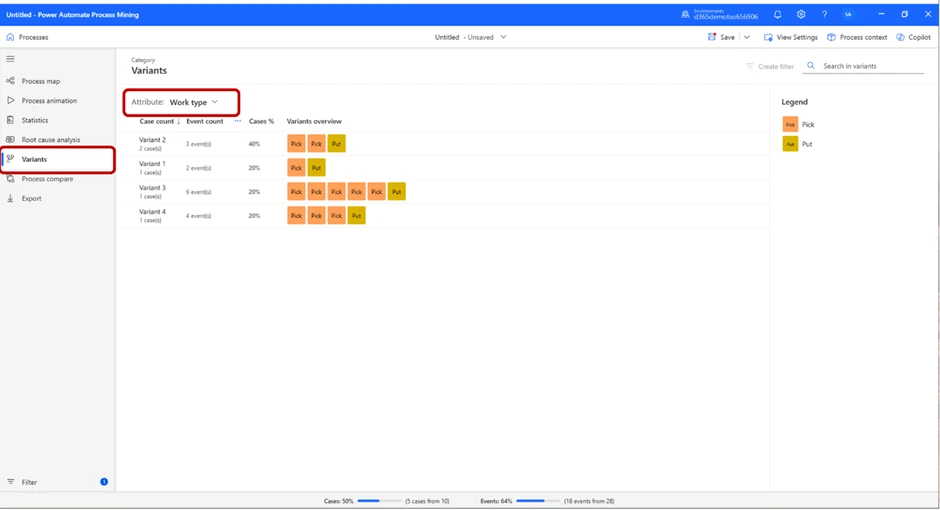
chart
Image: Process mining variants tab work type overview.

We might want to see the location where the events took place. To do that, we can set Attribute to Location, and the view will show us the locations of the events below the header Variants overview.
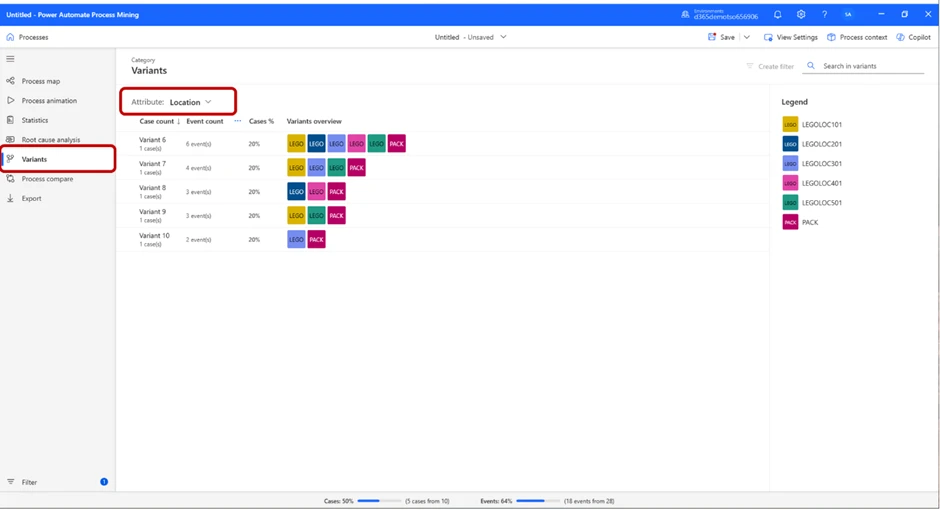
graphical user interface, application
Image: Process mining variants tab work location overview.

In this image, we can see the variants based on location. To put this into context, “Variant 6” tells us 6 events have taken place, all in different parts of the warehouse. For “Variant 10”, we can see that one event took place in “LEGOLOC301” and one in “PACK”.

Now, after we have made ourselves comfortable within the report, we can start analyzing our process. To do that, press the Process Compare button below Variants.

A view similar to this one will appear:
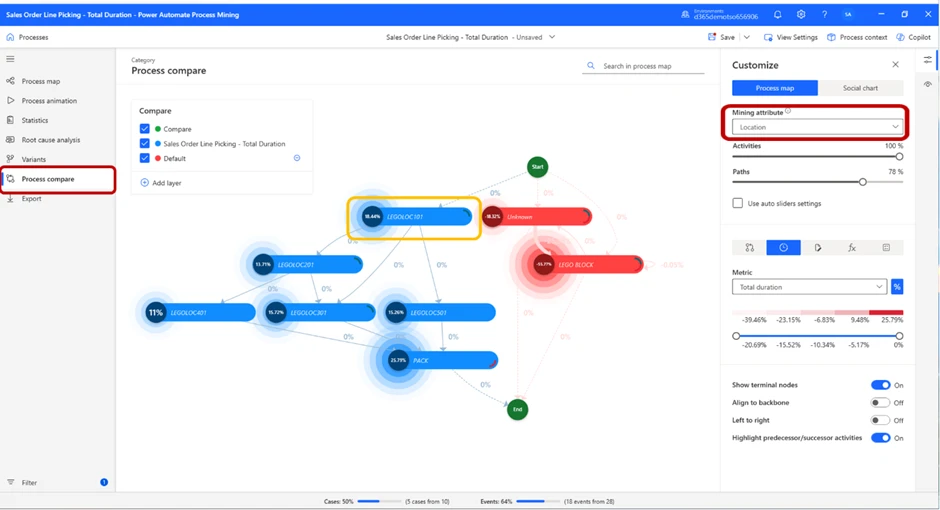
Image: Process compare variants tab location map overview.

In the process map displayed on the screen, we have set the Mining attribute to Location, and the Metric to Total duration. This will allow us to see the total amount of time spent in each location.

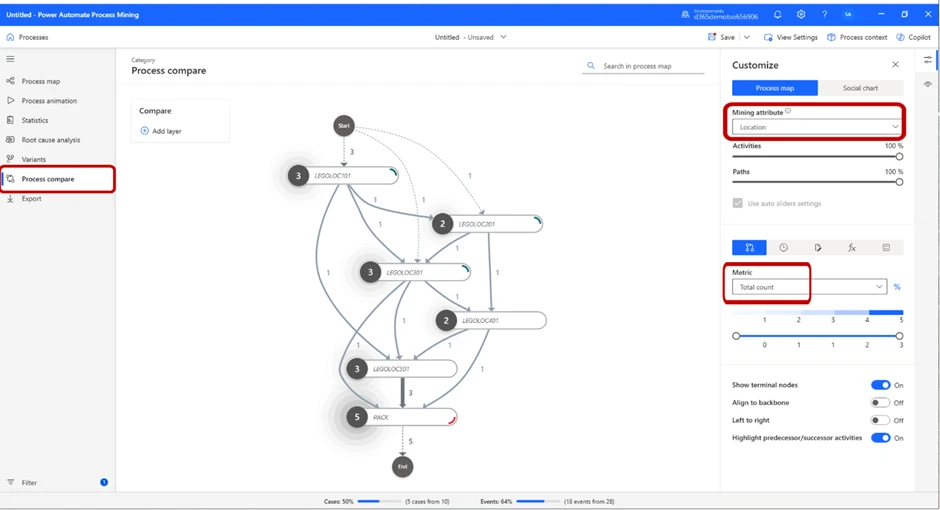
By changing the Metric to Total count, we can see the number of times an event took place in each location, as the picture below displays:
diagram
Image: Process compare variants tab location map overview.

The total amount of time spent in one location and number of cases per location might be valuable, but a more telling metric could be how much time we spent on average per location.

By switching metric to mean duration, we can see the average time spent per location. This gives us yet another hint on which part of the process takes the most amount of time to manage. But, if we want to see how it looks from a proportional perspective, by toggling the percentage sign next to the Metric drop-down menu, we will achieve exactly that.
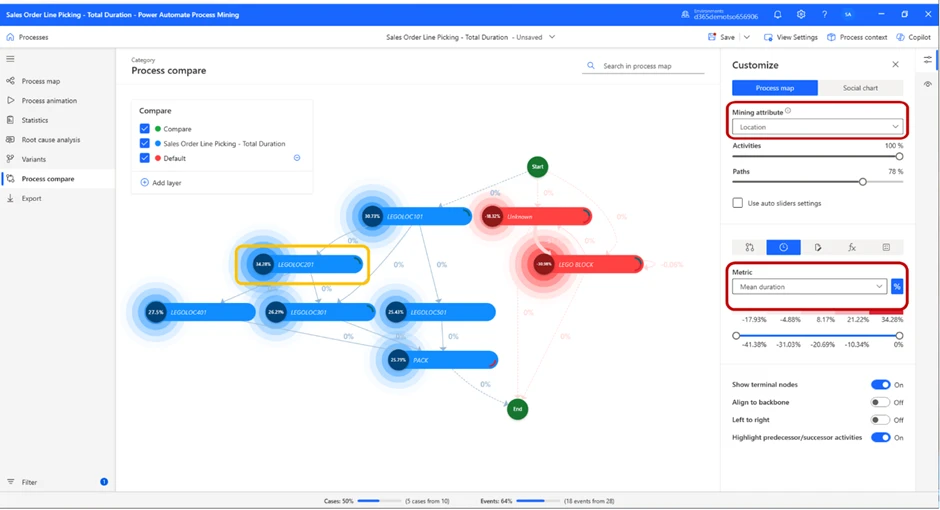
Image: Process compare variants tab location and mean duration map overview.

As we can see from the image above, LEGOLOC 201 is the location in which we spend the largest percentage of our time.
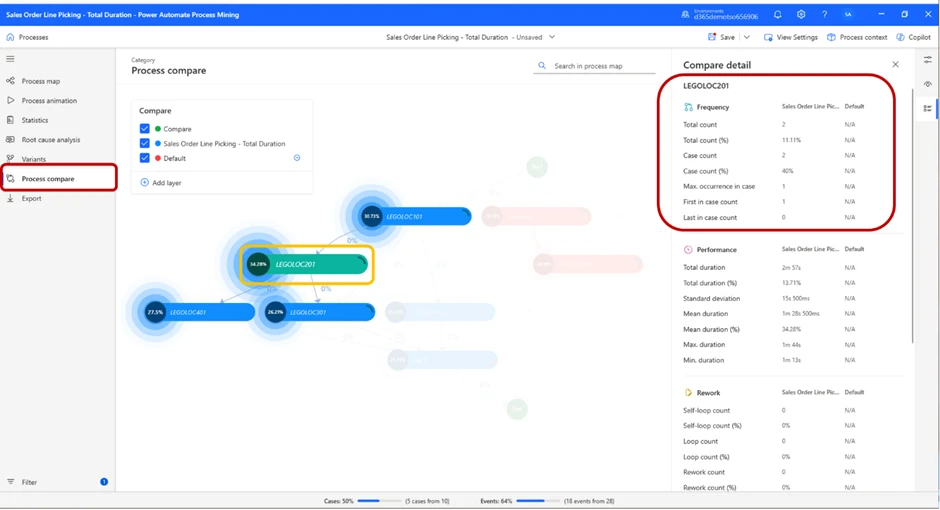
If we want to further examine what is going on in that location, we can do so by pressing the bar. This will change the view slightly, and a card with detailed information will appear on the right of the screen.  
graphical user interface, text, application
Image: Process compare variants tab location map detailed view.

In the highlighted red box, we can see detailed performance data to further assess the performance in this location.

 Now, we have enough information to draw some conclusions on our own. We have identified zone LEGOLOC 201 as our “time-thief”, and we know that more than 1/3 of the time was spent on picking items in this zone.
To make the analysis process easier, Microsoft’s Copilot has been built into this feature.
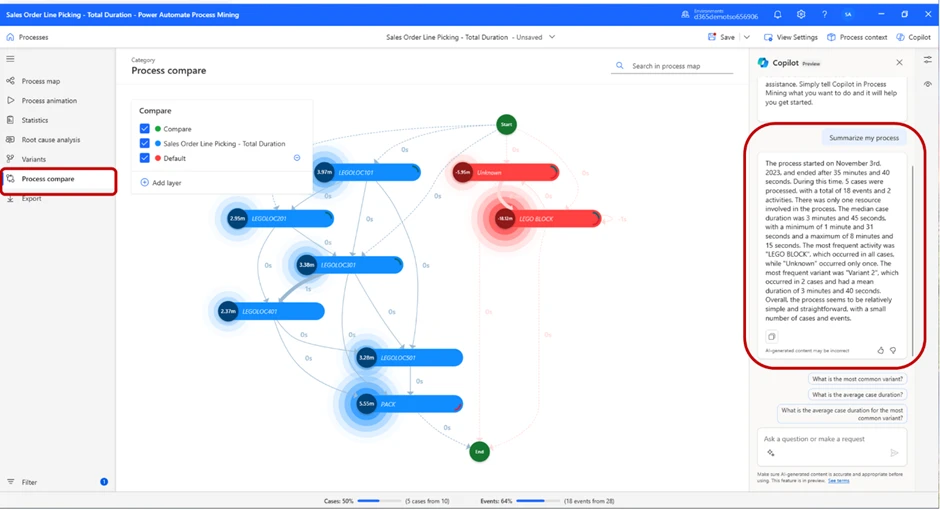
By pressing the Copilot sign in the top-right corner, you will open the dialogue box where you can create a prompt and ask the Copilot about your process. The Copilot will suggest some common prompts, but you can of course create your own. In this case, we will ask the Copilot to summarize our process.   
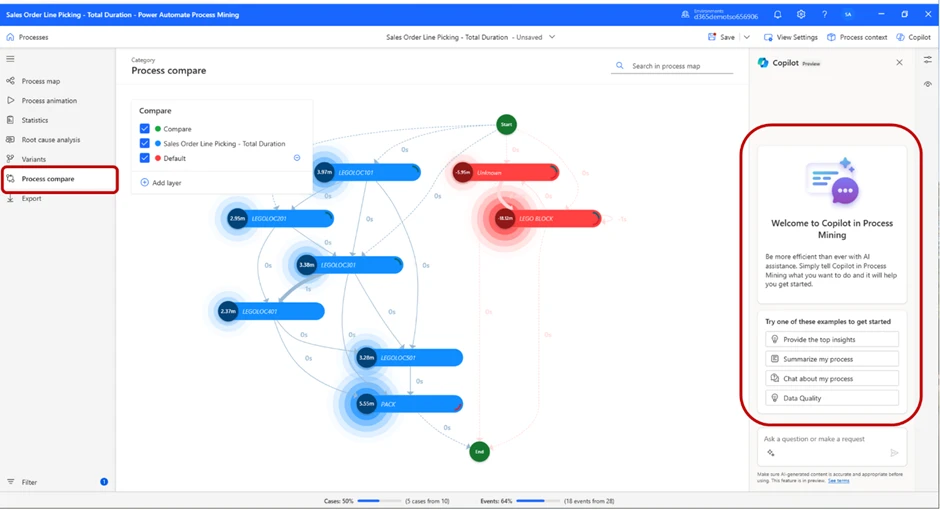
diagram, engineering drawing
Image: Process compare map and Copilot dialogue.
diagram, engineering drawing
Image: Process compare map and Copilot generated answer.

As displayed in the picture, the Copilot will give us a summary of the process. Because we have selected to compare our first part of the test vs our default value (the red locations), it also summarizes the default value’s process.

We do get some information on how many events took place etc., but we did not get the total case time, which was the value we wanted to find to confirm or deny our hypothesis. By asking the Copilot what the average case duration and the total case duration was, we received the answer that mean case duration was 4 minutes and 18 seconds, and total duration was 21 minutes and 31 seconds.

So, our answer in this case is that the Single order picking took 21 minutes and 31 seconds to complete.
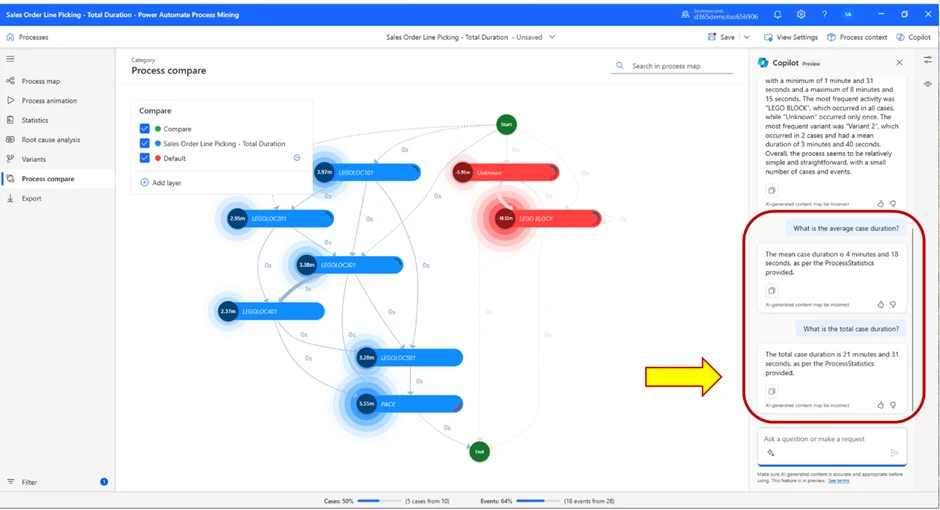
diagram, engineering drawing
Image: Process compare map and Copilot generated answer.

Now, we will compare the result to the cluster picking method, to see how they compare.

For context, cluster picking differs from single order picking in the sense that in cluster picking, workers pick multiple orders simultaneously and not one at a time. In this case, it means the worker will pick all 5 sales orders, then put them all away in the packing station at the same time, rather than picking an order, putting them away in the packing station, and repeating for next orders.
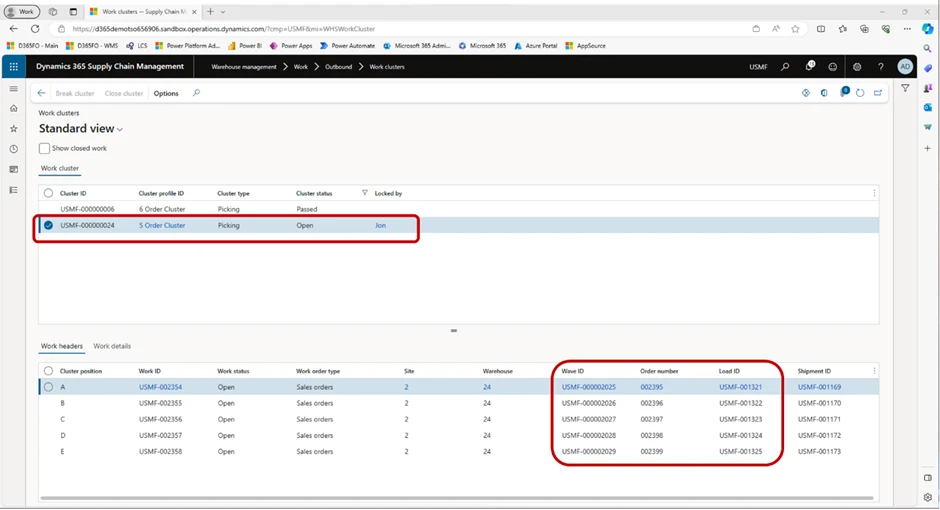
table
Image: Work clusters screenshot.

In this image, we can see the main difference between these picking methods. For cluster picking, we can see that the warehouse worker is tasked with picking 8 pieces of red Lego blocks (left image), and in the second screenshot (right) we can see how many and from which specific positions items should be picked.
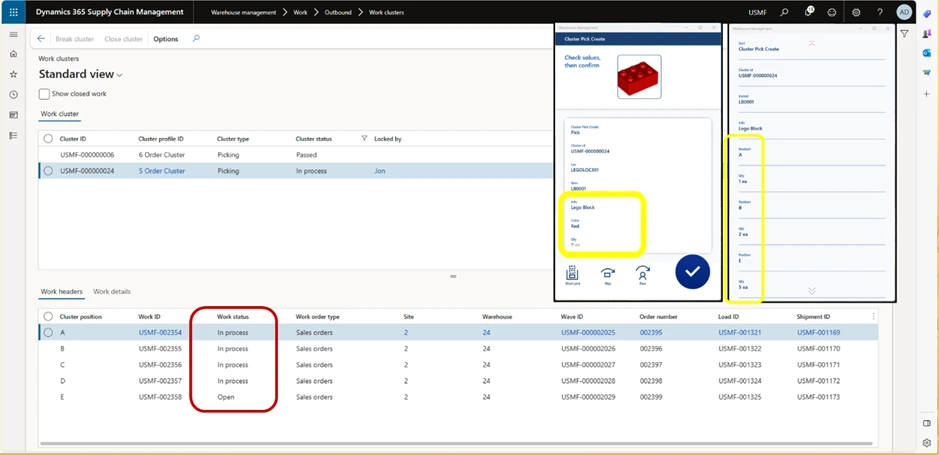
graphical user interface, table
Image: Work clusters screenshot with illustrations.

When all items have been picked, the Work status will be updated so all Cluster positions are “In process”.
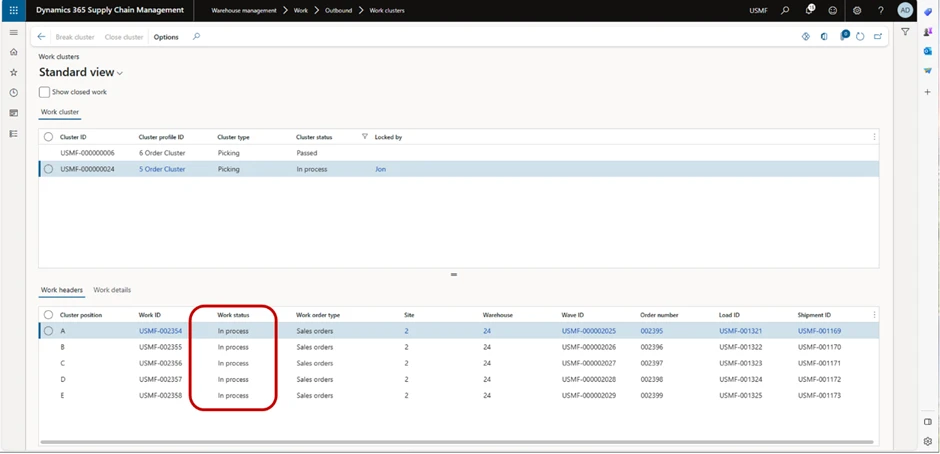
table
Image: Work Cluster in progress.

Next task is to put all items in the packing station. When we have done that, all Cluster position Work statuses will be changed to Closed.
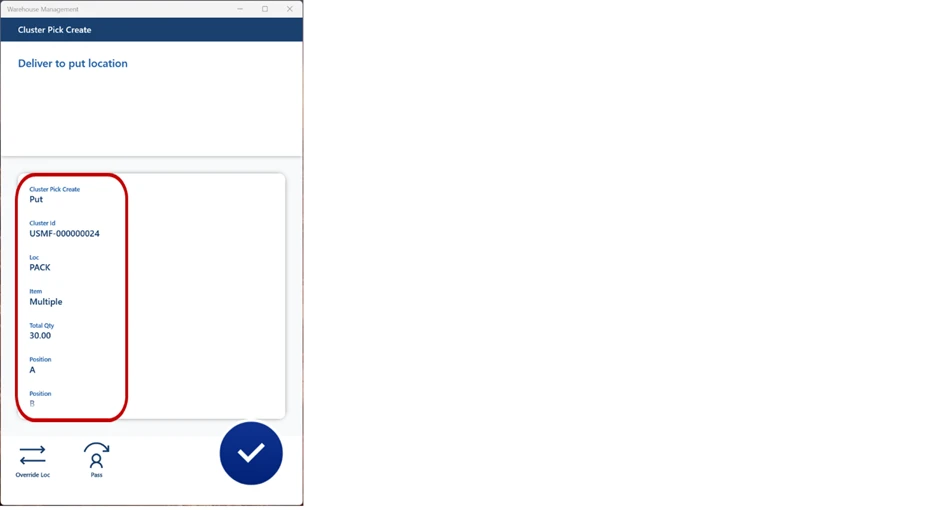
graphical user interface, application, Word
Image: Cluster Put screenshot.

As we can see in the image below, work status has been changed to Closed across the board.
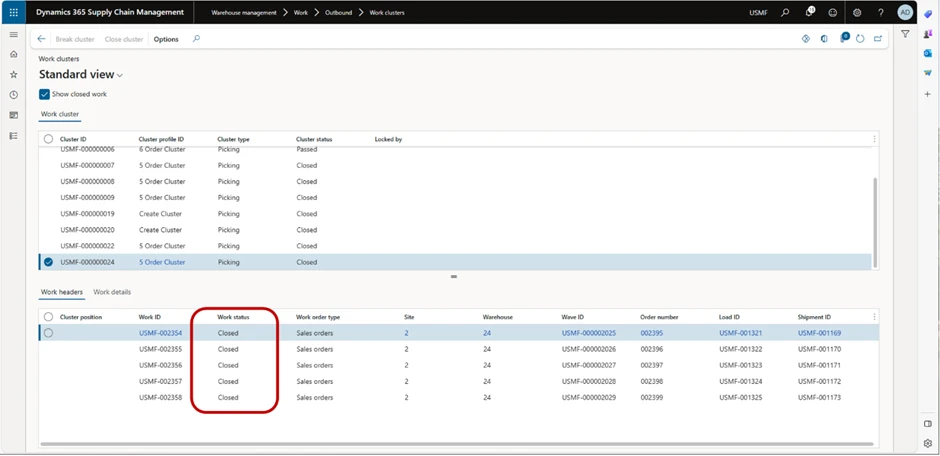
table
Image: Work Clusters status closed.

Now, let’s jump back to the analysis. Start by creating a new process in the same way we did for single order picking and open the process map in Power Automate. In our test case, this is what we are shown on our screen.
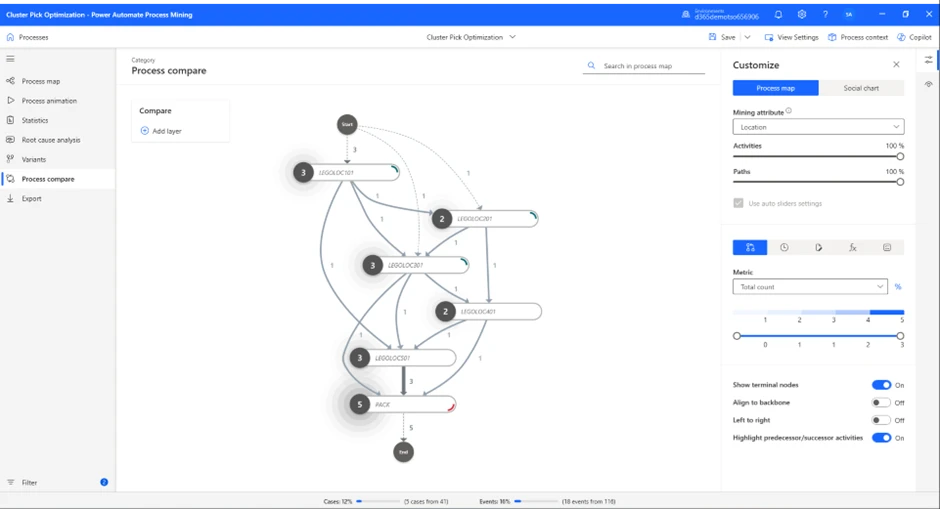
diagram
Image: Process Compare map.

As we have already covered how choosing different metrics affects the process map and the information on display, we will not do that for this part of the test, since we know we need to compare location as the Mining attribute, and total duration as the Metric.

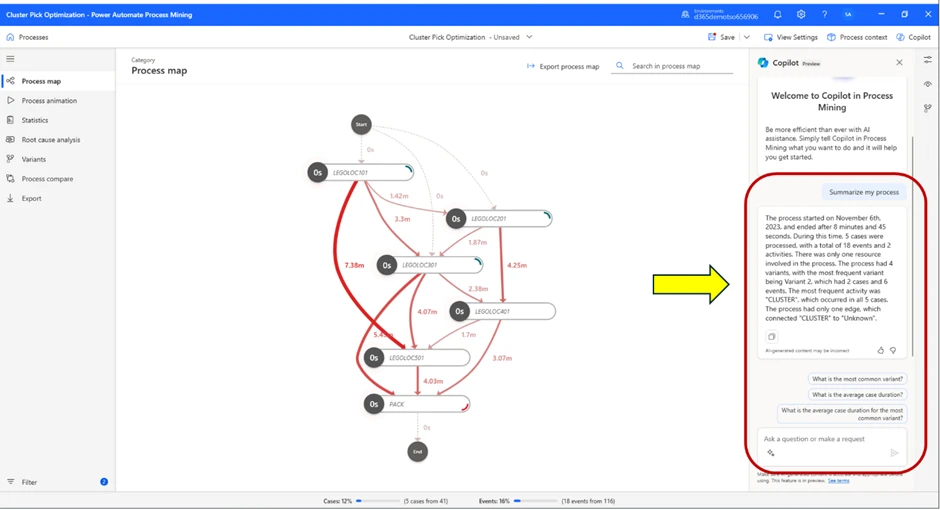
We will again use the help of the Copilot to evaluate the process map. Once again, we ask for a summary of the process.
diagram
Image: Process Compare map and Copilot generated insight.
Test Case Results

The summary from the Copilot tells us that this process started November 6th and ended after 8 minutes and 45 seconds.

This means we have successfully confirmed our hypothesis by using process mining and the process advisor.
Now we know for a fact that for one picker with 5 sales orders constructed in this manner, cluster picking is a much more efficient picking method compared to single order picking, since identical amount of work took significantly less time to complete. Therefore, we can draw the conclusion that for all work with similar characteristics, we should prefer using cluster picking over single order picking, at least if we want to increase warehouse output.

Keep in mind, harnessing the power of Process Advisor requires an analytical mindset and a structured approach. The sheer volume of headers, variants, locations, and numbers can be overwhelming. To navigate this complexity, emulate the structured methodology illustrated in this example. By having a clear understanding of your comparison and measurement objectives, and a strategy to achieve them, you’ll significantly enhance the outcomes derived from Process Advisor.

Essential skills for effective process mining:

Use a fact-based approach with warehouse data as the base.

  • Use a strategic and tactical approach throughout the analysis.
  • Unlike this example, a great way of using process mining is by using continuous analysis, where you monitor something over time, rather than one-time analysis, which it can also be used for, as in this example.
  • Use quick data for immediate insights, and big data for continuous and conclusive analysis.
  • Master filtering to gain valuable insights and sort out what you believe is important.
Wealth of achievements made possible through process mining:
  • Identify areas in which processes can be improved.
  • Validate conformance of processes.
  • Do process simulation and predictive analysis.
  • Discover the most optimal paths for automatization.
Conclusion:

The power of Process Advisor extends far beyond what we’ve explored in this blog. It’s a versatile tool that can be adapted to a myriad of scenarios, and this guide merely scratches the surface of its potential. We’ve used it here to streamline warehouse operations, but the possibilities are truly limitless.

We encourage you to dive in and experiment with Process Advisor. Use the scenario we’ve outlined as a starting point, but don’t stop there. Input your own warehouse data and see firsthand how Process Advisor can illuminate opportunities for efficiency and growth. The journey towards optimizing your warehouse output begins with the Process Advisor.

Learn More

Related documentation:

Overview of process mining in Power Automate – Power Automate | Microsoft Learn

The post Process Advisor for Supply Chain and Warehousing. appeared first on Microsoft Dynamics 365 Blog.

Brought to you by Dr. Ware, Microsoft Office 365 Silver Partner, Charleston SC.

Introducing Microsoft Copilot for Finance: Transform finance with next-generation AI in Microsoft 365

Introducing Microsoft Copilot for Finance: Transform finance with next-generation AI in Microsoft 365

This article is contributed. See the original author and article here.

The finance department is the heart of the organization, juggling a myriad of critical, yet complex tasksfrom quote-to-cash processes like credit and collections to risk management and compliance. Financial teams are not only responsible for these mandatory, labor-intensive operations, but are increasingly tasked with real-time insights into business performance and recommendations for future growth initiatives. In fact, 80% of finance leaders and teams face challenges to take on more strategic work beyond the operational portions of their roles.¹ On the one hand, teams are poised and ready to play a larger role in driving business growth strategy. On the other hand, however, they can’t walk away from maintaining a critical and mandatory set of responsibilities. 

Microsoft is introducing a solution to help finance teams reclaim time and stay on top of the critical decisions that can impact business performance. Microsoft Copilot for Finance is a new Copilot experience for Microsoft 365 that unlocks AI-assisted competencies for financial professionals, right from within productivity applications they use every day. Now available in public preview, Copilot for Finance connects to the organization’s financial systems, including Dynamics 365 and SAP, to provide role-specific workflow automation, guided actions, and recommendations in Microsoft Outlook, Excel, Microsoft Teams and other Microsoft 365 applications—helping to save time and focus on what truly matters: navigating the company to success. 

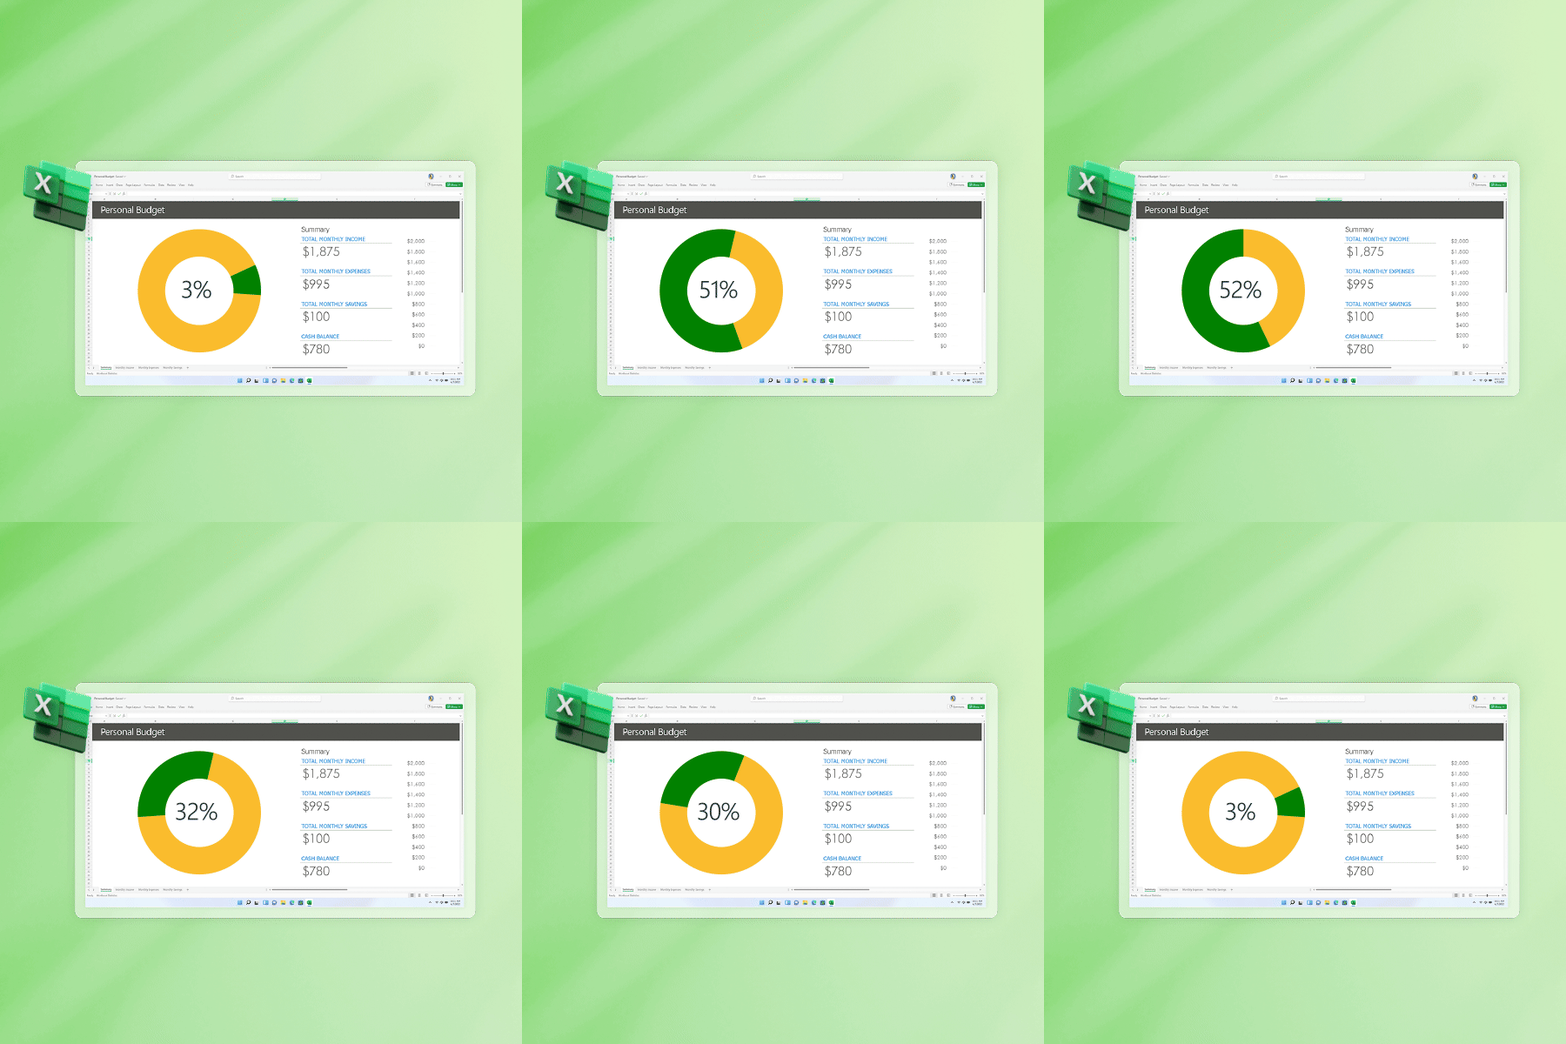
Animated personal budget donut chart

Copilot for Finance

By harnessing AI, it automates time-consuming tasks, allowing you to focus on what truly matters.

Leveraging innovation to accelerate fiscal stewardship 

Finance teams play a critical role in innovating processes to improve efficiency across the organization. As teams look to evolve and improve how time is spent to support more strategic work, it’s evident there are elements of operational tasks that are more mundane, repetitive, and manually intensive.  Instead of spending the majority of their day on analysis or cross-team collaboration, 62% of finance professionals are stuck in the drudgery of data entry and review cycles.² While some of these tasks are critical and can’t be automated—like compliance and tax reporting—we also hear from majority of finance leaders that they lack the automation tools and technology they need to transform these processes and free up time.¹

With the pace of business accelerating every day, becoming a disruptor requires investing in technology that will drive innovation and support the bottom line. In the next three to five years, 68% of CFOs anticipate revenue growth from generative AI (GenAI).³ By implementing next-generation AI to deliver insight and automate costly and time-intensive operational tasks, teams can reinvest that time to accelerate their impact as financial stewards and strategists. 

Microsoft Copilot for Finance: Accomplish more with less

Copilot for Finance provides AI-powered assistance while working in Microsoft 365 applications, making financial processes more streamlined and automated. Copilot for Finance can streamline audits by pulling and reconciling data with a simple prompt, simplify collections by automating communication and payment plans, and accelerate financial reporting by detecting variances with ease. The potential time and cost savings are substantial, transforming not just how financial professionals work, but how they drive impact within the organization. 

Users can interact with Copilot for Finance in multiple ways. It both suggests actions in the flow of work, and enables users to ask questions by typing a prompt in natural language. For example, a user can prompt Copilot to “help me understand forecast to actuals variance data.” In moments, Copilot for Finance will generate insights and pull data directly from across the ERP and financial systems, suggesting actions to take and providing a head start by generating contextualized text and attaching relevant files. Like other copilot experiences, users can easily check source data to ensure transparency before using Copilot to take any actions.  

Copilot for Finance connects to existing financial systems, including Dynamics 365 and SAP, as well as thousands more with Microsoft Copilot Studio. With the ability to both pull insight from and update actions back to existing sources, Copilot for Finance empowers users to stay in the flow of work and complete tasks more efficiently. 

graphical user interface, application, table

Built for finance professionals

Copilot for Finance is well versed in the critical and often time-consuming tasks and processes across a finance professional’s workday, providing a simple way to ask questions about data, surface insights, and automate processes—helping to reduce the time spent on repetitive actions. While today’s modern finance team is responsible for a litany of tasks, let’s explore three scenarios that Copilot for Finance supports at public preview.  

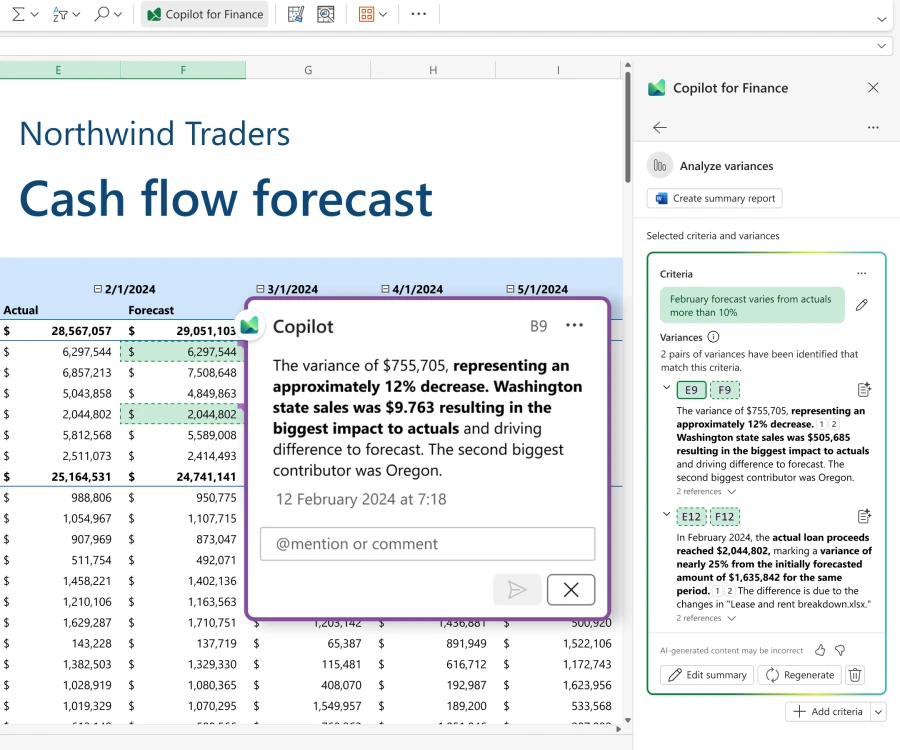
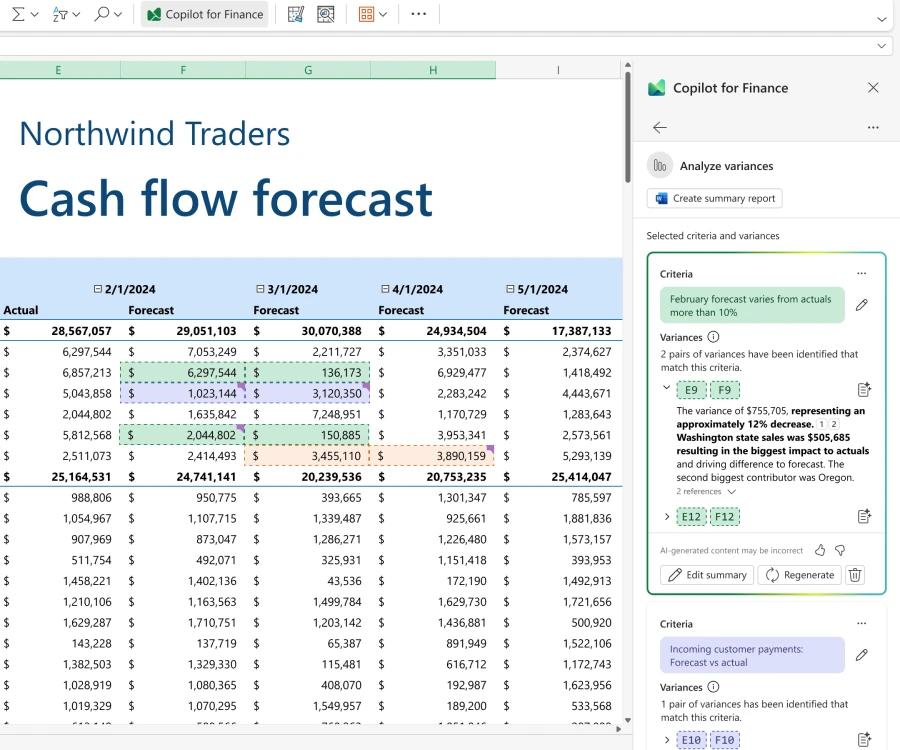
Copilot for Finance can also help financial analysts to reduce the risk of reporting errors and missing unidentified variances. Rather than manually reviewing large financial data sets for unusual patterns, users can prompt Copilot to detect outliers and highlight variances for investigation. Copilot for Finance streamlines variance identification with reusable natural language instructions in the enterprise context. A financial analyst can direct Copilot to identify answers for variances, and Copilot will gather supporting data autonomously.  

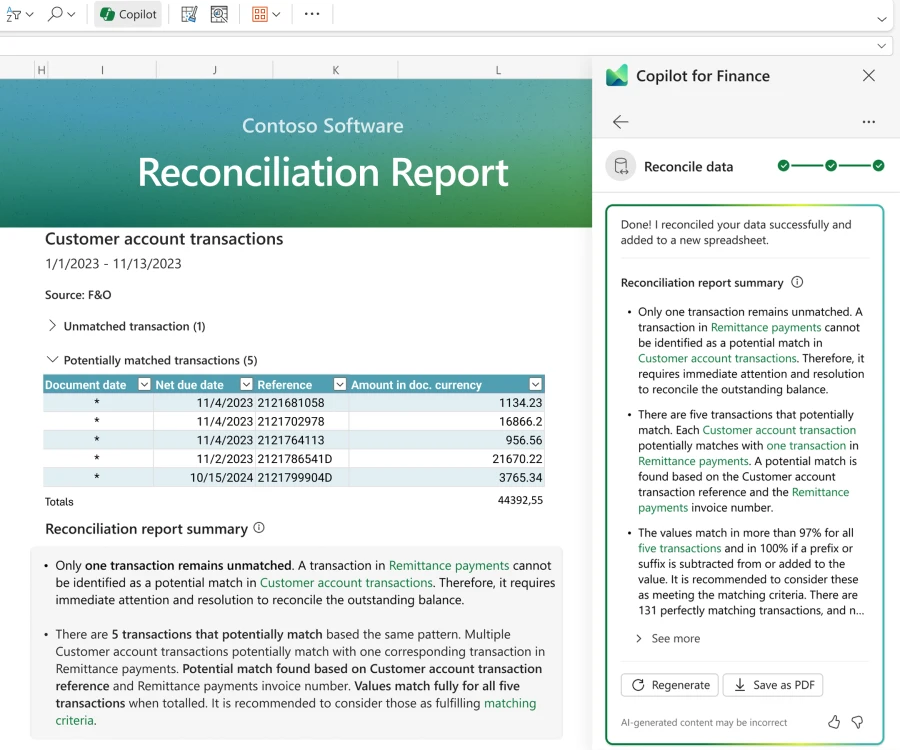
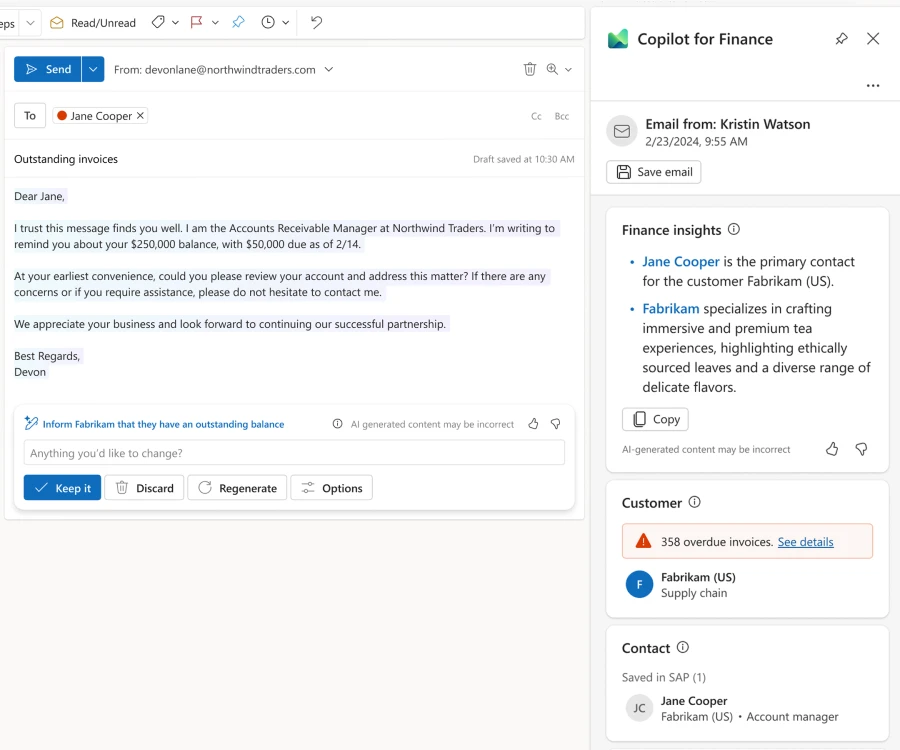
Audits of a company’s financial statements are critical to ensuring accuracy and mitigating risk. Traditionally, accounts receivable managers were required to pull account data manually from ERP records, reconcile it in Excel, and look for inaccuracies manually. With Copilot for Finance, these critical steps are done with a single prompt, allowing AR managers to act on inconsistencies and any delinquencies found with Copilot suggested copy and relevant invoices.

“Finance organizations need to be utilizing generative AI to help blend structured and unstructured datasets. Copilot for Finance is a solution that aggressively targets this challenge. Microsoft continues to push the boundary of business applications by providing AI-driven solutions for common business problems. Copilot for Finance is another powerful example of this effort. Copilot for Finance has potential to help finance professionals at organizations of all sizes accelerate impact and possibly even reduce financial operation costs.”

—Kevin Permenter, IDC research director, financial applications

graphical user interface, text

The collections process is another critical responsibility as it affects company cash flow, profitability, and customer relationships. Collection coordinators spend their time reviewing outstanding accounts and attempting to reconcile them in a timely manner. This often means phone calls, emails, and negotiating payment plans. With Copilot for Finance, collection coordinators can focus their time on more meaningful client-facing interactions by leaving the busy work to Copilot. Copilot for Finance supports the collections process end-to-end by suggesting priority accounts, summarizing conversations to record back to ERP, and providing customized payment plans for customers.

graphical user interface, text, application, email

 Copilot for Finance can also help financial analysts to reduce the risk of reporting errors and missing unidentified variances. Rather than manually reviewing large financial data sets for unusual patterns, users can prompt Copilot to detect outliers and highlight variances for investigation. Copilot for Finance streamlines variance identification with reusable natural language instructions in the enterprise context. A financial analyst can direct Copilot to identify answers for variances, and Copilot will gather supporting data autonomously.  

graphical user interface, application, table

Copilot will suggest financial context contacts and will provide auto summaries for streamlined tracking of action items and follow ups. Copilot for Finance can generate fine-tuned financial commentary, PowerPoint presentations, and emails to report to key stakeholders. 

Our journey with Microsoft Finance  

Microsoft employs thousands across its finance team to manage and drive countless processes and systems as well as identify opportunities for company growth and strategy. Who better to pilot the latest innovation in finance? For the first phase, we worked closely with a Treasury team focused on accounts receivable as well as a team in financial planning and analysiswho need to reconcile data as a part of their workflow before conducting further analysis. After trialing the data reconciliation capabilities in Copilot for Finance, the initial value and potential for scale for these teams was clear.

“Financial analysts today spend, on average, one to two hours reconciling data per week. With Copilot for Finance, that is down to 10 minutes. Functionality like data reconciliation will be a huge time saver for an organization as complex as Microsoft.”

Sarper Baysal, Microsoft Commercial Revenue Planning Lead

“The accounts receivable reconciliation capabilities help us to eliminate the time it takes to compare data across sources, saving an average 20 minutes per account. Based on pilot usage, this translates to an average of 22% cost savings in average handling time.”

Gladys Jin, Senior Director Microsoft Finance Global Treasury and Financial Services

Microsoft Copilot for Finance availability 

Ready to take the next step? Microsoft Copilot for Finance is available for public preview today. Explore the public preview demo and stay tuned for additional announcements by following us on social.

Explore more Copilot offerings for business functions across your organization

Copilot for Finance joins other Copilot offerings designed for business functions, including Microsoft Copilot for Sales and Microsoft Copilot for Service, both now generally available.  

For research insights on the future of work and generative AI, subscribe to WorkLab.


¹ Microsoft Future of Finance Trends Report, 2023
² Metric of the Month: Time Allocation in Finance, CFO, Perry D. Wiggins. December 7, 2020.
³ Accelerating the GenAI Journey with Use Cases in the Functional and Application Areas, IDC, Mickey North Rizza. February 2024.

The post Introducing Microsoft Copilot for Finance: Transform finance with next-generation AI in Microsoft 365 appeared first on Microsoft Dynamics 365 Blog.

Brought to you by Dr. Ware, Microsoft Office 365 Silver Partner, Charleston SC.
Empowering Business innovation for modernizing Retailers and manufacturers with Copilot: Unleashing Dynamics 365 Commerce investments for 2024 Wave 1

Empowering Business innovation for modernizing Retailers and manufacturers with Copilot: Unleashing Dynamics 365 Commerce investments for 2024 Wave 1

This article is contributed. See the original author and article here.

Editor: Denis Conway

Introduction:

Dynamics 365 Commerce is a comprehensive omnichannel solution that empowers retailers to deliver personalized, seamless, and differentiated shopping experiences across physical and digital channels. In the 2024 release Wave 1, Dynamics 365 Commerce continues to innovate and enhance its capabilities to improve store associate productivity and meet the evolving needs of customers and businesses. Here are some of the highlights of the new features coming soon:

Copilot in Site builder is going global and multi-lingual:

Copilot in Site builder is a generative AI assistant that helps users create engaging and relevant content for their e-commerce sites. Copilot uses the product information and the user’s input to generate product enrichment content that is crafted using brand tone and tailored for targeted customer segments.

graphical user interface
Image: Copilot Site Builder

In the 2024 release wave 1, Copilot in Site builder is expanding its language support to include support for 23 additional locales including German, French, Spanish, and more. This feature demonstrates Microsoft’s commitment to making Copilot accessible globally and empowering users to create multilingual content with ease and efficiency.

Strengthening our dedication to creating a comprehensive B2B solution for Digital Commerce by supporting B2B indirect commerce

Dynamics 365 Commerce supports both B2C and B2B commerce scenarios, enabling retailers to sell directly to consumers and businesses. In the 2024 release wave 1, Dynamics 365 Commerce fortifies its B2B investments by introducing support for B2B indirect commerce, which enables manufacturers selling through a network of distributors to get complete visibility into their sales and inventory.

graphical user interface
Image: New distributor capabilities

New distributor capabilities enable manufacturers to provide a self-service platform that simplifies distributor operations and builds meaningful, long-lasting business relationships through efficient and transparent transactions. Distributors can access product catalogs and pricing specific to their partner agreements, manufacturers can place orders on behalf of their customers with specific distributor, and outlets can track order status and history.

Dynamics 365 Commerce also streamlines multi-outlet ordering, enabling business buyers that are associated with more than one outlet organization to buy for all of them. Commerce provides the ability to seamlessly buy for multiple organizations using the same email account, enabling buyers to be more efficient.

graphical user interface, website
Image: Order for Organizations

Additionally, Dynamics 365 Commerce supports advance ordering, which is a common practice in some businesses to order products in advance to ensure they have adequate stock when needed. This feature enables customers to specify the desired delivery date and include additional order notes.

Also, introducing support for a promotions page on an e-commerce site that serves as a hub to showcase various deals and promotions that shoppers can take advantage of. The promotions page can display active and upcoming promotions.

graphical user interface
Image : Promotions Page
Adyen Tap to Pay is coming to Store Commerce app on iOS

The Store Commerce app is a mobile point of sale (POS) solution that enables store associates to complete transactions through a mobile device on the sales floor, pop-up store, or remote location. The Store Commerce app supports various payment methods, such as cash, card, gift card, and loyalty points.

a hand holding a remote control
Image: Adyen Tap to Pay

In the 2024 release wave 1, Dynamics 365 Commerce is introducing Adyen Tap to Pay capabilities into the Store Commerce app for iOS, so that retailers everywhere can accept payments directly on Apple iPhones. Adyen Tap to Pay enhances the utility and versatility of the Store Commerce app, as it eliminates the need for additional hardware or peripherals to process payments. It also enables retailers to offer a more customer-centric and engaging in-store retail experience, as store associates can interact with customers anywhere in the store and complete transactions on the spot.

Speed up your checkout process with simplified and consistent payment workflows for different payment methods on Store Commerce app

Efficiency and predictability are key to the smooth operation of a point of sale (POS) system, especially when it comes to payment processing. When store associates can process customer payments across a variety of payment types with minimal friction, customers spend less time waiting and more time shopping.

In the 2024 release wave 1, Dynamics 365 Commerce is improving the POS payment processing user experience to create more consistent workflows across payment types. The new user experience simplifies the payment selection and confirmation process, reduces the number of clicks and screens, and provides clear feedback and guidance to the store associate. The new user experience also supports split tendering, which allows customers to pay with multiple payment methods in a single transaction.

graphical user interface, application, Teams
Image: Check out process

The improved POS payment processing user experience will contribute to efficiencies in the checkout process and more satisfied customers. It will also reduce the training time and effort for store associates, as they can easily learn and master the payment workflows.

Enabling retailers to effectively monitor and track inventory of Batch-controlled products via Store Commerce app

Batch-controlled products are products that are manufactured in batches and associated with unique identifiers for quality control and traceability. Batch-controlled products are commonly used in food, chemical, and electronics industries, where the quality and safety of the products are critical.

graphical user interface, application, Teams
Image: Batch Control Products

In the 2024 release wave 1, Dynamics 365 Commerce enhances the Store Commerce app to support batch-controlled products. This feature enables store associates to scan or enter the batch number of the products during the sales or return transactions and validate the batch information against the inventory records. This feature also enables store associates to view the batch details of the products, such as the expiration date, manufacture date, and lot number.

With these new features, Dynamics 365 Commerce aims to provide you with the best tools and solutions to grow your business and delight your customers. Whether you want to create engaging and relevant content for your e-commerce site, automate and integrate your order management workflows, expand your B2B commerce opportunities, or improve your payment processing and inventory management, Dynamics 365 Commerce has something new for you.

To learn more about Dynamics 365 Commerce:

Learn more about additional investments and timeline for these investments here in release plans.

Visit our website on commerce today.

The post Empowering Business innovation for modernizing Retailers and manufacturers with Copilot: Unleashing Dynamics 365 Commerce investments for 2024 Wave 1 appeared first on Microsoft Dynamics 365 Blog.

Brought to you by Dr. Ware, Microsoft Office 365 Silver Partner, Charleston SC.
Sustainability in Dynamics 365 Business Central: A New Way to Measure and Manage Your Environmental Impact

Sustainability in Dynamics 365 Business Central: A New Way to Measure and Manage Your Environmental Impact

This article is contributed. See the original author and article here.

Learn how the upcoming 2024 release wave 1 will enable you to track and report your greenhouse gas emissions with ease and accuracy.

Sustainability is more than a buzzword. It’s a global imperative that demands urgent action from all sectors of society, including the business world. As regulations and expectations around environmental reporting evolve, organizations need reliable and efficient tools to measure and manage their impact on the planet.

That’s why we’re excited to announce that Dynamics 365 Business Central will soon offer new sustainability features that will help you comply with the latest standards and best practices, as well as drive positive changes for your business and the environment. Starting from the 2024 release wave 1, you’ll be able to track and report your greenhouse gas (GHG) emissions across three scopes defined by the ESG standard, using sustainability journals and built-in calculation methods. You’ll also be able to leverage the new Chart of Sustainability Accounts to organize and analyze your emission data with ease and transparency.

The new functionality is designed to oversee and regulate an organization’s environmental footprint by tracking various greenhouse gas (GHG) emissions, facilitating proper insights. This functionality will be a multi-wave investment and at this first release we delivered basic framework as a foundation for future expanding. The first version focuses on GHG emissions, and related to that the solution is focused on three emission scopes defined by the ESG standard. This feature supports the basic process of collecting emission data via sustainability journals, allowing for manual entry of known data, or utilizing built-in methods for calculating emissions footprints.

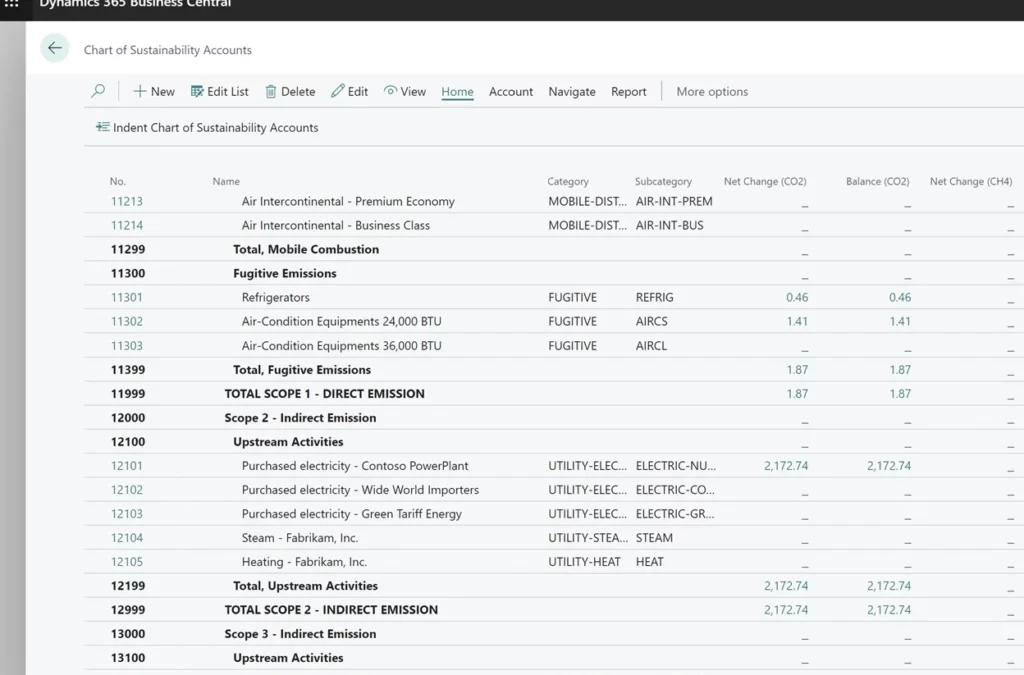
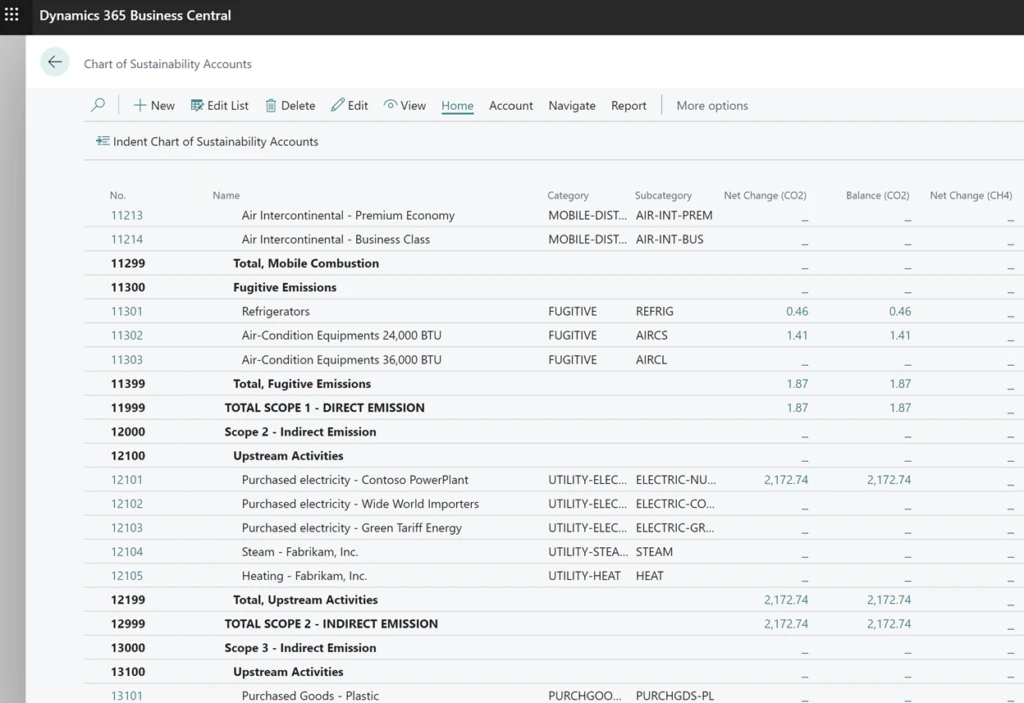
Chart of Sustainability Accounts

The Chart of Sustainability Accounts forms the foundational structured list used for recording all emissions data. It functions as a comprehensive framework that categorizes and organizes these accounts based on their attributes, such as scope or other groupings. Each account is typically assigned a unique code or number for easy reference and tracking, following the same structure as a traditional Chart of Accounts but customized specifically for monitoring sustainability-related data and metrics within an organization.

This chart typically encompasses categories such as energy consumption, greenhouse gas emissions, waste generation, and other pertinent sustainability metrics. Users have the flexibility to add Account Categories and Subcategories to define how the system behaves, selecting dedicated emissions for tracking, emission factors, formulas, and similar configurations.

In essence, the Chart of Sustainability Accounts serves as the backbone of the Sustainability feature, facilitating effective tracking, measurement, and management of sustainability-related data and metrics within the organization.

table

Chart of Sustainability Accounts

Sustainability Journals

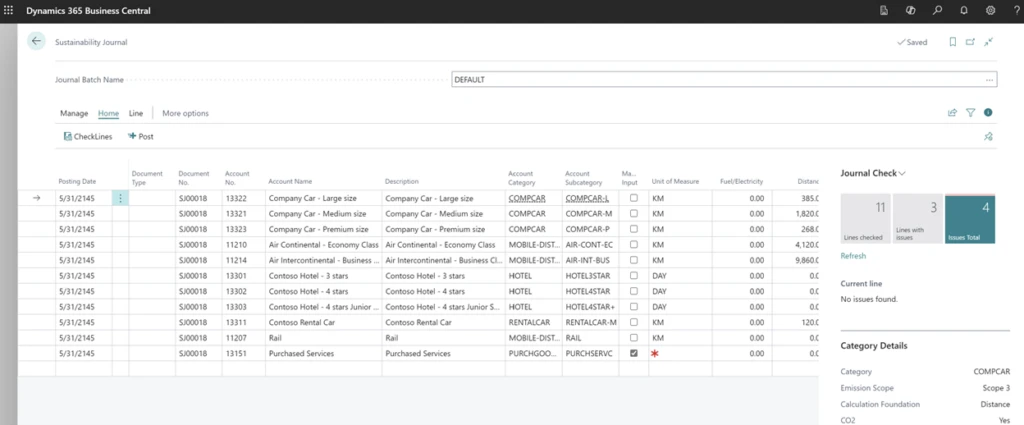
Sustainability Journals are designed to track and record sustainability-related activities, and metrics within an organization, using the same user experience as other journals in Business Central. Within the journal, users have the option to input emissions manually if they possess the necessary information. Alternatively, if they lack this data, they can utilize built-in formulas to accurately calculate emissions based on specific known parameters corresponding to various types of sources and accounts.

When posting with a Sustainability Journal, entries are generated on the Sustainability Ledger. Similar to other journal types, users have the flexibility to utilize various templates and batches with specific configurations. They can opt for standard journals or recurring journals to manage sustainability data efficiently.

table

Sustainability Journal

Sustainability Entries

The Sustainability Ledger organizes all emission data according to the Chart of Sustainability Accounts. When a user posts the Sustainability Journal, all crucial data is recorded within the Sustainability Entries. Posting to these entries can be regulated by specific rules configured in the Sustainability Setup, and users can use dimensions in a manner consistent with other entries throughout Business Central. All reports are generated based on Sustainability Entries. Presently, there are several existing reports available for analyzing and tracking emissions. However, in future releases, Business Central will introduce additional reports for printing or submission to relevant authorities.

Future Development

As mentioned in the introduction, Microsoft will continue to enhance this feature by adding more horizontal capabilities and improving its connection with other features in Business Central, without focusing on industry-specific aspects. The development of new features will depend on research of the key elements for such solutions, compliance with regulatory requirements, and useful feedback from partners. Also, it is expected that ISV partners will use this basic framework to create industry-specific sustainability solutions.

The post Sustainability in Dynamics 365 Business Central: A New Way to Measure and Manage Your Environmental Impact appeared first on Microsoft Dynamics 365 Blog.

Brought to you by Dr. Ware, Microsoft Office 365 Silver Partner, Charleston SC.
Use Microsoft Copilot for Service with your external CRM 

Use Microsoft Copilot for Service with your external CRM 

This article is contributed. See the original author and article here.

Last year, we released a revolutionary set of Copilot capabilities within Dynamics 365 Customer Service. With Copilot, agents can get quick answers, draft emails, and summarize cases and conversations using information that already exists in Dynamics 365, as well as your preferred data sources.  

Now there’s Copilot for Service, which lets you connect all your data sources without replacing your existing CRM. Just like Copilot in Dynamics 365 Customer Service, Copilot for Service enables agents to easily manage customer inquiries, track service requests, and provide personalized support. It integrates Microsoft 365 experiences with external systems, such as Salesforce, Zendesk, and ServiceNow. 

Why Copilot for Service is the right solution 

Today, it is possible to build your own copilots using Copilot Studio, formerly known as Power Virtual Agents. With Copilot Studio, you can create a bot that addresses a specific topic (for example, “get order status”) or you can use plugins to leverage copilots and bots you have already built. Plugins let you connect to external data sources, and you can use them across Copilots to ensure agents have a consistent experience anywhere they ask a service-related question. Agents don’t have to move between systems to find answers, which reduces the time to resolution. 

Customers can use Copilot Studio within Copilot for Service to customize and publish plugins for Copilot for Microsoft 365. For example, you can use Copilot Studio to add proprietary knowledge bases for the copilot’s real-time responses or set up authentication to ensure only authorized agents can use Copilot. Building and publishing standalone Copilot experiences for any internal or external channel requires a standalone Copilot Studio license. 

Copilot for Service removes the development overhead and will build specific copilot experiences tailored to your organization’s needs. Additionally, if you’re already using Copilot for Microsoft 365, it’s easy to extend it with role-based capabilities for agents through prebuilt connectors to other CRMs. 

Try Copilot for Service features 

This month, we’re releasing four new features in preview: 

  • Draft an email response in Outlook: Agents can select from the predefined intents for the email to be drafted and provide their own custom intent. Copilot uses the context of the email conversation and case details to produce personalized and contextual emails. 
  • Email summary in Outlook: Copilot provides an email summary capturing all the important information for agents to understand the context of the case they’re working on. Agents can save the generated summary to the connected CRM system. 
  • Case summary in Outlook: Agents can access case summaries as they work on emails from customers. They can also save the case summary to the CRM system. 
  • Meeting recap in Teams: Copilot provides a meeting summary and action items that integrate with the Teams recap, providing all the relevant follow-up items. Agents can also create CRM tasks right from the Teams recap section.

Get started with Copilot for Service 

First, create a copilot instance in your environment by navigating to https://servicecopilot.microsoft.com/ and following the prompts. You need to give it a name, a description, and a target system that you want to connect to. For example, you can create a copilot named Microsoft that can access information from Salesforce. The portal will then guide you through creating the connection and deploying the copilot. 

The second step is to test your copilot in the demo agent desktop that is automatically generated for you. You can ask your copilot questions related to the target system, such as “What products does Microsoft sell?” or “How do I create a case in Salesforce?” 

In summary, Microsoft Copilot for Service is a powerful tool that can help your agents provide better support to your customers. By leveraging the power of AI, it can provide quick and accurate answers to common questions, freeing up your agents to focus on more complex issues. To learn more, be sure to check out the partner workshop and try it out for yourself. 

Learn more

For pricing information, see Microsoft Copilot for Service—Contact Center AI | Microsoft AI  

Extend Copilot for Service with Copilot Studio: Extend your agent-facing copilot | Microsoft Learn 

Overview of Copilot for Microsoft 365: Copilot for Microsoft 365 – Microsoft Adoption 

If you are a Dynamics 365 Customer Service user, you can start using Copilot capabilities right away: Enable Copilot features in Customer Service | Microsoft Learn 

The post Use Microsoft Copilot for Service with your external CRM  appeared first on Microsoft Dynamics 365 Blog.

Brought to you by Dr. Ware, Microsoft Office 365 Silver Partner, Charleston SC.
Optimizing Warehouse Management: Unveiling the Power of D365 Warehouse Mobile App Version 2.1.23

Optimizing Warehouse Management: Unveiling the Power of D365 Warehouse Mobile App Version 2.1.23

This article is contributed. See the original author and article here.

Introduction

The recent unveiling of the D365 Warehouse Mobile App’s latest release, version 2.1.23, represents a significant stride forward in warehouse management technology. This update brings forth a plethora of enhanced features geared towards elevating user experience and streamlining processes. Notably, version 2.1.23 places a strong emphasis on authentication, stability, and user-friendliness, catering to the complex demands encountered by businesses striving to optimize their warehouse management practices. Here’s a closer look at the key enhancements introduced in this release cycle:

Enhanced Authentication

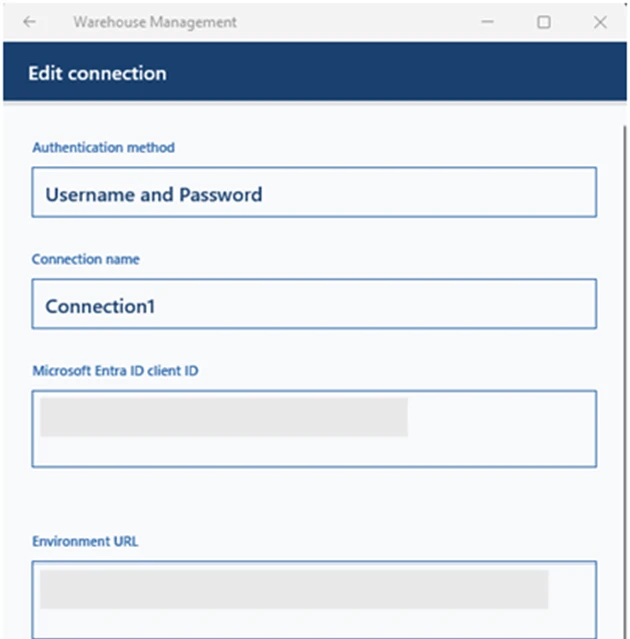
One of the key highlights of this version is the implementation of several authentication improvements. By adding support for username/password authentication and single sign-on (SSO), the app now offers more flexibility and security options for users. This not only simplifies the login process but also ensures that access to sensitive warehouse data is securely managed.

graphical user interface, application
Image: Authentication Improvements
Improved Stability

With increased stability, users can rely on the app to perform consistently even in demanding warehouse environments. This means fewer interruptions and smoother operations, ultimately leading to higher productivity and efficiency.

Automatic Sign-In

The introduction of default mobile device user assignment enables automatic sign-in for workers, streamlining the authentication process further. This feature reduces the time spent on logging in, allowing employees to focus more on their tasks at hand.

Enhanced Support for Active Directory Federation Services (AD FS)

By improving support for AD FS, the app now offers better compatibility with Dynamics 365 Finance + Operations (on-premises) environments. This enables seamless authentication using device code flow, username/password, and SSO methods, ensuring compatibility with various IT infrastructures.

Usability Improvements

The update also brings several usability enhancements, including better support for scaling text and improved accessibility features. With text scaling, users can fit more information on the screen, enhancing readability and usability. Additionally, the app now supports the new “back” gesture in Android 13, providing a more intuitive navigation experience.

graphical user interface, application
Image: Usability improvements

Business Benefits

Increased Efficiency

With smoother authentication processes and enhanced stability, employees can spend less time dealing with technical issues and more time on productive tasks. This leads to increased efficiency and throughput in warehouse operations.

Improved Security

The addition of authentication methods such as username/password and SSO enhances security, ensuring that only authorized personnel can access sensitive warehouse data. This helps mitigate the risk of data breaches and unauthorized access, safeguarding valuable business assets.

Enhanced User Experience

Usability improvements, such as text scaling and accessibility enhancements, contribute to a better overall user experience. Employees can navigate the app more easily and access information more quickly, leading to higher satisfaction and productivity.

Seamless Integration

With improved support for AD FS and Dynamics 365 Finance + Operations environments, the app seamlessly integrates with existing IT infrastructure. This ensures smooth deployment and compatibility, minimizing disruptions and facilitating adoption.

Conclusion

In conclusion, the release of D365 Warehouse Mobile App version 2.1.23 signifies a monumental leap forward in warehouse management technology. By prioritizing enhancements across authentication, stability, usability, and compatibility, this update revolutionizes the way businesses operate their warehouses. With streamlined authentication processes, bolstered stability, and intuitive usability features, users can expect a seamless experience that translates into heightened efficiency and productivity. Moreover, the fortified security measures instil confidence in data integrity, safeguarding valuable assets against potential threats. As businesses embrace these advancements, they pave the way for a future where warehouse operations are not only optimized but also poised for sustained growth and success.

Link to the new release notes What’s new or changed in the Warehouse Management mobile app – Supply Chain Management | Dynamics 365 | Microsoft Learn

icon Warehouse 2

Learn more

Supply Chain at Microsoft

Take a tour – Supply Chain Management | Microsoft Dynamics 365

Learn more about the latest AI breakthroughs with Microsoft Dynamics 365 Copilot:

Dynamics 365 AI webpage


The post Optimizing Warehouse Management: Unveiling the Power of D365 Warehouse Mobile App Version 2.1.23 appeared first on Microsoft Dynamics 365 Blog.

Brought to you by Dr. Ware, Microsoft Office 365 Silver Partner, Charleston SC.