by Scott Muniz | Sep 8, 2020 | Azure, Technology, Uncategorized
This article is contributed. See the original author and article here.
Security is in everything and with Azure Sentinel, you can consolidate different sources of security signals into a single “glass of pain.” Azure Sentinel is pleased to announce the Microsoft Teams connector is now in Public Preview, so lets take a look.
Whether you have on-premises servers and also use software-as-a-service platforms (like Microsoft 365), or you’re a fully cloud workplace, or you’re somewhere in between, there are so many different things to monitor which could be a sign of a security breach. Many people start out with Azure Sentinel (Microsoft’s cloud-based Security Information and Events Management system) to monitor virtual machines, on-premises infrastructure or their own custom built applications. But the product is worth taking a look at by Microsoft 365 administrators, for the Office 365 connector which now supports logs from Microsoft Teams (in public preview).
What events can I see from Microsoft Teams, in Azure Sentinel?
Azure Sentinel connects to the Microsoft 365 audit log. There are currently 27 different user and admin activities that are logged for Microsoft Teams, including:
– Added/removed bot to a team
– Added/deleted channel
– Added/removed connector
– Changed channel/organization/team setting
– Added/removed members
– Installed/uninstalled app
– User signed in to Teams
For details, see Teams activities.
There are also additional activities logged if you use the Shifts app in Teams and Microsoft Teams Healthcare activities in the Patients application.
What are the pre-requisites?
First, remember that as a public preview feature, this is provided without a service level agreement. Don’t build a mission-critical security strategy for your production workloads that are reliant on this capability, but if you do try it out, we welcome your feedback.
With that said, you need:
– To have read and write permissions on your Azure Sentinel workspace (or create a new one with these permissions)
– To be a global administrator or security administrator on your tenant
– And your Office 365 deployment must be on the same tenant as your Azure Sentinel workspace
– Plus, unified audit logging must be enabled on your Microsoft 365 deployment. To check or enable that, visit Turn audit log search on or off.
How do I connect Microsoft Teams to Azure Sentinel?
Sarah Young (Senior Program Manager, Azure Security) has a blog on how to add the Office 365 data connector to Sentinel here: What’s new: Microsoft Teams connector in Public Preview
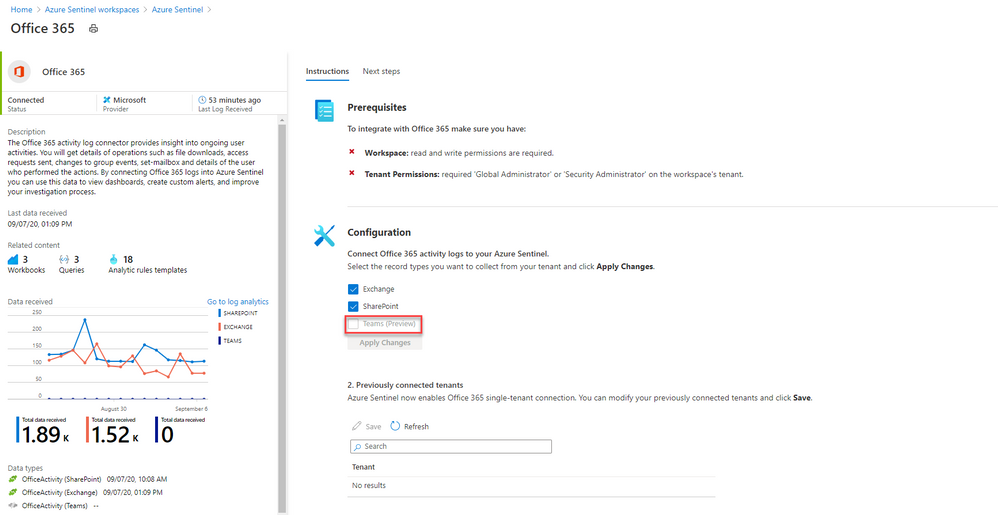
In essence, you create a log analytics workspace and add it to Azure Sentinel (or create a new log analytics workspace), then you’ll find Office 365 under the list of Data connectors you can add. This data connector also allows you to connect activity logs for Exchange and SharePoint, but you can toggle those off independently.

Once my logs are connected, then what can I do?
Searching logs is one thing, and that’s useful if you want to investigate a scenario (like a Teams channel disappeared – who deleted it?).


But now you can also add Microsoft teams activities into Azure Sentinel workbooks, to build your own simple data presentation or complex graphing & investigative maps. Check out Matt Lowe’s article on Azure Sentinel Workbooks 101.
You can also leverage the power of Azure Sentinel’s powerful hunting search and query tools, and bookmark findings that look unusual or suspicious. Learn more at Hunt for threats with Azure Sentinel.
Contribute your feedback
The Azure Sentinel product group has a community page on Github, which also has great links on resources to get you started with the different features of Azure Sentinel. Visit the resources section to learn how you can contribute your feedback about the Microsoft Teams component of the Office 365 data connector, and Azure Sentinel in general.
Whether you’re a security professional looking to expand the scope of what you are monitoring across your organization, or you are a Microsoft 365 administrator with no Azure Sentinel experience, this new capability further ties Microsoft’s products together to help make your job easier. Will you try this out? Let us know in the comments!
-SCuffy
by Scott Muniz | Sep 6, 2020 | Azure, Technology, Uncategorized
This article is contributed. See the original author and article here.
Throughout this series, I’m going to discuss how Power Platform is particularly useful for ad-hoc basis jobs like provisioning resources on Azure.
In my previous post, we walked through how to install live-streaming related applications to Azure Windows VM while provisioning it. By the way, this type of VM provisioning is required ad-hoc basis, rather than a regular schedule. We create an ARM template for it, but we never know when it is used. The nature of ad-hoc workflows is like this. We may use it again, but we never know when it will be. We may not be ready to run when it needs to be run.
Power Apps is the right fit to handle this sort of running ad-hoc workflows on mobile devices. This post shows a glimpse of an idea how Power Apps and Power Automate handles Azure resource provisioning so that your IT pros in your organisation can create ad-hoc resources without having to get a DevOps engineer.
One Parameter Rules Power Automate Workflow?
The number of parameters from Power Apps is determined by the Power Apps trigger on Power Automate. If the number of parameters or parameter names used in a Power Automate workflow becomes too many, changes often, or is non-deterministic, this approach would be useful.
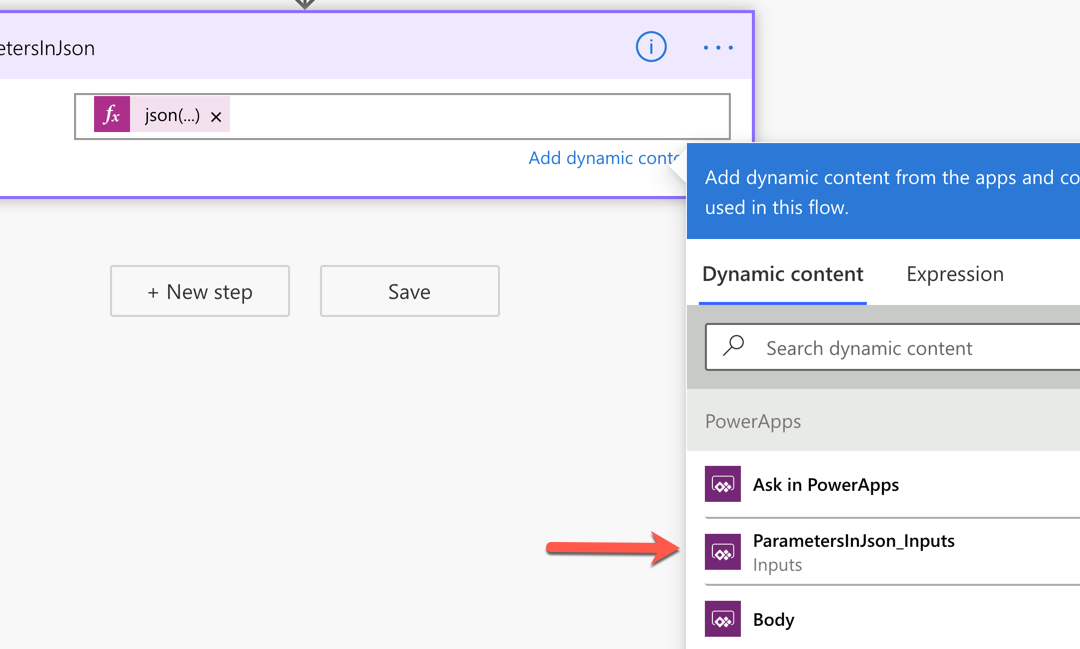
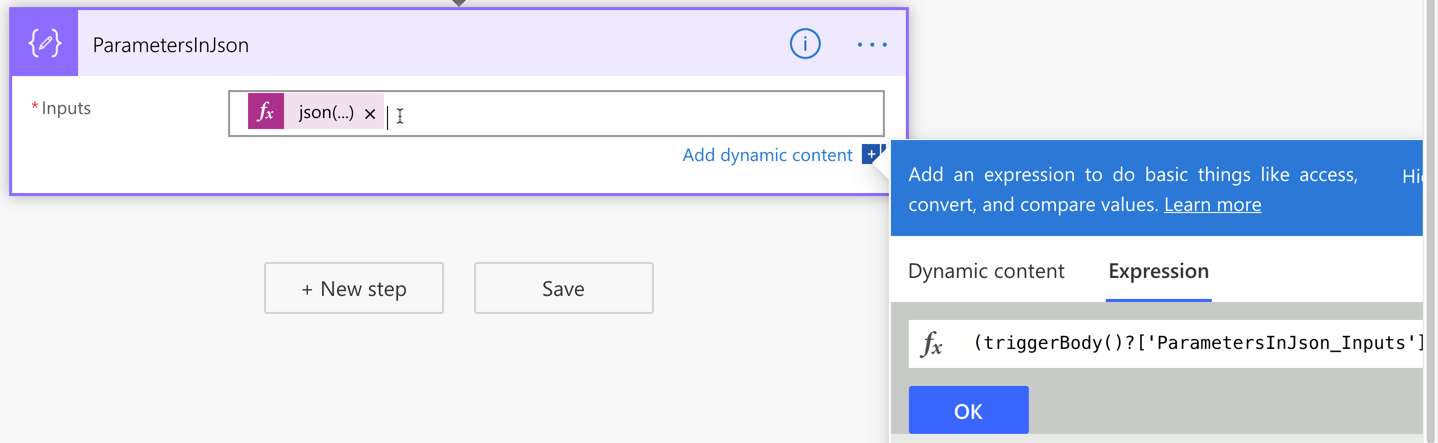
First of all, add a Compose action and change its name to ParametersInJson. Then create a parameter for it, which will be named to ParametersInJson_Inputs.

Add the function expression, json(triggerBody()?['ParametersInJson_Inputs']), to the Inputs field like this:
If we handle all the parameters passed from Power Apps in this way, we only have one parameter but take all values passed from Power Apps flexibly. This approach also avoids Power Apps from keeping remove and re-connect Power Automate over and over again whenever the parameters are updated.
Power Automate Workflow – Azure Resource Provisioning
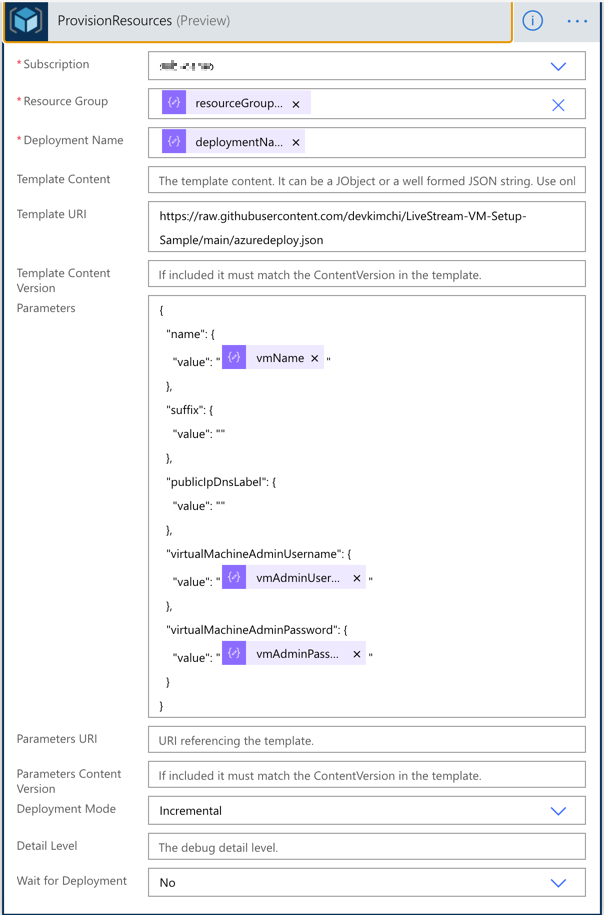
With the flexible parameter passed from Power Apps, run the ARM template deployment using the Azure Resource Manager deployment action. All the parameters used for this action are like:
outputs('ParametersInJson')?['resourceGroupName'],outputs('ParametersInJson')?['deploymentName'],outputs('ParametersInJson')?['vmName'],outputs('ParametersInJson')?['vmAdminUsername'] andoutputs('ParametersInJson')?['vmAdminPassword'].
Also, notice that the Wait for Deployment field value is set to No. I’ll discuss it soon.
Once this action is run, the result should be returned to Power Apps through the Response action. The following screenshot shows how it uses the output of the ARM deployment action with JSON schema.
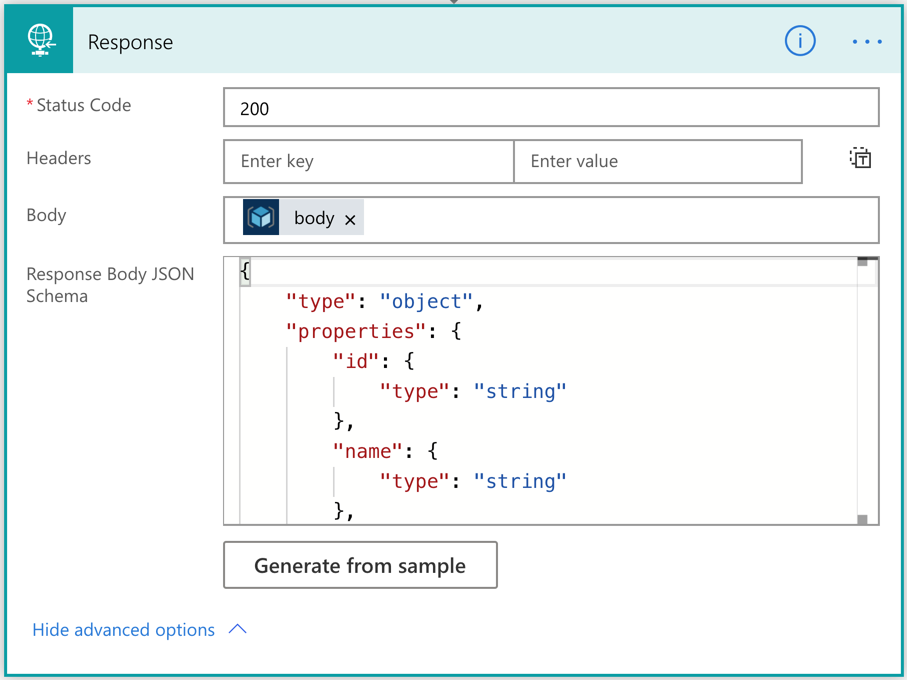
Now, we’ve created the workflow for Azure resource provisioning.
By the way, we need to consider the nature of this action. It takes from 30 seconds to 40 minutes or longer that completes the resource provisioning. As Power Apps can’t wait for it, the workflow should be running asynchronously. Did you remember that the Wait for Deployment field has been set to No in the previous action? The actual response has the status code of 201, not 200, because of this option.
How can we check the result of the resource provisioning? Let’s build another workflow for it.
Power Automate Workflow – Azure Resource Provisioning Status Check
This time, let’s build another workflow that checks the resource provisioning status. It only checks the status. We also use the same approach above to take the parameters from the Power App instance.
And let’s use the action to check the provisioning status. All the relevant variables look like:
outputs('ParametersInJson')?['resourceGroupName'] andoutputs('ParametersInJson')?['deploymentName']
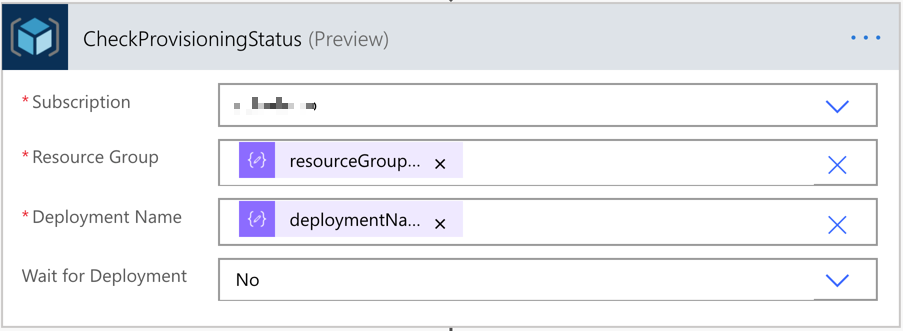
The last action is the Response action that sends the action response back to Power Apps.
We’ve now got two workflows for the resource provisioning. Let’s build the Power Apps now.
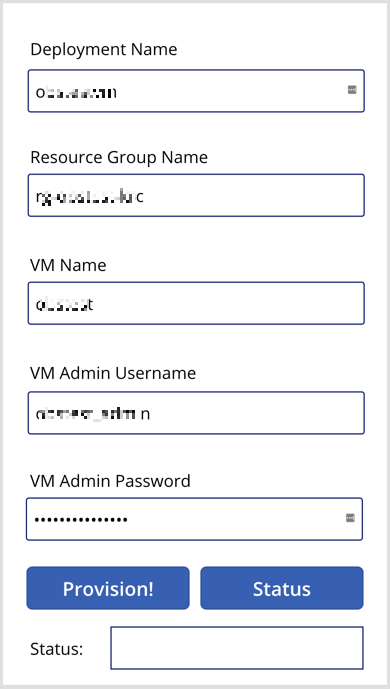
Power Apps – Ad-hoc Azure Resource Provisioning
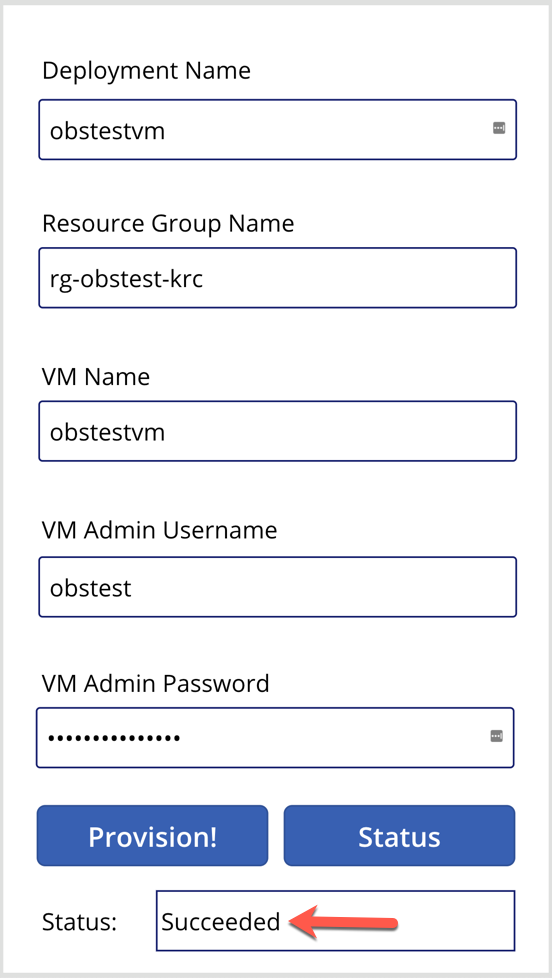
The layout of the app that IT pros in your organisation will use might look like the following. It accepts five parameters from the user, which will be used for both Power Automate workflows. One button starts the resource provisioning, and the other button checks the provisioning status.
Connect the resource provisioning workflow to the Provision! button and define the button action like below.
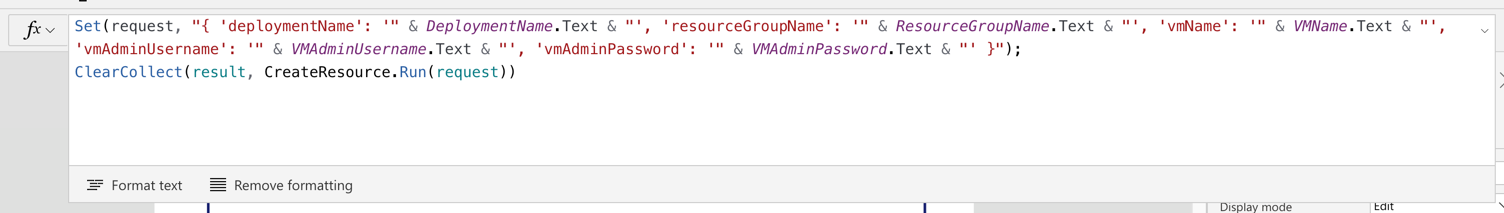
Note that we use the Set() function this time. With this function, we create a temporary variable of request and assign the JSON object as its value. Then, the request value is sent to the Power Automate workflow via the CreateResource() function. The request object will be decomposed to a JSON object in the Power Automate workflow. And the response of this function is stored to the result collection, using the ClearCollect() function.
    Set(request, "{ 'deploymentName': '" & DeploymentName.Text & "', 'resourceGroupName': '" & ResourceGroupName.Text & "', 'vmName': '" & VMName.Text & "', 'vmAdminUsername': '" & VMAdminUsername.Text & "', 'vmAdminPassword': '" & VMAdminPassword.Text & "' }");
    ClearCollect(result, CreateResource.Run(request))
As mentioned above, the resource won’t be instantly provisioned as soon as we tap the Provision! button. Therefore, we should use the Status button to check the provisioning status.
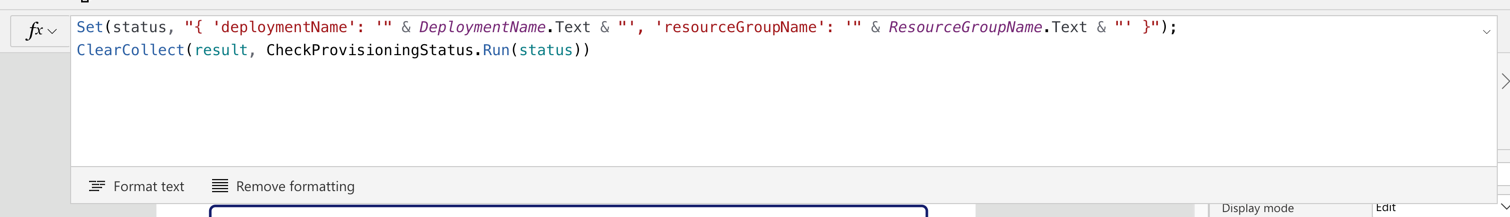
Similar to the approach above, we use the Set() function to initialise the status variable and send it to Power Automate through the CheckProvisioningStatus() function. Then the result will be stored to the result collection.
    Set(status, "{ 'deploymentName': '" & DeploymentName.Text & "', 'resourceGroupName': '" & ResourceGroupName.Text & "' }");
    ClearCollect(result, CheckProvisioningStatus.Run(status))
I use the Status button for simplicity. But you can make use of the Timer control for a more meaningful way, which is beyond the discussion of this article.
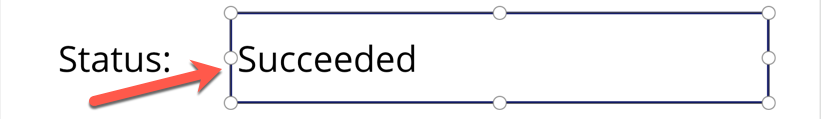
Finally set the label control to take the result from the workflow like First(result).properties.provisioningState, using the First() function.
We’ve now got the Power App, too! Let’s run the Power App with the actual value.
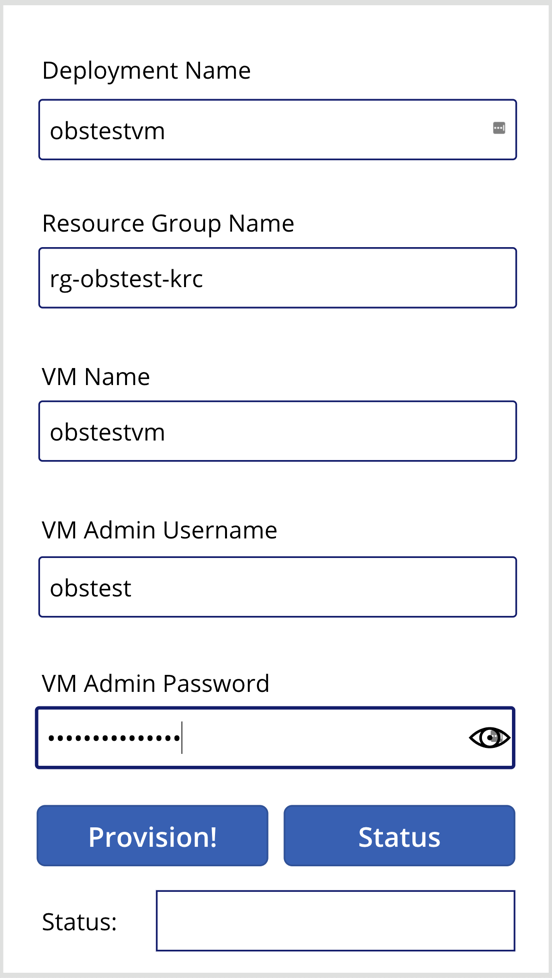
The first response from the provisioning will be like this:

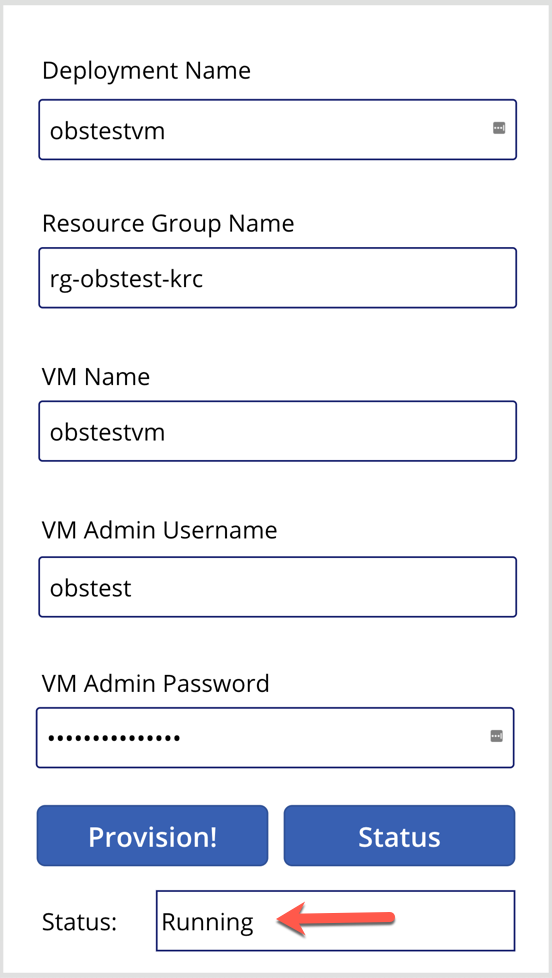
In the middle of the provisioning, the status will look like this:
And after the resource provisioning is complete, the status will look like this:
So far, we’ve walked through how we built Power Automate workflows and Power Apps for ad-hoc Azure resource provisioning. We only used one use case here for simplicity, but there are more complex real-world examples with many ad-hoc scenarios in your business domain. If you can materialise those scenarios based on priority and frequency, it will increase productivity for sure.
This article was originally published on Dev Kimchi.
by Scott Muniz | Sep 6, 2020 | Azure, Technology, Uncategorized
This article is contributed. See the original author and article here.
Special thanks to “Yaniv Shasha” and “Ofer Shezaf” that collaborating with me on this blog post and thanks to “Clive Watson” and “Kieran Bhardwaj” for their support.
Introduction
During recent Azure Sentinel workshops some customers have asked for the possibility to ingest Vulnerability data into Azure Sentinel. In this blog, I will explain how to ingest and analyse vulnerability data in Azure Sentinel. I’m using Tenable as an example, but it can be any Threat & Vulnerability Management (TVM) platform.

Before explaining how the Tenable vulnerability management solution integrates with Azure Sentinel, it is very important to understand the use case of each one of those solutions.
First, what is a vulnerability management solution?
A vulnerability management solution enables enterprises to discover and mitigate potential vulnerabilities on their networks.
To do so, vulnerability management solutions provide continuous asset discovery, assessment (vulnerability and compliance), reporting and analysis prioritization capabilities. In other words, vulnerability management solutions scan for potential vulnerabilities, alerts your security team, and help them prioritize the remediations tasks.
Now that we understand what a vulnerability management solution is, why should vulnerability management solutions become a critical part of your SIEM/SOAR platform?
Asset information such as operating system services and vulnerabilities are critical for enriching events. Your SIEM can use Tenable’s data to get asset information. Let me give an example: a SIEM solution can help determine not only whether there is traffic from an identified malicious internet location, but also whether this traffic goes to a vulnerable asset. This can both increase the severity of an incident in the SIEM system and provide feed back to the vulnerability management solution to prioritize vulnerability remediation for the vulnerable machine.
So, let’s move to our main topic: How to automate vulnerability management using Azure Sentinel.
Scenarios
Let’s assume that your security team wants to collect data from Tenable vulnerability management solution to:
- Discover and identify all the assets in their environments attack surface before they can start to adequately protect it.
- Identify vulnerabilities, misconfigurations and other weaknesses.
- Understand vulnerabilities in the context of business risk and use that data to prioritize their efforts.
- Show successful remediation of vulnerabilities and misconfigurations.
- Correlate vulnerabilities with other data stored in Azure Sentinel like (Security Events).
In order to implement this scenario and workflow already described, Azure Logic Apps are your friend. :)
The playbooks (based on a Logic App) described in this post were created to allow Azure Sentinel customers to import Tenable data. These playbooks, however, can easily be modified to point to any other TVM solutions.
Prerequisites
- How to onboard Azure Sentinel: see here
- How to get Tenable.io vulnerability management up and running: see here
- Tenable.io API Key: see here
- Tenable.io API Ref: see here
- Configuring security playbook using Azure Logic Apps: see here
Data Ingestion
Security SaaS vendors like Tenable.io have an API you can authenticate to and query vulnerability results for based on a datetime. You will have to write some code or use a logic app to query the API and send the results to Azure Sentinel’s Data Collector API.
List of assets
This playbook performs the following steps:
- Trigger on a defined schedule.
- Read data from Tenable.io API https://cloud.tenable.com/workbenches/assets
- Retrieve the list of discovered assets with information (OS, ID, IP, FQDN and source of detection).
- Transform the data into the appropriate JSON format.
- Send the result to Azure Sentinel Log Analytics.

Once your data is connected, you can start analysing the data.
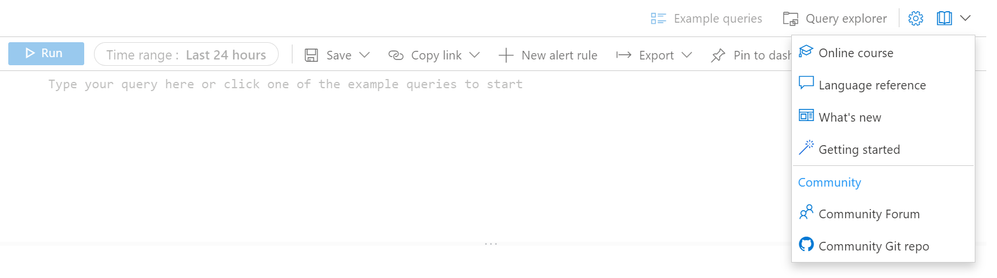
The rich query language used by Azure Sentinel called KQL, enables you to create advanced and complex queries in just a few lines. Here the link to KQL documentation – https://docs.microsoft.com/azure/azure-monitor/log-query/query-language
Let’s run a simple query to display the list of assets discovered by Tenable:
Tenable_Assets_Details_CL

| extend IP = extract("[0-9]{1,3}.[0-9]{1,3}.[0-9]{1,3}.[0-9]{1,3}",0, ipv4_s)

| extend Last_seen = last_seen_t

| summarize arg_max(last_seen_t, *) by id_g

| extend Asset_ID = id_g

| where IP != ""

| extend Detection_source = extract(".*: "(.*)",",1, sources_s)

| extend Operating_system = extract(""([a-zA-Z]*)"",1, operating_system_s)

| extend FQDN = extract(""(.*)"",1, fqdn_s)

| project TimeGenerated, Last_seen, Asset_ID, IP, Operating_system, FQDN, Detection_source

List of machines and associated vulnerabilities
This playbook performs the following steps:
- Trigger on a defined schedule.
- Read data from Tenable.io API to get the list of vulnerable assets: https://cloud.tenable.com/workbenches/assets/vulnerabilities
- Transform the data into the appropriate JSON format.
- For each asset ID, use another http action to get the list of vulnerabilities associated. https://cloud.tenable.com/workbenches/assets/asset_id/vulnerabilities
- Send the result to l Log Analytics.
Please see the playbook code in our Github: https://github.com/Azure/Azure-Sentinel/tree/master/Playbooks/Get-TenableVlun

Let’s run a simple query to display the list of assets with associated vulnerabilities:
let Sev = datatable (Severity:int, severity:string)

    ["4", "Critical",

     "3", "High",

     "2", "Medium",

     "1", "Low",

     "0", "Info"] ;

Sev

| join (

    Vulns_AssetID_List

) on Severity

| project TimeGenerated, AssetID_g, VulnID_s, VulnName_s, plugin_family_s, severity

Additional Playbooks can be implemented to collect more data from Tenable, like recommended solutions to remediate vulnerabilities: https://cloud.tenable.com/solutions
Vulnerability management dashboard
Based on data collected using previous steps, I created a dashboard to help security teams determine the risk to their organization.
Analysts now can accurately characterize the risk to the organization from specific vulnerabilities. The data that analysts can rely upon from this dashboard are vulnerabilities that were found across a multitude of vectors from active scanning and from host analysis mined from systems.
Asset management view
Assets within an organization are moving, joining, and leaving a network daily, which can be difficult to manage properly. Organizations that have an accurate asset management system can gain complete visibility on what devices are in use, and what operating system is installed on the network.

List of vulnerabilities with severity and state

Summary chart tracking unmitigated vulnerabilities of low, medium, high, and critical severity

Assets with associated vulnerabilities

Risk management
Tenable calculates a dynamic Asset Exposure Score (AES) for each asset on your network to represent the asset’s relative exposure as an integer between 0 and 1000. A higher AES indicates higher exposure.
Tenable calculates AES based on the current Asset Criticality Rating score (ACR, Tenable-provided or custom) and the severity associated with the asset.

Recommended solutions
Tenable provides recommended solutions for all vulnerabilities on your network.
Information about each solution includes:
- Description of the solution
- Asset affected, and the total number of assets affected by the vulnerabilities included in the solution.
- Common Vulnerabilities and Exposures (CVE ) count, the CVEs included in the solution.
- Common Vulnerability Scoring System (CVSS ), the highest CVSSv2 score (or CVSSv3 score, when available) for the vulnerabilities addressed by the solution.

Detection rule (Brute Force RDP Attack on vulnerable machine)
In this use case, my goal is to identify the machines at risk (with vulnerabilities) on which we saw an RDP brute force attack (based on security events generated from the server).
I installed a virtual machine (‘honeypot’ Windows machine in this example but this could also be Linux for SSH brute force attacks) in Azure IaaS (Infrastructure as a Service). In the Networking configuration, I add an ‘Inbound port rule’ with Destination port 3389 allowed.
I create an inbound rule (any-any) using port 3389 port so that malicious RDP connections will come in. This can be verified in the Windows Event Viewer (Event ID 4625 – An account failed to logon).
Another option to detect Brute Force is to leverage Azure Security Center: https://azure.microsoft.com/en-us/blog/how-azure-security-center-detects-ddos-attack-using-cyber-threat-intelligence/
Then alerts generated by ASC (Azure Security Center) can be sent to Azure Sentinel and correlated with other data like vulnerability.
First, I started with the Brute Force detection rule. Personally, I always create and fine-tune a rule via the Logs section and verify the attributes we want to use for entities. Entities are required for investigation and dashboards. For example:
let threshold = 5;

SecurityEvent

| where EventID == "4625"

| project Computer, Account, IpAddress, TimeGenerated

| summarize PerHourCount = count() by IpAddress, bin(TimeGenerated, 1h), Account, Computer

| where PerHourCount > threshold

| summarize StartTime = min(TimeGenerated), EndTime = max(TimeGenerated), UserList = make-set(Account), Failure = sum(PerHourCount) by RemoteIP = IpAddress, Computer

| project StartTime, EndTime, Computer, RemoteIP, UserList, Failure

| extend IPCustomEntity = IpAddress, AccountCustomEntity = UserList

| extend HostCustomEntity = Computer
Once the rule was created, I waited for the first incident to appear in the Overview or Incidents page

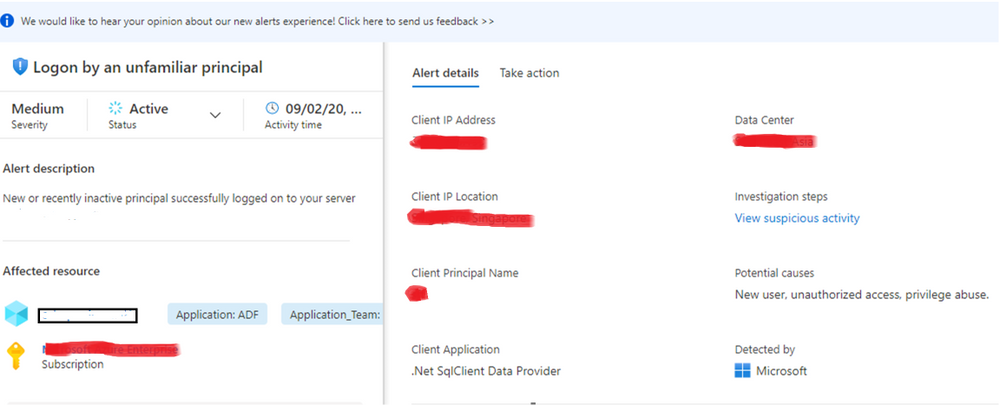
After we receive an incident, we can select the incident to see the incident details. A further option is to select the investigate button to get a graphical overview of the incident for analysis, or to select “View Full Details” to see the raw data.

The next step is to correlate Brute Force detection with vulnerability data to identify machines at risk.
For this use case here what I used as detection rule:
let Severity = datatable (severity_s:string , severity:string)

    ["4", "Critical",

     "3", "High",

     "2", "Medium",

     "1", "Low",

     "0", "Info"] ;

let High_vuls = Severity

| join (

    Vulns_AssetID_List_CL) on severity_s

| summarize arg_max(TimeGenerated, *) by IP_s, VulnID_s

| extend Asset_IP = IP_s

| where severity in ("Critical", "High", "Medium") ;

// Brute force detection

let threshold = 5;

let Brut_force= SecurityEvent

| where EventID == "4625"

| project Computer, Account, IpAddress, TimeGenerated

| summarize PerHourCount = count() by IpAddress, bin(TimeGenerated, 1h), Account, Computer

| where PerHourCount > threshold;

Brut_force

// Joint brute force with vulnerability info

| join kind=inner (High_vuls) on Asset_IP

| summarize StartTime = min(TimeGenerated), EndTime = max(TimeGenerated), UserList = make-set(Account), VulnsIDList = make-set(VulnID_s), VulnsNameList = make-set(VulnName_s) by RemoteIP = IpAddress, Computer

| extend IPCustomEntity = IpAddress, AccountCustomEntity = UserList

| extend HostCustomEntity = Computer
After we receive an incident, we can select the incident to see the incident details.

With the entity Account we know the username used by the attackers to try to logon.

I regrouped all accounts in a list called « UserList »
Mitigation
As you have seen in this blog, we can address real-world use cases by integrating vulnerability data into Azure Sentinel, showing how easy it is to create detection rules and visualizations. Although mitigation can be done using different methods, if you are using Azure Security Center, we recommend implementing the following remediation/preventative steps:
- Password Policy: Attackers usually launch brute-force attacks using widely available tools that utilize wordlists and smart rulesets to intelligently and automatically guess user passwords. So, the first step is to make sure to utilize complex passwords for all virtual machines. A complex password policy that enforces frequent password changes should be in place. Learn more about the best practices for enforcing password policies.
- Endpoints: Endpoints allow communication with your VM from the Internet. When creating a VM in the Azure environment, two endpoints get created by default to help manage the VM, Remote Desktop and PowerShell. It is recommended to remove any endpoints that are not needed and to only add them when required. Should you have an endpoint open, it is recommended to change the public port that is used whenever possible. When creating a new Windows VM, by default the public port for Remote Desktop is set to “Auto” which means a random public port will get automatically generated for you. Get more information on how to set up endpoints on a classic Windows virtual machine in Azure.
- Enable Network Security Group: Azure Security Center recommends that you enable a network security group (NSG) if it’s not already enabled. NSGs contain a list of Access Control List (ACL) rules that allow or deny network traffic to your VM instances in a Virtual Network. An endpoint ACL allows you to control which IP address, or CIDR subnet of addresses, you want to allow access over that management protocol. Learn more about how to filter network traffic with network security groups and enable Network Security Groups in Azure Security Center.
- Using VPN for management: A VPN gateway is a type of virtual network gateway that sends encrypted traffic across a public connection to an on-premises location. You can also use VPN gateways to send encrypted traffic between Azure virtual networks over the Microsoft network. To send encrypted network traffic between your Azure virtual network and on-premises site, you must create a VPN gateway for your virtual network. Both Site to Site and Point to Site gateway connections allow us to completely remove public endpoints and connect directly to the Virtual Machine over secure VPN connection.
Summary
We just walked through the process of standing up Azure Sentinel Side-by-Side with Tenable. Stay tuned for more Side-by-Side details in our blog channel.


Recent Comments