What is shutting down my Azure Virtual Machine?

What is shutting down my Azure Virtual Machine?

This article is contributed. See the original author and article here.

Recently I came across a scenario where someone had changed the time on a scheduled Azure virtual machine shut down, but the VM was not adhering to the shut down new time.. Learn how asking the wrong question can cause you to miss the answer!


Background – the change
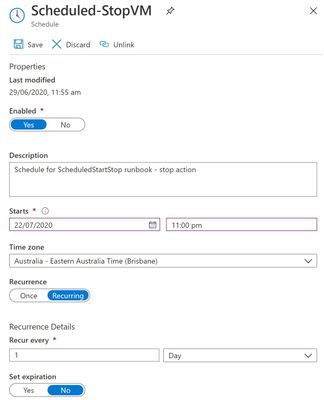
The systems administrator had an Azure Automation Runbook in place that told the Azure Windows Server virtual machine to shut down at 10pm each night. After changing the script to 11pm, the admin noticed that the server was still shutting down at 10pm.


Scheduled-StopVM.jpg


So they started to investigate the wrong question …

“Why isn’t the VM acknowledging the changed time in the updated schedule?”


The importance of broader questions
With this question, we’re assuming part of the cause – that the VM is controlled by the Azure Automation Runbook but somehow doesn’t realize there has been an updated change to the schedule. We could wrack our brains & comb through logs for days, without answering this question. Why? Because it’s the wrong question to ask.


A better question
Instead, let’s rephrase the problem a little broader.
“WHY is the VM shutting down at 10pm?”


Notice I didn’t say “why is the VM still shutting down at 10pm”. I want to set aside for a moment any past behavior versus expected new behavior and instead go exploring some of the reasons why a virtual machine would shut down.

Shut down causes/triggers
Let’s brainstorm a few “usual suspects” that might shut down a VM:
1. Azure Automation  – yes, that’s what we were first looking at. Has it saved correctly? Are there any other runbooks executing first?
2. Windows Update – settings on the server itself, Azure Update Management, or even a third party management tool (though in none of those scenarios would I expect it to happen every day, but I have seen stranger things!).
3. Azure Dev/Test Labs – These pre-configured Azure Resource Manager templates let you specify auto shutdown (and auto start) times and policies for your Azure VMs.
4. Something else controlling that server – think of a local script, application or third party management tool. Could the cause of the shut down be inside the VM itself and not related to Azure?


See if you can identify something I’ve left off this list, on purpose!


Analyzing the shut down event
Now I have a few ideas outside the scope of just that one script, it’s time to go and look at the facts.


Starting with the Windows Server event log, it tells me that a shut down event was initiated at 2200hrs. Yeah, no kidding. But it’s not very good at tell me what initiated it. This gives me a clue that it may be a factor outside of the server OS.


Next, I’ll check the VM’s Activity log in the Azure portal. This logs subscription-level events, including those triggered by Azure Policy. Now we can see that “Azure Lab Services” initiates our shut down events at 10:00pm daily – as well as our . That is not our Azure Automation Runbook.


ActivityLog_ShutdownEvents.jpg


This server is not part of an Azure Dev/Test Lab though, so what have we missed?


Auto-shutdown support for Azure VMs
One place we didn’t look was the Operations section of the Azure VM, in the Azure Portal. Nestled in with Azure Bastion connection, Backup, Policies etc. (relevant to this machine), is the Auto-shutdown section!

And here we’ve found the cause of our shutdowns.

AutoShutdown.jpg

The properties of the Virtual Machine had been configured to shut down the VM daily at 10pm. 


Summary
If you’ve ever scratched your head over a problem, only to have someone else quickly find the cause … welcome to the human race! Sometimes our troubleshooting questions lead us in a defined direction, missing the clues that we actually need. So the next time you’re faced with a problem, step back and look at what questions you are asking to try and solve it, and what assumptions they may contain.


Learn more with our Introduction to Azure Virtual Machines, on Microsoft Learn.


Ingest ProxySQL Metrics into the Azure Monitor Log Analytics Workspace

Ingest ProxySQL Metrics into the Azure Monitor Log Analytics Workspace

This article is contributed. See the original author and article here.


ProxySQL have rich internal functioning metrics which could be accessed from its stats database through the Admin interface, and the stored metrics are the snapshot of a particular point of time when you select the metric table. When troubleshooting the problem, we need to review and accumulate the historical metrics data with powerful query functions like Azure Monitor Kusto Queries to help understand the overall status. In this blog, we will introduce how to post the metrics to Azure Monitor Log Analytics Workspace and leverage the powerful Kusto query language to monitor the ProxySQL statistics metrics.

Access the ProxySQL Metrics for Monitoring:

1. Connect the ProxySQL Admin interface through any client using MySQL protocol with the admin credential like below:

mysql -u admin -padmin -h 127.0.0.1 -P6032

2. Access the statistics metrics by select query like below example:

select Client_Connections_aborted from stats.stats_mysql_global

3. Please refer the metrics detail in https://proxysql.com/documentation/stats-statistics/, there are 18 stats tables storing important monitoring data viz the front end and backend connections, query digest, GTID, prepared statements and etc.

Note: ProxySQL is an open source community tool. It is supported by Microsoft on a best effort basis. In order to get production support with authoritative guidance, you can evaluate and reach out to ProxySQL Product support.

Ingest the Metrics to external monitoring tool – Azure Monitor:

1. Assume you have installed ProxySQL on a Linux VM already, as the Admin interface is only allowed to access locally, we need to run the ingestion code side by side on the same VM. The ingestion sample code will query the ProxySQL stats metrics then post the data to the Logical Workspace in a regular 1-minute interval.

2. Provision a Log Analytics Workspace to store the posted metrics. The Ingestion sample code performs POST Azure Monitor custom log through HTTP REST API: https://docs.microsoft.com/en-us/azure/azure-monitor/platform/data-collector-api

3. The ingestion sample code is developed with .NET Core 3.1, and you could check out from the GitHub repo https://github.com/Azure/azure-mysql/tree/master/ProxySQLMetricsIngest.

Detail usage instructions about the sample ingesting code:

1. Install .NET Core on the Linux VM where ProxySQL is located.

Refer to https://docs.microsoft.com/dotnet/core/install/linux-package-manager-ubuntu-1804


wget -q https://packages.microsoft.com/config/ubuntu/18.04/packages-microsoft-prod.deb -O packages-microsoft-prod.deb

sudo dpkg -i packages-microsoft-prod.deb

sudo add-apt-repository universe

sudo apt-get update

sudo apt-get install apt-transport-https

sudo apt-get update

sudo apt-get install dotnet-sdk-3.1

2. Get the Custom ID and Shared Key of the Log Analytics Workspace

1)      In the Azure portal, locate your Log Analytics workspace.

2)      Select Advanced Settings and then Connected Sources.

3)      To the right of Workspace ID, select the copy icon, and then paste the ID as the value of the Customer ID input for the sample application input.

4)      To the right of Primary Key, select the copy icon, and then paste the ID as the value of the Shared Key input for the sample application input.

3. Checkout the sample code and run:

git clone https://github.com/Azure/azure-mysql

cd ProxySQLMetricsIngest/

dotnet build

sudo dotnet run

Here are some details about the sample:

1)      It is a console application which will ask for the input of the connection string for ProxySQL Admin Interface, (Log Workspace) custom ID and Shared key.

2)      The sample currently register a 1-minute timer to periodically access the ProxySQL stats tables through MySQL protocol and post data into the Log Analytics Workspace

3)      Each ProxySQL stats table name would be used as the Custom Log Type Name, and the Log Analytics will automatically add _CL suffix to generate the complete Custom Log Type Name. For example, the stats table stats_memory_metrics will become stats_memroy_metrics_CL in the Custom Logs list. Below is the example screenshot within the Log Analytics Workspace.


blog_pic_1.png


4)      The sample code also post the error logs in /var/lib/proxysql/proxysql.log to the Log Analytics Workspace as Custom Log Type: PSLogs_CL, to get the file read permission, please execute “sudo dotnet run”. 

4. Use Kusto query in Log Analytics Workspace to operate the ProxySQL metrics data.

Please be noticed that all the ProxySQL stats table values are set to string, so need convert it to number in Kusto query. Below is the example to render a time chart of the memory usage about ProxySQL internal module SQLLite.

blog_pic_2.png


Disclaimer: This sample code is available AS IS with no warranties and support from Microsoft. Please raise an issue in Github if you encounter any issues and I will try our best to address it.


If you have trouble setting up ProxySQL on Azure Database for MySQL, please contact the Azure Database for MySQL team at AskAzureDBforMySQL@service.microsoft.com

Azure Feature Pack 1.19.0 released with Azure Storage SAS authentication support

This article is contributed. See the original author and article here.

Dear SSIS Users,


Azure Feature Pack 1.19.0 is here with an updated Azure Storage connection manager. Now you can configure Azure Storage connection manager to authenticate with shared access signature, and use it in Flexible File Task/Source/Destination.


This new version of Azure Feature Pack is pre-installed on Azure-SSIS integration runtime. To install elsewhere, you can download installation packages from the following links:

Microsoft Learning content available for Azure HDInsight

Microsoft Learning content available for Azure HDInsight

This article is contributed. See the original author and article here.

This post is authored by @Mimi Gentz, Senior Product Manager at Microsoft.


You may have heard that Microsoft has a free learning platform that offers interactive material to help you up-level your skills. But did you know Azure HDInsight has a whole learning path, with over three hours of material available for you to learn how Azure HDInsight can meet your businesses growing need for analytics?


Whether you’re new to cloud scale analytics, interested in migrating your on-premises analytics to the cloud, or even if you’ve gone in depth with one of the open source technologies Azure HDInsight integrates with, this course will show you the benefits of using each of the cluster types available on Azure HDInsight, what scenarios work best with each technology, and how to integrate those technologies with visualization tools such as Power BI and Jupyter Notebooks.


There are currently six modules in the Building Open Source Software (OSS) Analytical Solutions with Azure HDInsight learning path (with more to come), and in this blog we’ll take a look at what you’ll learn in each one. Think of a module as a chapter in a book, and the learning path as the whole book. Throughout each module you’ll complete tutorials, read, and fill in short quizzes to check your learning.


Keep in mind that you can complete these modules at your own pace. Once you create a Learn profile and sign-in, your progress will be automatically tracked by the Learn site, and you’ll earn XP (experience points) as you go. As you complete modules and learning paths, you’ll earn badges and a trophy that you can share on social media to impress all your friends!


hdinsight-badges-trophies-learn.png

What will you learn in each module?

  1. In the Introduction module, you’ll learn how analytics (using open-source frameworks such as Hadoop, Apache Spark, Apache Hive, Interactive Query, and Apache Kafka) is implemented within Azure HDInsight, how storage and processing are decoupled (to save you money), and how Azure HDInsight, unlike its competitors, has a unique ability to support business processes that require multiple workloads.


  1. In the Choose the correct HDInsight Configuration to build open-source analytics solutions module, you’ll learn which HDInsight cluster type to select to best support your scenario and which processing and analysis business requirements Azure HDInsight supports. Additionally, you’ll walk through a sample case study to determine the best HDInsight cluster configuration to choose, and you’ll learn about some of the cost saving measures HDInsight provides.


  1. In the Creating and configuring a HDInsight cluster module, you’ll create an Azure HDInsight cluster in the Azure portal, create a Jupyter notebook that is linked to that cluster, run some queries on the data to create visual representations, monitor your cluster, and learn how to troubleshoot common issues.


  1. In the Perform advanced streaming data transformations with Apache Spark and Kafka in Azure HDInsight module, you’ll learn about common scenarios where Kafka and Spark can be used for real-time analytics and structured streaming, you’ll create a VNet and add a Spark and Kafka cluster to it, then you’ll create a Kafka producer and stream the data into a Jupyter notebook.
  2. In the Perform Zero ETL analytics with HDInsight Interactive Query module, you’ll learn how Interactive Query is great for ad-hoc analytics with minimal transformations, you’ll create an Interactive Query cluster in the Azure Portal, upload data using Data Analytics Studio, explore Hive tables using a Zeppelin notebook, and create a Power BI dashboard for evaluating real estate trends in the sample data.  


  1. In the Manage enterprise security in HDInsight module, you’ll learn about the shared responsibility model, Network Security Groups (NSGs), HDInsight Service Tags, VNets, operating system security, authentication with AAD and MFA, authorization of specific actions and operations, data access security, Transport Layer Security (TLS) 1.2, virtual network service endpoints, and customer-managed keys. 

blog-image.png


Get started by going to Building Open Source Software (OSS) Analytical Solutions with Azure HDInsight and starting your learning path today. Feel free to post your feedback, issues, or requests about HDInsight learning content to this page or via the Feedback channel.


Thanks,

Mimi


Azure HDInsight Twitter | Documentation | Service Updates

Mimi Gentz Twitter | Linked In | Docs Achievements and Trophies


Azure Service Fabric 7.1 Second Refresh Release

This article is contributed. See the original author and article here.

The Azure Service Fabric 7.1 second refresh release includes bug fixes, and performance enhancements for standalone, and Azure environments has started rolling out to the various Azure regions. The updates for .NET SDK, Java SDK and Service Fabric Runtime is available through Web Platform Installer, NuGet packages and Maven repositories in 7-10 days within all regions.

  • Service Fabric Runtime
    • Windows – 7.1.428.9590
    • Ubuntu –  7.1.428.1
    • Service Fabric for Windows Server Service Fabric Standalone Installer Package – 7.1.428.9590           
  • .NET SDK
    • Windows .NET SDK –  4.1.428
    • Microsoft.ServiceFabric –  7.1.428       
    • Reliable Services and Reliable Actors –  4.1.428
    • ASP.NET Core Service Fabric integration –  4.1.428
  • Java SDK –  1.0.6


Key Announcements

Potential 7.1 Deployment Failures:

  • Cause: SF 7.1 introduced a more rigorous validation of security settings; in particular, requiring that settings ClusterCredentialType and ServerAuthCredentialType have matching values. However, existing clusters may have been created with ‘x509’ for the ServerAuthCredentialType and ‘none’ for the ClusterCredentialType.
  • Impact: In the case mentioned above, attempting an upgrade to SF71CU1 will cause the upgrade to fail.
  • Workaround: No workaround exists for this issue, as the ClusterCredentialType is immutable. If you are in this situation, please continue using SF70 until the SF71CU2 release becomes available.

For more details, please read the release notes.