This article is contributed. See the original author and article here.
As enterprise workloads become more agentic, the expectations of ERP systems—and the teams that operate them—are shifting. Batch jobs, workflow orchestration, data import/exports, and background processes are no longer “just” technical plumbing–they are critical pieces of the operational fabric. They deliver timely financial results, accurate supply chain data, and reliable business intelligence driving process optimization.
To support this shift, observability needs to evolve beyond simple logs and reactive troubleshooting. Observability needs to provide meaningful insights into execution behavior, performance patterns, and operational context. This ensures IT teams can run ERP with confidence and reliability.
In Dynamics 365 ERP apps, we’ve long provided integration with Azure Application Insights to help organizations collect telemetry about user activity, failures, and application behavior. Now, with the expansion of batch telemetry signals — including start/stop events, failure data, throttling conditions, thread availability, and queue behavior — administrators and IT architects can gain deeper visibility into the health of critical batch-based workloads.
Why Observability Matters Now
ERP observability historically focused on basic monitoring. It observed which jobs were running, whether a job failed, or whether alerts were triggered. These indicators are useful, but they lack operational context. Modern enterprise workloads are increasingly interconnected, and automation driven. Delays or failures in one workload can ripple outward, affecting downstream processes, reporting accuracy, and service delivery.
At the same time, teams are beginning to rely on AI agents to help monitor, diagnose, and in some cases suggest remediation steps. These tools need high-quality signals to be effective.
Batch workloads are a prime example. Batch jobs directly impact business outcomes, from overnight posting to inventory sync and settlements.
Without execution insights, teams guess root causes and waste time on manual investigation.
What Batch Telemetry Brings to the Table
The monitoring and telemetry capabilities in Dynamics 365 ERP enable customers to send application telemetry to Azure Application Insights for analysis and alerting. The recent expansion of telemetry signals for batch workloads builds on this foundation by adding behavioral data specifically for batch execution patterns.
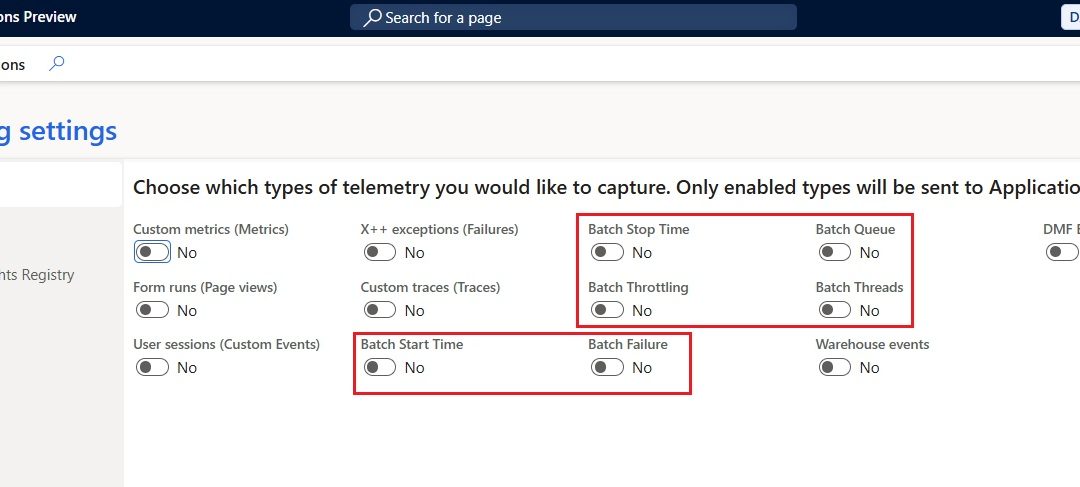
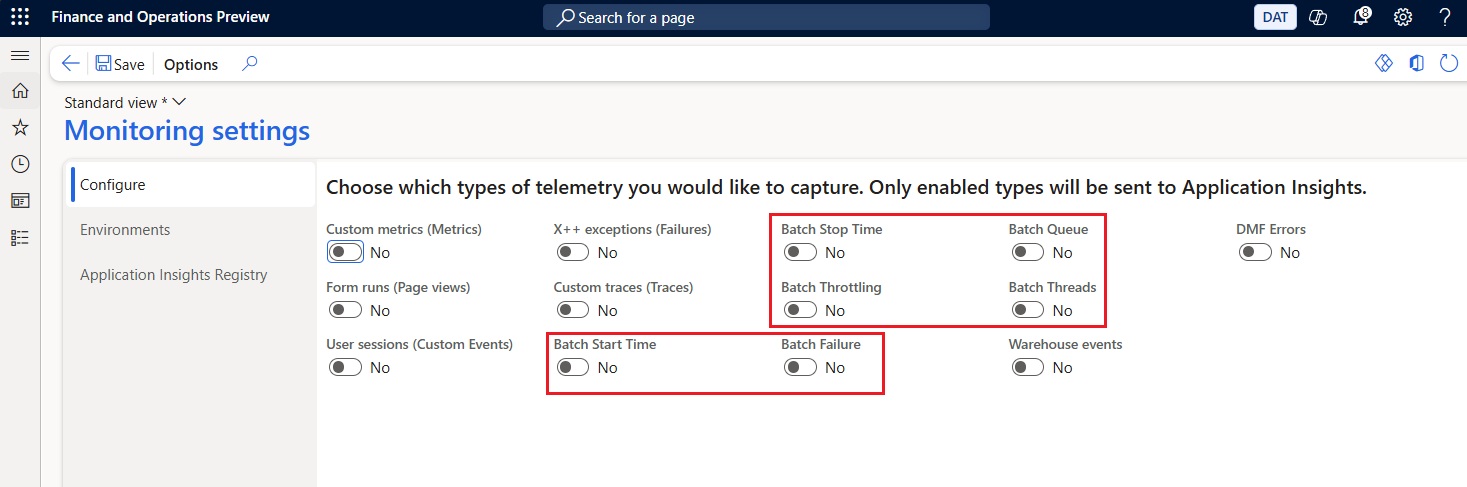
These signals include:
- Batch start and stop events to show how long jobs take to run, not just whether they completed.
- Failure information that correlates with info log entries and execution context.
- Throttling indicators that highlight contention due to system load.
- Thread availability data that helps reveal when jobs are waiting because capacity is constrained.
- Queue depth metrics shows number of waiting tasks for all queues that are part of the Priority Based Scheduling queues.
Emitting these signals into a customer-owned Application Insights resource means teams can apply their existing monitoring pipelines, dashboards, and alerting logic without changing how data is consumed.
From Visibility to Insight
Once batch telemetry data flows into Application Insights, teams can query it using Kusto Query Language (KQL) and build dashboards that correlate workload behavior with other operational metrics.
This richer observability enables several practical outcomes:
- Faster investigation of execution behavior without sifting through logs.
- Trend analysis to detect regressions or capacity bottlenecks before they impact business cycles.
- More informed capacity planning based on actual observed patterns.
- Alignment of SLA expectations with real operational performance.
Here are some real‑world business scenarios that show how telemetry insights are helping customers troubleshoot issues and resolve problems faster.
A global consumer goods company frequently sees high priority jobs completing late. Batch Queue telemetry exposes queue congestion and thread exhaustion, showing when noncritical tasks bury priority workloads.
It helps surface when priority-based scheduling queues build up and delay time‑sensitive workloads, while also revealing misconfigured priorities that cause jobs to be processed out of order. It further enables teams to closely monitor queue health during cutover or high‑load events, ensuring critical workloads flow smoothly.
Similarly, a finance team’s bank reconciliation jobs remain “Waiting” for long periods. Thread telemetry reveals thread starvation—jobs were queued, but threads were fully consumed.
It helps explain why jobs remain stuck in a “Waiting” state by revealing when thread capacity is fully consumed by parallel workloads. It also highlights thread saturation patterns, enabling teams to right‑size AOS batch capacity for smoother, more predictable processing.
A Foundation for Intelligent Operations
The expanded telemetry signals are not just a diagnostic tool. They serve as a foundation for smarter operations in an era where agents play an increasing role. High-fidelity Batch telemetry enables experiences like:
- Automated detection of anomalies based on execution baselines.
- Correlation of workload performance with business-critical thresholds.
- Enhanced alerts that tie operational conditions to business impact.
By making execution behavior more observable and actionable, Dynamics 365 ERP helps teams focus on outcomes, not just symptoms.
Getting Started
If you haven’t already configured monitoring and telemetry for your environment, the first step is to integrate your Dynamics 365 ERP instance with Azure Application Insights – refer. Monitoring and telemetry overview – Finance & Operations | Dynamics 365 | Microsoft Learn .
Once telemetry is configured, expanded batch signals can be toggled on from within system administration and begin flowing to your Application Insights pipeline for analysis.
Rich observability is a core requirement for running modern ERP workloads, especially as organizations adopt more automation and begin exploring agent-assisted operational tooling. By bringing deeper insight into batch execution behavior, our ERP portfolio apps in Dynamics 365 helps IT teams move from reactive troubleshooting toward proactive reliability and informed decision-making.
For more details visit Available telemetry – Finance & Operations | Dynamics 365 | Microsoft Learn.
The post Building Smarter Observability for Agentic ERP World using Dynamics 365 appeared first on Microsoft Dynamics 365 Blog.
Brought to you by Dr. Ware, Microsoft Office 365 Silver Partner, Charleston SC.

Recent Comments