This article is contributed. See the original author and article here.
Introduction
Our customers want a simple way to bring the power of the cloud into their real-world operations to transform their businesses. At Microsoft, our goal is to give businesses the ability to project Azure to wherever they need it, whether it be the cloud, a data center, or an edge location like a retail store.
However, we know operating even modern hybrid cloud environments can be a complex undertaking. An array of disparate tools and technologies acquired over time and space often leaves customers to stitch it all together themselves. Our aim is to reduce that complexity with Azure-consistent infrastructure that simplifies the ability to take advantage of cloud-native technologies at the edge.
As part of this ambitious vision, we are evolving our flagship hyperconverged infrastructure offering, Azure Stack HCI, towards an increasingly cloud-native posture that leverages Azure Arc to meet the ever-changing needs of our customers. The result is a solution for businesses that simplifies operations, and allows our customers to use the same tools, app models, and control planes uniformly regardless of where their data and applications reside.
How Microsoft delivers a seamless cloud to edge solution with Azure Stack HCI
Unified and consistent operations across environments
Edge deployments are streamlined into a simplified turnkey experience driven centrally from the cloud, which minimizes the need for on-prem IT expertise.
Updates are one-click for the entire technology stack, closing the seams between hardware, firmware, drivers, OS, and agents. All updates are comprehensively validated for compatibility, interoperability, and reliability.
Support is at the solution level, providing a single point of contact experience for hardware, software, and cloud components.
Simplified application modernization
Applications are developed once and deployed and managed equally across environments.
Azure Arc-enabled Azure features and services such as Azure Kubernetes Services, Azure Virtual Desktop, Azure Arc-enabled data services, and Azure Arc-enabled VM Management easily extend from the cloud to the edge.
Centralized governance
On-premises resources are easily accessed, managed, and governed centrally through the Azure Portal.
Infrastructure is continuously monitored to ensure it stays in a validated state.
Azure’s policy management, threat protection, and security controls extend to on-premises infrastructure.
Announcing Dell APEX Cloud Platform for Microsoft Azure
To simplify the inherent complexity of cloud to edge, the unique breadth and depth of our partners extends Microsoft’s cloud services and software into customers’ environments around the world. With one of our key partners, we recently announced the Dell APEX Cloud Platform for Microsoft Azure, the first Azure Stack HCI solution of its kind, delivering integration and capabilities beyond the Validated Nodes and Integrated Systems in the Azure Stack HCI portfolio today.
Dell APEX Cloud Platform for Azure is the result of extensive engineering collaboration between Microsoft and Dell. It natively integrates with Azure Arc and Azure Stack HCI to provide a turnkey experience to customers, including simplified deployment, seamless management, and orchestration capabilities for hyperconverged infrastructure deployments. Building on Dell’s track record of delivering market-leading integrated infrastructure solutions with extensive software-driven management and orchestration (M&O) automation, this comprehensive solution enables IT admins and operators to focus less on managing the day-to-day operational tasks and more on innovation and achieving desired business outcomes. This integration gives customers a consistent operational model to run their application and data services across datacenter and edge and manage on-premises resources from the Azure portal with consistent security and governance.
Conclusion
We are excited for what’s to come with Azure Stack HCI as we keep building and transforming with our customers. To learn more about Azure Stack HCI, visit our page on Microsoft Learn.
For more information on Dell APEX Cloud Platform for Microsoft Azure, please visit Dell’s solution brief.
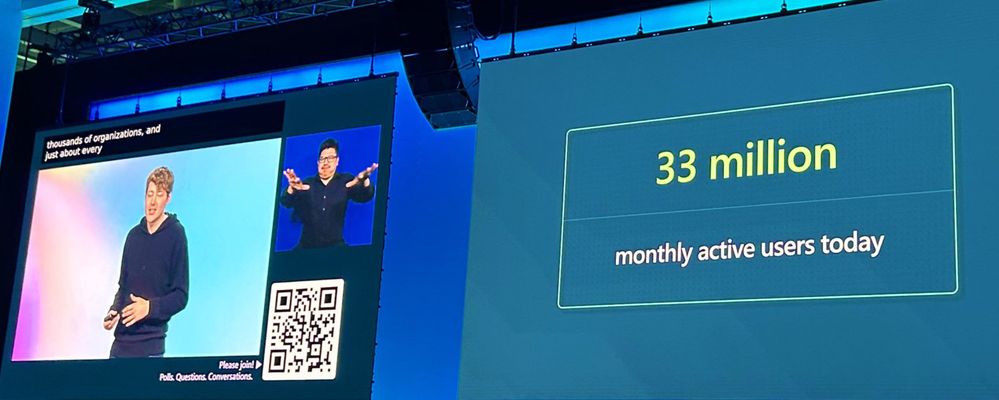
Sharing 33 million monthly active users of PowerPlatform, Charles Lamanna, MSBuild 2023 session
Saving Time and Effort with AI and Copilot The AI and Copilot experiences across the Power Platform offer numerous benefits, including time and effort savings for users. Whether you have an idea for automating a process or creating an app or website, AI can bring your vision to life more efficiently than ever before. By leveraging AI’s knowledge and the data you provide, the platform can generate customized experiences and suggest improvements to enhance your workflows and applications.
AI-Driven Automation of Invoice Processing To showcase the capabilities of Copilot and AI, we explore a common scenario: invoice processing. Traditionally, this involves manual data entry, approval workflows, and Excel spreadsheet management. With Copilot, users can build and automate basic workflows using natural language prompts, eliminating the need for extensive coding expertise. Copilot generates a preview flow within seconds based on the provided prompt, and users can customize the flow further or generate additional variants effortlessly. This automation extends to scoping the flow to invoice attachments, specifying approval steps, and updating Excel files automatically.
Harnessing AI Builder for Document Analysis AI Builder, a powerful tool within the Power Platform, offers forms processing capabilities for extracting data from documents like invoices. By integrating AI Builder with Copilot, users can extract approval justifications and automatically generate comprehensive emails. The extracted invoice details can be presented within the email, enabling seamless approval within Outlook. Additionally, the AI-generated flow can enter the approved invoice data into Excel, further streamlining the process.
Accelerating App Development with Copilot Copilot’s integration with Power Apps expedites app development processes. Users can import Excel files directly into Power Apps Studio, where Copilot processes the data and transfers it to a Dataverse environment. This enables scalable and centralized management of invoice data. Copilot automatically determines column headings and data types, simplifying the app creation process. The resulting app is fully functional, allowing users to browse, search, create new records, and customize the app effortlessly.
Building Professional Websites with Power Pages and Copilot Power Pages, coupled with Copilot, provides an efficient way to build professional websites. By using Copilot prompts, users can generate HTML, CSS, and contextually relevant images for website sections. Copilot’s assistance extends to content generation, including descriptive paragraphs and forms. The large language model’s ability to generate both code and text-based content streamlines the website development process significantly.
Enhancing Chat Experiences with Power Virtual Agents and AI The integration of Power Virtual Agents and Copilot empowers websites with intelligent chatbot capabilities. Power Virtual Agents can address user inquiries and provide generative answers powered by OpenAI’s GPT. The bot is automatically configured to search across the website and summarize relevant knowledge-based articles. Additionally, the chatbot supports multi-turn conversations and context-based responses. Future enhancements will include document uploads, tone selection for responses, and content moderation controls.
Overview of Demos in the Video
Exploring AI and Copilot Experiences in the Power Platform Stephen Siciliano, guides us through the latest Power Platform updates. The AI and Copilot experiences in the Power Platform offer assistance across various tasks, saving time and effort for users. Whether automating processes, building apps, or creating websites, the AI can generate experiences based on knowledge and data provided, offering suggestions for customization and helping with logic and workflow generation.
Building Automated Workflows with Copilot Stephen demonstrates how Copilot can transform a common scenario like invoice processing. Using a natural language prompt, Copilot quickly generates a workflow for managing invoice intake and approval. Users can iterate on the flow, ask for additional variants, and customize it as needed. Copilot’s ability to automate repetitive processes and generate functional experiences simplifies the automation of complex workflows.
Utilizing AI Builder for Document Analysis Stephen showcases how AI Builder, integrated with Copilot, can extract data from incoming invoices. The AI model can process the invoice content, extract relevant information, and generate comprehensive email notifications. This streamlines the approval process and eliminates the need for manual data entry.
Accelerating App Development with Copilot Copilot’s capabilities extend to app development in Power Apps. Stephen demonstrates how Copilot assists in creating apps based on existing Excel files. By uploading the file to Power Apps Studio, Copilot processes the data, determines column headings and data types, and generates a working app. The AI also assists in customizing the app, making changes based on prompts provided by the user.
Creating Websites with Power Pages and Copilot Stephen shows how Copilot can be used in conjunction with Power Pages to build professional websites quickly. By providing prompts, Copilot generates HTML, CSS, and relevant images for different sections of the webpage. This accelerates the website creation process, allowing users to focus on content customization.
Enhancing User Experiences with Power Virtual Agents Power Virtual Agents integration with Power Pages enables the addition of intelligent chatbots to websites. Stephen demonstrates how a bot can be easily added to a website using Power Virtual Agents. The chatbot, powered by OpenAI’s GPT, can provide generative answers to user questions, search the website for relevant information, and engage in multi-turn conversations. The integration ensures that site visitors can find the information they need quickly and effortlessly.
Conclusion The fusion of AI and Copilot with Microsoft’s Power Platform opens up new possibilities for automation, app development, and user experiences. With AI-assisted workflow generation, app building, webpage creation, and chatbot integration, users can achieve their goals more efficiently, even without extensive coding knowledge. The Power Platform’s latest updates empower users to leverage AI technologies, making the development process faster, more intuitive, and highly productive.
This article is contributed. See the original author and article here.
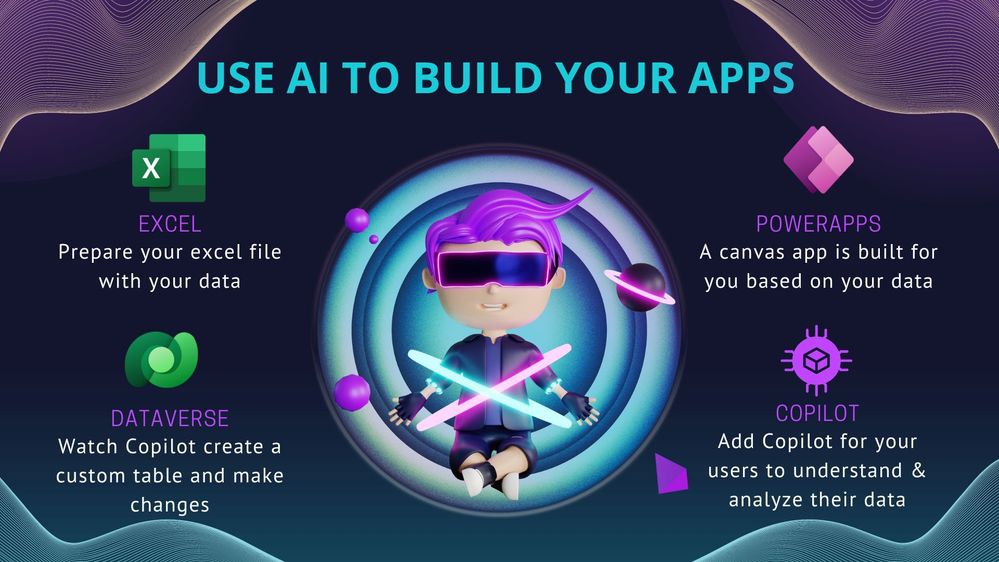
Blog Banner At Microsoft Build, 50 updates were announced and among those updates were Power Platform announcements in which we will look at one of them today. Learn how to use the Excel to App with Copilotfeature which enables you to take advantage of Copilot to add data processing capabilities by helping you clean and prepare your data before you even start building the app. Copilot can now ingest any Excel file, no matter how loosely structured and create robust structured tables with a variety of data types.
Students, rising developers and pro-developers can rapidly build solutions in PowerApps by simply dragging and dropping or linking to a data source like Excel, and then build the UI on top of that data.
Things to consider
You can import your excel file as it is and PowerApps will create a Custom Dataverse Table and a Canvas App for you.
You do not need to format your table within excel (example you do not have to use Format as a Table within your spreadsheet)
Your Canvas App and Dataverse table will be built based on the first sheet of your Excel Spreadsheet.
The excel file needs to be closed when importing within PowerApps
Short Demo
Animation showing a short demo of the Excel to App feature with Copilot in PowerApps
Practical steps to follow
Prepare your excel file to use or create a new one.
On the Start with data wizard, choose and click on Upload an Excel file.
Click on Select from device button then choose your excel file your device.
You will get a preview of your Dataverse custom table that will be created for you. You will be able to edit the table by clicking on Edit Table Properties to change the Table name.
The columns of your table are assigned to their appropriate data types and you have the ability to change/edit the column by clicking on the drop down next to the column and click on Edit Column. Once done, you can click on Create app
Once you have clicked on Create app, Copilot will build a Canvas App with a Standard template that you can modify based on your needs.
Let’s Add more AI capabilities with Copilot
Within your app, click on Settings then choose Upcoming Features
Search for Copilot and toggle it to enable it. Once enabled close the dialog box.
Once your Copilot Component is enabled, click on Insert and choose Copilot (preview)
Once the Copilot Component is added on the screen, you will need to choose/select the your Datasource.
Once you have chosen your Datasource, the full Copilot Component is added to your app. This allows your app users to use Copilot to understand and analyze their data using suggested prompts.
Play the app and see Copilot in action. Choose one of the suggested prompts, for example on the picture below I want to know how many tickets are open.
Congratulations! You did it, you built a Canvas app from your excel file using Copilot!
This article is contributed. See the original author and article here.
This article describes how to perform a REST API request in Azure using RBAC authentication with Postman. I will use as example the Get Blob (REST API) request.
Please see below how to perform a REST API request in Azure using RBAC authentication:
Open the Azure Portal and go to Azure Active Directory.
On left side, please create a new App registration by clicking on App registration (left side bar) and then New registration. Fill in the Name and all the information required.
Inside the new app:
Click on Overview and and collect the Application (client) ID value, and the Directory (tenant) ID value.
Clink on Certificates & secrets and create a New Client Secret. Please collect the client secret value.
Open your storage account and go to Access Control (IAM) and assign to this App the RBAC role required to call any data access operation in Azure Storage. Please note the role assignment could take some time to take effect.
Add the header “Authorization“ with the value “Bearer <token>” where <token> is the value generated on the step 5.2.7 above.
Add at least the two required headers x-ms-date and x-ms-version.
Execute the request.
Disclaimer:
These steps are provided for the purpose of illustration only.
These steps and any related information are provided “as is” without warranty of any kind, either expressed or implied, including but not limited to the implied warranties of merchantability and/or fitness for a particular purpose.
We grant You a nonexclusive, royalty-free right to use and modify the Steps and to reproduce and distribute the steps, provided that. You agree:
to not use Our name, logo, or trademarks to market Your software product in which the steps are embedded;
to include a valid copyright notice on Your software product in which the steps are embedded; and
to indemnify, hold harmless, and defend Us and Our suppliers from and against any claims or lawsuits, including attorneys’ fees, that arise or result from the use or distribution of steps.
This article is contributed. See the original author and article here.
Today, we faced a service request where our customer got the following issue Msg 9002, Level 17, State 2, Line 8 The transaction log for database ‘2d7c3f5a-XXXX-XZY-ZZZ-XXX’ is full due to ‘REPLICATION’ and the holdup lsn is (194XXX:24X:1). Following I would like to share with you what was the lesson learned here.
We need to pay attention about the phrase “is full due to”, in this case is REPLICATION that means that could be related about Transaction Replication or Change Data Capture (CDC).
In order to determine the situation, if we are not using Transaction Replication is to review if CDC is enabled running the following query: select name,recovery_model,log_reuse_wait,log_reuse_wait_desc,is_cdc_enabled,* from sys.databases where database_id=db_id() – sys.databases (Transact-SQL) – SQL Server | Microsoft Learn
During the troubleshooting process during the execution of sys.sp_cdc_disable_db we got another error Msg 22831, Level 16, State 1, Procedure sys.sp_cdc_disable_db_internal, Line 338 [Batch Start Line 6] Could not update the metadata that indicates database XYZ is not enabled for Change Data Capture. The failure occurred when executing the command ‘(null)’. The error returned was 9002: ‘The transaction log for database ‘xxx-XXX-43bffef44d0c’ is full due to ‘REPLICATION’ and the holdup lsn is (51XYZ:219:1).’. Use the action and error to determine the cause of the failure and resubmit the request.
In this situation, we need to add more space to the transaction log file due there is not possible to register the disabling CDC operation in the transaction log.
Once, we have more space in our transaction log, we were able to disable CDC and after disabling CDC, Azure SQL Database was able to marked as backup the Transaction Log.
Finally, in order to try to speed up the truncation of this transaction log we executed several times the command DBCC SHRINKFILE (Transact-SQL) – SQL Server | Microsoft Learn and we were able to reduce the file size of the transaction log file.
This article is contributed. See the original author and article here.
Introduction
Effective labelling processes and configuration play a crucial role in optimizing warehouse operations. There are several reasons why accurate labelling and configuration are important.
Firstly, proper labelling and configuration enhance efficiency in a warehouse. When items are labelled and organized accurately, warehouse staff can quickly locate and identify products, reducing the time spent searching for items and ultimately boosting productivity.
Furthermore, clear and accurate labelling also reduces the likelihood of picking or shipping errors, which can lead to improved customer satisfaction and decreased costs associated with returns and corrections.
Lastly, proper labelling and configuration contribute to safety and compliance in a warehouse. By adhering to regulations and ensuring that hazardous materials or items with specific storage requirements are handled and stored correctly, the risk of accidents can be reduced.
As technology continues to advance, so do the tools available to improve labelling and configuration processes in warehouses. In Wave 1 2023, Microsoft Dynamics 365 SCM released several enhancements to support more advanced scenarios and bring extra capabilities to the labelling process.
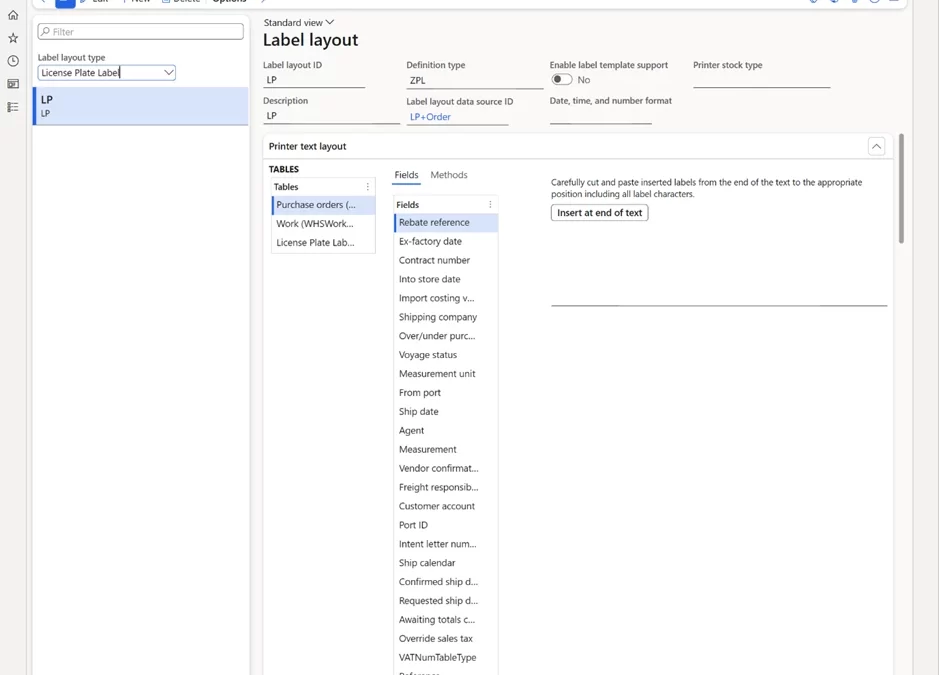
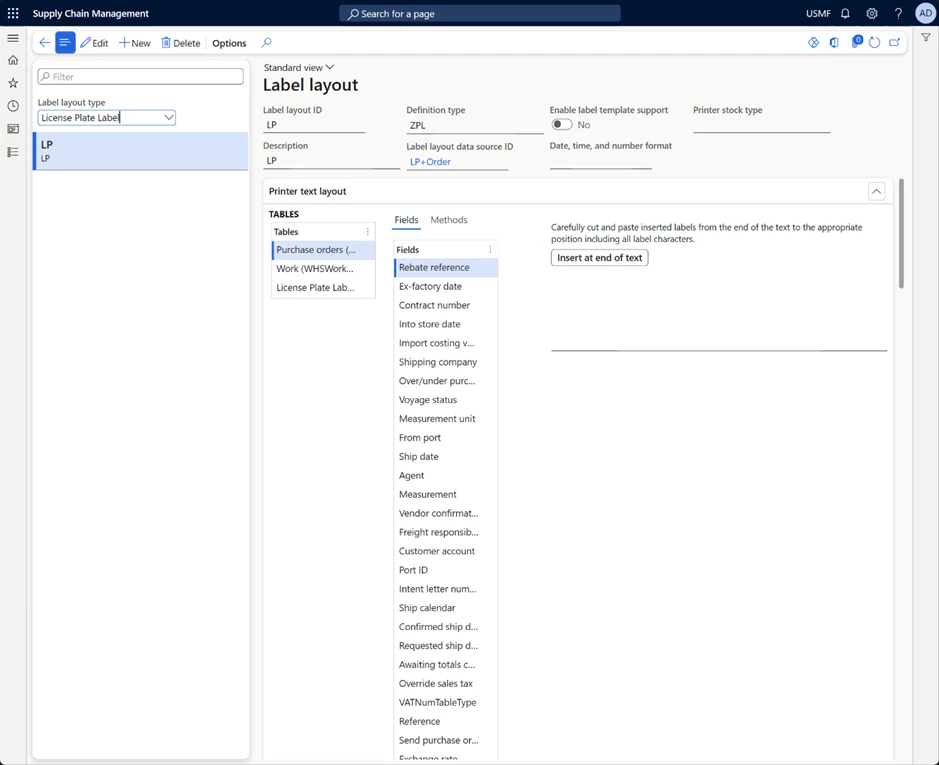
License plate label layout
In 10.0.31 Microsoft Dynamics 365 SCM, a new License plate label layout was introduced for designing license plate labels. This feature lets you build more advanced license plate label layouts. Now LP layouts can have repeating structures and include header, body, and footer elements (for example, if you want to print item labels out of receiving or shipping work (similar to how wave labels currently work)). You can set up custom data sources with joined tables to print information from the related tables and define custom date, time, and number formats. This capability provides more flexibility in designing labels and removes some of the customization work needed to add data to the labels.
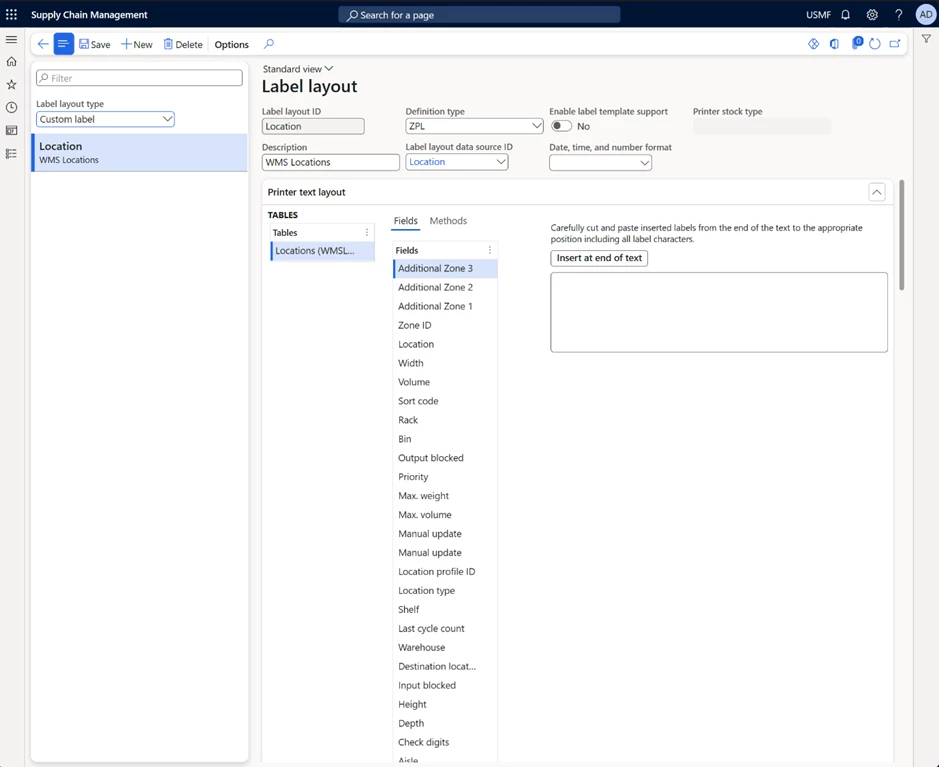
Custom label layouts
In 10.0.33 Microsoft Dynamics 365 SCM a new Custom label layout feature was released.
This feature introduces a new Custom label layout type that allows you to build layouts from any data sources. A new Print button will be displayed automatically when layout exists for corresponding source. Users can print labels for any data including but not limited to Product labels, Location labels, Customer labels and many more.
It gives you the tool you need to create your own labels based on the business requirements. As well as configuring and printing any labels from any source.
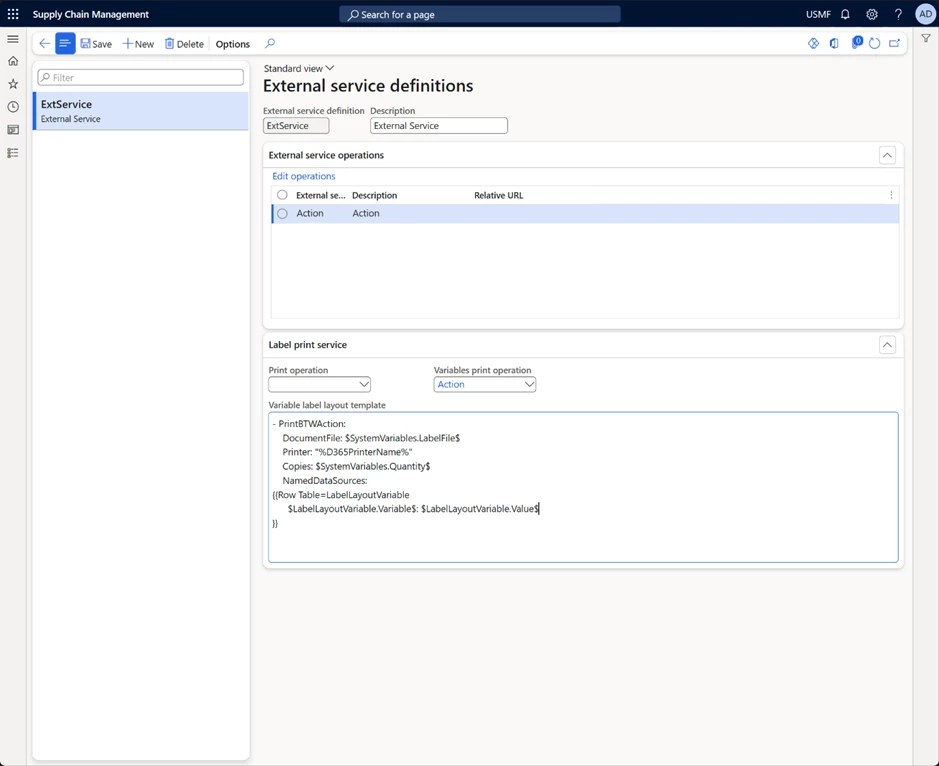
Print labels using an external service
In 10.0.34 Microsoft Dynamics 365 SCM provides a quick and simple method for linking Dynamics 365 to many of the most popular enterprise labeling platforms. With Microsoft Dynamics 365 SCM’s seamless integration and flexible configuration options make for a pain-free, rapid implementation. It allows you to create a seamless flow of communication and transactions to optimize your printing workflow.
It allow you to configure the HTTP(S) request that you make, allowing for the integration with cloud native and on-premise (if the firewall is opened or an Azure API created) label printing services, including Zebra’s cloud printing service (https://developer.zebra.com/apis/sendfiletoprinter-model), Loftware NiceLabel Cloud or Seagull Scientific BarTender configured with REST APIs.
Conclusion
In conclusion, the continued evolution of technology is providing ever more sophisticated tools for improving labelling processes and configuration in warehouses. The enhancements released in Wave 1 2023 are just the latest example of how Microsoft Dynamics 365 SCM is staying at the forefront of this evolution and providing users with the tools they need to optimize their warehouse operations.
This article is contributed. See the original author and article here.
This solution architecture proposal outlines how to effectively utilize OpenAI’s language model alongside Azure Cognitive Services to create a user-friendly and inclusive solution for document translation. By leveraging OpenAI’s advanced language capabilities and integrating them with Azure Cognitive Services, we can accommodate diverse language preferences and provide audio translations, thereby meeting accessibility standards and reaching a global audience. This solution aims to enhance accessibility, ensure inclusivity, and gain valuable insights through the combined power of OpenAI, Azure Cognitive Services and PowerPlatform.
Dataflow
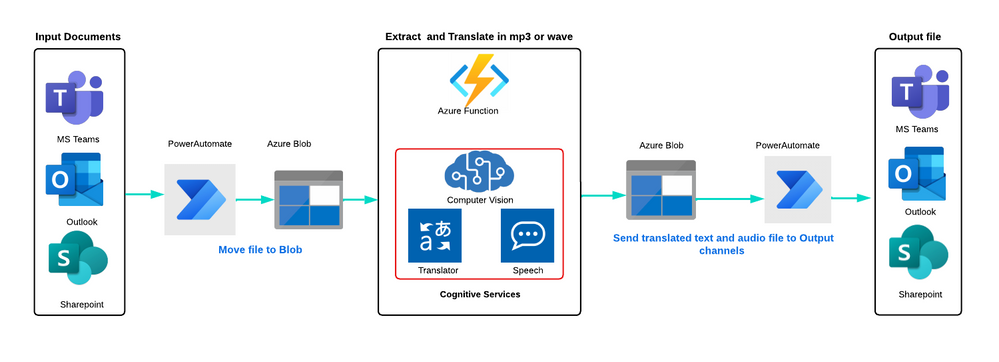
Here is the process:
Ingest: PDF documents, text files, and images can be ingested from multiple sources, such as Azure Blob storage, Outlook, OneDrive, SharePoint, or a 3rd party vendor.
Move: Power Automate triggers and moves the file to Azure Blob storage. Blob triggers then get the original file and call an Azure Function.
Extract Text and Translate: The Azure Function callsAzure Computer Vision Read APIto read multiple pages of a PDF document in natural formatting order, extract text from images, and generate the text with lines and spaces, which is then stored in Azure Blob storage. TheAzure Translatorthen translates the file and stores it in a blob container. TheAzure Speechgenerates a WAV or MP3 file from the original language and translated language text file, which is also stored in a blob container
Notify: Power Automate triggers and moves the file to the original source location and notifies users in outlook and MS teams with an output audio file.
The Azure architecture utilizes Azure Blob storage as the default option for file storage during the entire process. However, it’s also possible to use alternative storage solutions such as SharePoint, ADLS or third-party storage options. For processing a high volume of documents, consider using Azure Logic Apps as an alternative to Power Automate. Azure Logic Apps can prevent you from exceeding consumption limits within your tenant and is a more cost-effective solution. To learn more about Azure Logic Apps, please refer to theAzure Logic Apps.
Components
These are the key technologies used for this technical content review and research:
This solution uses multipleCognitive Servicesfrom Azure to automate the business process of translating PDF documents and creating audio files in wav/mp3 audio format for accessibility and global audience. It’s a great way to streamline the translation process and make content more accessible to people who may speak different languages or have different accessibility needs.
Potential use cases
By leveraging this cloud-based solution idea that can provide comprehensive translation services on demand, organizations can easily reach out to a wider audience without worrying about language barriers. This can help to break down communication barriers and ensure that services are easily accessible for people of all cultures, languages, locations, and abilities.
In addition, by embracing digital transformation, organizations can improve their efficiency, reduce costs, and enhance the overall customer experience. Digital transformation involves adopting new technologies and processes to streamline operations and provide a more seamless experience for customers.
It is particularly relevant to industries that have a large customer base or client base, such as e-commerce, tourism, hospitality, healthcare, and government services.
This article is contributed. See the original author and article here.
We are excited to announce Azure App Spaces (preview), one of the fastest and easiest way to deploy and manage your web apps on Azure. Azure App Spaces is a portal-based experience that takes an app-first approach to building, deploying, and running your apps. App Spaces makes it easier for developers to get started using Azure, without needing to be an expert on the hundreds of different cloud services.
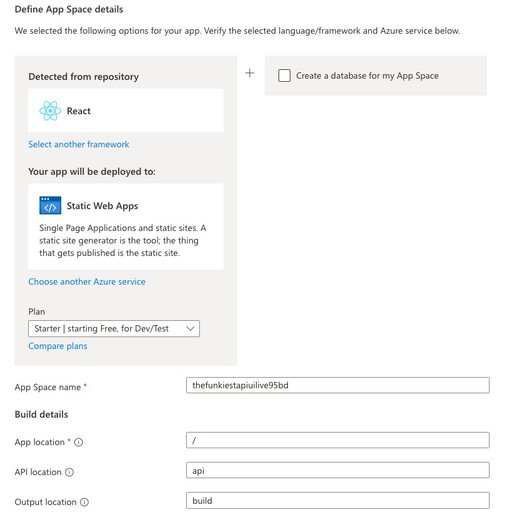
Detect the right Azure services from your repository
App Spaces lets you connect your GitHub repositories to Azure, and through analysis of the code inside your GitHub repository, suggests the correct Azure services you should use. Once you deploy, GitHub Actions is used to create a continuous deployment pipeline between your repositories and your newly provisioned cloud services. Once you’ve deployed your app via App Spaces, changes to your code will immediately be pushed to your connected Azure services.
Bring your own repository or start from a template
App Spaces also provides sample templates, powered by Azure Developer CLI, that provide a helpful blueprint for getting started with Azure. You can use these templates to immediately create a GitHub repository, connect it to Azure, and provision a distinct set of services for the template scenario. Our templates include sample static websites, web apps, and APIs, in a variety of different languages.
Manage your app in a consolidated view
In addition to making it easier and faster to get started developing, App Spaces also provides a simplified, app-centric management experience. An “App Space” is a loose collection of cloud services that, collectively, comprise the app you are building. You can manage your compute, database, caching, and other key services all within the same, easy-to-use management experience.
To get started immediately, you can check out App Spaces here. You can also read our documentation to get a better look at what App Spaces can do for you.
This article is contributed. See the original author and article here.
Generative AI models are ushering in the next frontier in interactions between humans and computers. Just like graphical user interfaces brought computing within reach of hundreds of millions of people three decades ago, next-generation AI will take it even further, making technology more accessible through the most universal interface—natural language.

.gif")


.png")


Recent Comments