This article is contributed. See the original author and article here.
This month we are introducing several capabilities for leaders, corporate communicators, and employees to improve your campaigns, events, and engagement across the platform. Here’s what’s new for Viva Engage this month:
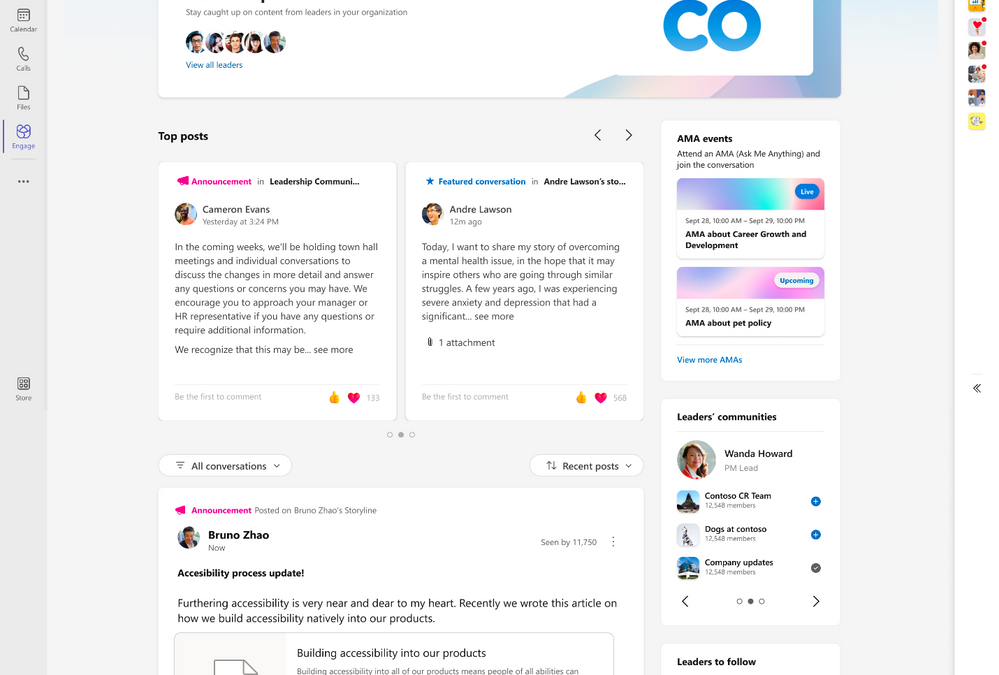
Updates to Leadership Corner* feeds and announcements
Employees can sort the feed in Leadership Corner chronologically, or filter to see unread conversations or only announcements from their leaders. Additionally, employees can now access a dedicated feed with all featured conversations across the network in a single, consolidated view.
Top posts are also new in Leadership Corner, providing a visual element to highlight featured conversations and announcements from leaders.
Top posts now have a dedicated carousel within Leadership Corner
*Denotes features are available to Microsoft Viva customers only.
New enhancements coming to campaigns* in Viva Engage
The campaign discovery hub in Viva Engage will help employees explore and discover campaigns.
In the campaign hub, employees will find:
Top campaigns which are trending campaigns that the employee is currently not following
Sponsored campaigns which are campaigns that are sponsored by leaders
Browse all campaigns which shows all active and ended campaign
Employees can Follow active campaigns or learn more about a campaign on its landing page. Or employees can access the campaign hub by clicking on Discover more from Top Campaigns on the home feed or Followed Campaigns on any storyline profile. Employees can search for a campaign by using the Viva Engage search bar. Search campaigns results show campaign hashtag, description, followers count, official symbol, color theme and cover image. This search is based on a prefix search to provide more relevant information.
The newly added Executive sponsors enables leaders in an organization to sponsor and support campaigns. Corporate communicators (campaign managers) of an organization can manually add leaders as executive sponsors. Once added, executive sponsors will be notified in Viva Engage and Outlook. Campaigns that have executive sponsors will also show up in Leadership Corner. Learn best practices and get some ideas from Viva Engage Explained blog to get started with campaigns.
Ask Me Anything improvements make hosting easier for large AMAs
Ask Me Anything’s are text based virtual events, often hosted by leaders or subject matter experts on a specific topic. Coming soon, organizers will be renamed to hosts and moderators will be renamed to organizers. When you create an AMAM you can add up to 10 moderators and/or hosts per event. Hosts can create the event and add co-organizers to help edit and manage the event. AMA moderators can help manage incoming questions from employees during the event. Depending on the anticipated size and reach of your AMA, we’d advise at least 2 moderators.
Employees will be able to add AMAs directly to their calendars to remind them of the upcoming events and participate live. The calendar invite will include time and a link directly to the AMA making it simple for employees to find the action and post their own question or upvote previously asked questions. Additionally, we display upcoming and past AMAs that leaders have hosted, employees will be able to see AMAs from their leaders within the Leadership Corner.
After the AMA has concluded, organizers and leaders need insights to measure success or make improvements. Viva Engage will now include an initial set of analytics for AMAs. Organizers can see key details of their AMAs like reach and engagement.
For more details about hosting your own AMA and best practices, view the AMA Playbook.
Viva Engage topic migration update and improvements rolling out
Shifting to Viva Topics leverages a more robust and secure infrastructure for Viva Engage topics. We began this process earlier this year for networks in Native Mode and will continue until all Viva Engage networks have migrated to Viva Topics. The migration also helps make community-sourced knowledge accessible across an organization and supports a consistent topics experience in Microsoft 365. To ensure quality topic experiences, Viva Engage topics applied to less than 10 Viva Engage conversations or topics with no usage in the last 18 months will still be migrated but will not be surfaced in topic picking experiences.
For organizations not using premium Viva Topics experiences, the use of topics in Viva Engage will appear the same before and after topic migration.
For organizations using Viva Topics*, you will gain premium benefits, such as topic cards in Yammer (Viva Engage), Viva Topic pages, and centralized topic management.
To support these changes fixes and enhancements to data exports and the Topics API will be rolling out. Admins can review documentation on API and data export in the following resources:
Export topics created in Viva Engage with PowerShell
Using PowerShell, you can export topics created by an employee in Viva Engage (also known as Lite Topics) to a .csv file. Topics created before enabling integration with Viva Engage are included. For more information, please see Export topics created in Viva Engage with PowerShell.
More controls coming to the new admin center
Last month we released a new Viva Engage admin center on the web, and now we will include more capabilities including data exports and increase audit logs. Learn more about the Admin Center here.
Stay connected, learn from your leaders, and build communities with the newly rebranded Viva Engage mobile app. Download the app from the app store. With the Viva Engage mobile app, sharing updates and staying connected to your organization and up-to-date on the latest news has never been easier.
See what else Viva Engage has planned on the public roadmap and keep an eye on this blog for more news, updates, and best practices relating to Viva Engage and communities in Microsoft 365.
*Some capabilities are only available for Microsoft Viva customers. Learn more here.
This article is contributed. See the original author and article here.
We received some support cases when customers encounter following error “TSQL CRUD has been disallowed via policy for this Azure subscription“ while trying to create or modify of Azure SQL resources through T-SQL.
Cause
This error occurred when Azure Administrator block the T-SQL CRUD operations of Azure SQL resources through T-SQL. This is enforced at the subscription level to block T-SQL commands from affecting SQL resources in any Azure SQL database.
How to enable block T-SQL CRUD
To use this feature “block T-SQL CRUD” operation an Azure user with owner or contributor role is needed, by following the below steps:
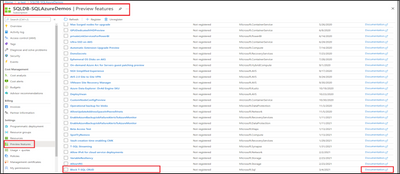
Go to your subscription on Azure portal.
Select the Preview Features tab.
Select Block T-SQL CRUD.
After you select Block T-SQL CRUD, a new window will open, select Register, to register this block with Microsoft.Sql resource provider.
After you register the block of T-SQL CRUD with Microsoft.Sql resource provider, you must re-register the Microsoft.Sql resource provider for the changes to take effect. To re-register the Microsoft.Sql resource provider:
Go to your subscription on Azure portal.
Select the Resource Providers tab.
Search and select Microsoft.Sql resource provider.
Select Re-register.
Removing Block T-SQL CRUD
To remove the block on T-SQL create or modify operations from your subscription, first unregister the previously registered T-SQL block. Then, re-register the Microsoft.Sql resource provider as shown above for the removal of T-SQL block to take effect.
When to use Block T-SQL CRUD feature
When you are using Azure Policies to enforce organizational standards through ARM templates. Since T-SQL does not adhere to the Azure Policies, a block on T-SQL create or modify operations can be applied. The syntax blocked includes CRUD (create, update, delete) statements for databases in Azure SQL, specifically CREATE DATABASE, ALTER DATABASE, and DROP DATABASE statements.
Blocked statement
CREATE DATABASE statements
DROP DATABASE statements
A subset of ALTER DATABASE statements, as follows:
ALTER DATABASE … ADD SECONDARY ON SERVER
ALTER DATABASE … REMOVE SECONDARY ON SERVER
ALTER DATABASE … FAILOVER
ALTER DATABASE … MODIFY NAME …
ALTER DATABASE … MODIFY (MAXSIZE | EDITION | SERVICE_OBJECTIVE …)
ALTER DATABASE … MODIFY BACKUP_STORAGE_REDUNDANCY …
ALTER DATABASE … SET ENCRYPTION …
Disclaimer
Please note that the products and options presented in this article are subject to change. This article reflects Block T-SQL CRUD in June 2023. To check for new update or more information please check the below link:
This article is contributed. See the original author and article here.
Azure Portal Admin is a cloud-based management console provided by Microsoft Azure. It is a web-based interface that allows users to manage and monitor their Azure resources and services, configure security settings, and monitor costs. It provides a single, unified view of all Azure resources and services, making it easier to manage and monitor your cloud infrastructure.
Importance of Effective Cloud Management
Effective cloud management is critical for businesses that use cloud computing services. Cloud computing has many benefits, including cost savings, scalability, and flexibility. However, without effective cloud management, these benefits can quickly turn into liabilities. Poorly managed cloud resources can lead to security vulnerabilities, inefficient resource usage, and increased costs.
Overview of the guide
This guide will provide a comprehensive overview of Azure Portal Admin and how to use it for effective cloud management. We will cover everything from setting up your Azure account to managing resources, configuring security, monitoring costs, and best practices for effective cloud management. By the end of this guide, you will have a solid understanding of how to use Azure Portal Admin to manage and monitor your cloud infrastructure effectively.
Setting up Azure Portal Admin
Before you can start using Azure Portal Admin, you need to create an Azure account. You can sign up for a free trial or a paid account, depending on your needs. Once you have an account, you can sign into Azure Portal Admin and start managing your cloud resources.
Understanding the Azure Portal Interface
Azure Portal Admin has a web-based interface that provides a single, unified view of all your Azure resources and services. The interface is customizable, allowing you to create dashboards and customize views to suit your needs. You can also use the search bar to quickly find resources and services.
Configuring Azure Services and Resources
Azure Portal Admin allows you to configure and manage a wide range of Azure services and resources, including virtual machines, storage accounts, databases, and more. You can provision and deploy new resources, configure settings, and monitor resource usage.
Managing Access and Permissions
Azure Portal Admin allows you to manage access and permissions for your cloud resources. You can create roles and assign permissions to users and groups, controlling who can access and manage your resources. You can also configure authentication and authorization settings to ensure that only authorized users can access your resources.
In this section, we covered the basics of setting up Azure Portal Admin. By creating an Azure account, understanding the interface, configuring services and resources, and managing access and permissions, you can get started with managing your cloud infrastructure effectively.
Managing Azure Resources
Azure resources are the building blocks of your cloud infrastructure. They include virtual machines, storage accounts, databases, networking resources, and more. Managing Azure resources effectively is critical for ensuring that your cloud infrastructure is running smoothly and efficiently.
Provisioning and Deploying Azure Resources
Provisioning and deploying Azure resources involves creating and configuring resources to meet your specific needs. Azure Portal Admin provides a simple, user-friendly interface for provisioning and deploying resources. You can choose from a wide range of pre-configured templates or create your own custom templates.
Monitoring and Optimizing Resource Performance
Monitoring resource performance is essential for ensuring that your cloud infrastructure is running efficiently. Azure Portal Admin allows you to monitor resource usages and performance metrics, such as CPU usage, memory usage, and network bandwidth. You can also set up alerts to notify you when resources reach certain thresholds.
Optimizing resource performance involves identifying and addressing performance bottlenecks. Azure Portal Admin provides tools for identifying and resolving performance issues, such as scaling resources, optimizing storage, and tuning database performance.
Scaling Azure Resources
Scaling resources involves adjusting resource capacity to meet changing demand. Azure Portal Admin allows you to scale resources up or down, depending on your needs. You can also configure autoscaling to automatically adjust resource capacity based on predefined rules.
In this section, we covered the basics of managing Azure resources. By provisioning and deploying resources, monitoring, and optimizing performance, and scaling resources, you can ensure that your cloud infrastructure is running smoothly and efficiently.
Security and Compliance – Understanding Azure Security
Security is a top concern for businesses using cloud computing services. Azure provides a wide range of security features and tools to help you secure your cloud infrastructure. Azure Portal Admin allows you to configure and manage security settings for your resources and services.
Configuring Azure Security Features
Azure Portal Admin provides a range of security features that you can configure to secure your resources and services. These include network security groups, virtual network security, firewall rules, access control lists, and more. You can also configure identity and access management settings, such as single sign-on and multifactor authentication.
Managing Azure Security Risks
Managing security risks involves identifying and addressing security vulnerabilities and threats. Azure Portal Admin provides tools for identifying and mitigating security risks, such as security centers, threat protection, and vulnerability assessment. You can also configure alerts to notify you when security risks are detected.
Compliance Considerations for Azure
Compliance is a critical consideration for businesses that store and process sensitive data in the cloud. Azure Portal Admin provides tools for ensuring compliance with a range of regulations and standards, such as HIPAA, PCI DSS, and GDPR. You can configure compliance settings and monitor compliance status using Azure Portal Admin.
In this section, we covered the basics of security and compliance in Azure. By understanding Azure security features, configuring security settings, managing security risks, and ensuring compliance, you can secure your cloud infrastructure and protect sensitive data.
Cost Management – Understanding Azure Pricing
Understanding Azure pricing is essential for effective cost management. Azure offers a range of pricing models, such as pay-as-you-go, reserved instances, and spot instances. Azure Portal Admin provides tools for estimating and optimizing costs based on your usage and needs.
Managing Azure Costs
Managing Azure costs involves monitoring and controlling your cloud spending. Azure Portal Admin provides tools for managing costs, such as cost analysis, budget alerts, and cost allocation. You can also use Azure Advisor to identify cost-saving opportunities.
Cost Optimization Strategies
Cost optimization involves reducing costs without sacrificing performance or functionality. Azure Portal Admin provides tools for optimizing costs, such as resource tagging, resource consolidation, and resource deletion. You can also use Azure Cost Management to identify areas where you can reduce costs.
Monitoring and Tracking Azure Spending
Monitoring and tracking your Azure spending is essential for ensuring that you stay within your budget. Azure Portal Admin provides tools for monitoring and tracking spendings, such as cost analysis and spending reports. You can also set up alerts to notify you when you approach or exceed your budget.
In this section, we covered the basics of cost management in Azure. By understanding Azure pricing, managing costs, optimizing costs, and monitoring and tracking spending, you can ensure that you are using Azure in a cost-effective way that aligns with your business needs and goals.
Best Practices for Azure Portal Admin – Tips for effective cloud management
Effective cloud management involves adopting best practices that help you get the most out of your Azure infrastructure. Some tips for effective cloud management include implementing automation, using templates and scripts, monitoring performance and availability, and establishing clear governance policies.
Common Mistakes to Avoid
There are also common mistakes that you should avoid when managing Azure infrastructure. These include:
Failing to properly configure security settings,
Not monitoring and optimizing costs,
Not keeping software and infrastructure up to date, and
Failing to establish clear governance policies.
Conclusion
In this guide, we covered the basics of Azure Portal Admin and effective cloud management. We explored how to set up Azure Portal Admin, manage Azure resources, ensure security and compliance, manage costs, and adopt best practices for effective cloud management.
Effective cloud management is essential for ensuring that your cloud infrastructure is secure, optimized, and cost-effective. By implementing the strategies and best practices covered in this guide, you can effectively manage your Azure infrastructure and achieve your business goals.
As technology continues to evolve, cloud computing will continue to play an increasingly important role in businesses of all sizes. By mastering Azure Portal Admin and effective cloud management, you can stay ahead of the curve and position your business for success in the digital age. Remember to continue learning and staying up to date with the latest developments in cloud computing, and don’t hesitate to seek out help and resources when needed.
Thank you for reading this comprehensive guide on mastering Azure Portal Admin and effective cloud management. We hope that you found it informative and useful in your journey toward becoming a cloud management expert.
Resources for Ongoing Learning
Learning is an ongoing process, and there are many resources available to help you deepen your knowledge of Azure and cloud computing. Some resources for ongoing learning include:
This article is contributed. See the original author and article here.
We are excited to introduce support for Copilot in Dynamics 365 Customer Service across multiple geographic regions, or cross-geo support. During the past few months, we successfully rolled out Copilot features to customers in the United States. Following this momentum, we are now extending the power of this cutting-edge technology to customers outside of the United States. Now regions across the globe can enhance their customer service operations with ground-breaking generative AI.
Copilot leverages the Microsoft Azure OpenAI Service to provide an intelligent assistant for customer service agents. With Copilot, agents can resolve customer issues faster, automate routine tasks, and boost productivity. In general, tasks that can take minutes or hours are ready for agents to review and complete at the click of a button. This transformative technology enables agents to handle customer inquiries with greater accuracy and speed. Consequently, contact centers attain higher customer satisfaction rates and operational efficiency.
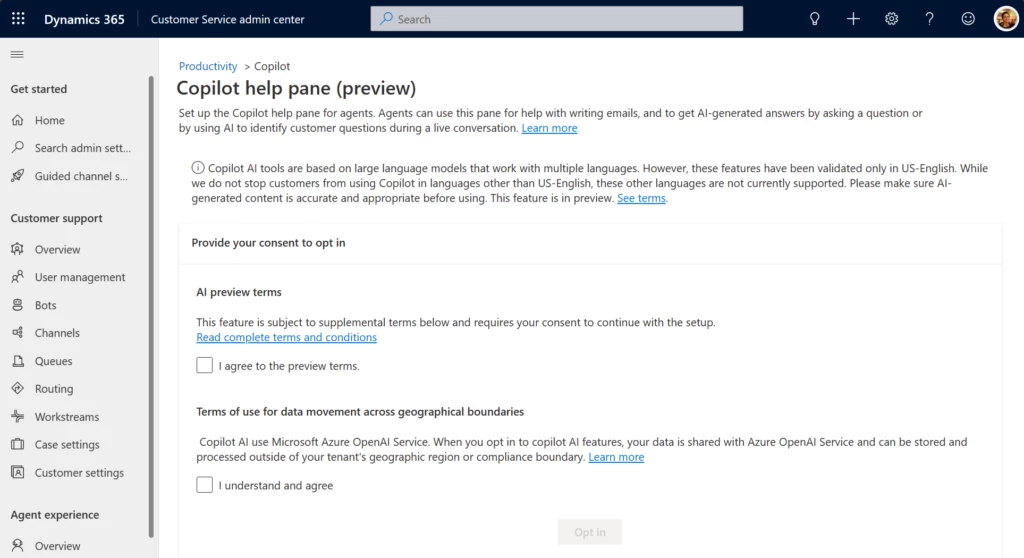
Customers outside the United States can now experience the transformative power of Copilot in their contact centers through a simple opt-in process.
To start using Copilot, customers outside of the United States can request access to the limited preview by emailing d365_csaipreview@microsoft.com. Once you have access, our team will guide you through the process and help you unlock this powerful feature for your contact center.
We invite you to be a part of this transformative journey. With Copilot capabilities, you can revolutionize your customer service operations and deliver exceptional customer experiences. Try the preview and unlock the true potential of Copilot today.
AI solutions built responsibly
Enterprise grade data privacy at its core. Azure OpenAI offers a range of privacy features, including data encryption and secure storage. It allows users to control access to their data and provides detailed auditing and monitoring capabilities. Copilot is built on Azure OpenAI, so enterprises can rest assured that it offers the same level of data privacy and protection.
Responsible AI by design. We are committed to creating responsible AI by design. Our work is guided by a core set of principles: fairness, reliability and safety, privacy and security, inclusiveness, transparency, and accountability. We are putting those principles into practice across the company to develop and deploy AI that will have a positive impact on society.
Learn more about cross-geo support for Copilot
Watch a video to learn how copilot AI searches company knowledge sources and generates optimized responses in a single click.
This article is contributed. See the original author and article here.
In this episode of MidDay Café hosts Tyrelle Barnes and Michael Gannotti discuss Human/AI partnership. Many organizations are trying to figure out AI strategy but seem to be taking a tech/product first approach. What Tyrelle and Michael discuss is how to anchor on people/employees first with AI/Tech in support.
This article is contributed. See the original author and article here.
Introduction
Azure OpenAI models provide a secure and robust solution for tasks like creating content, summarizing information, and various other applications that involve working with human language. Now you can operate these models in the context of your own data. Try Azure OpenAI Studio today to naturally interact with your data and publish it as an app from from within the studio.
Getting Started
Follow this quickstart tutorial for pre-requisites and setting up your Azure OpenAI environment.
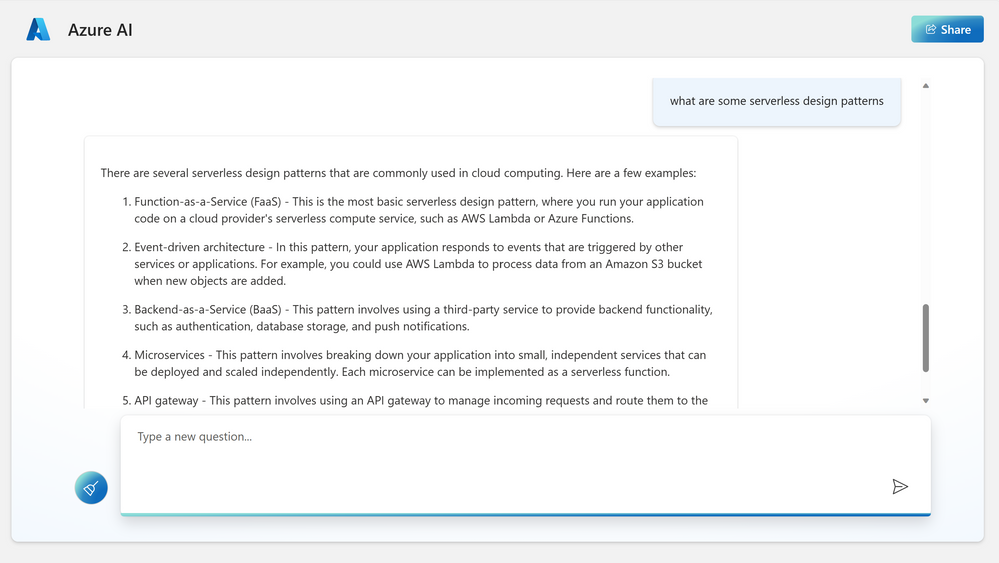
In order to try the capabilities of the Azure OpenAI model on private data, I am uploading an ebook to the Azure OpenAI chat model. This e-book is about “Serverless Apps: Architecture, patterns and Azure Implementation” written by Jeremy Likness and Cecil Phillip. You can download the e-book here
Before uploading own data
Prior to uploading this particular e-book, the model’s response to the question on serverless design patterns is depicted below. While this response is relevant, let’s examine if the model is able to pick up the e-book related content during the next iteration
After uploading own data
This e-book has an exclusive section that talks in detail about different design patterns like Scheduling, CQRS, Event based processing etc.
After training the model on this PDF data, I asked a few questions and the following responses were nearly accurate. I also limited the model to only supply the information from the uploaded content. Here’s what I found.
Now when I asked about the contributors to this e-book, it listed everyone right.
Read more
With enterprise data ranging to large volumes in size, it is not practical to supply them in the context of a prompt to these models. Therefore, the setup leverages Azure services to create a repository of your knowledge base and utilize Azure OpenAI models to interact naturally with them.
The Azure OpenAI Service on your own data uses Azure Cognitive Search service in the background to rank and index your custom data and utilizes a storage account to host your content (.txt, .md, .html, .pdf, .docx, .pptx). Your data source is used to help ground the model with specific data. You can select an existing Azure Cognitive Search index, Azure Storage container, or upload local files as the source we will build the grounding data from. Your data is stored securely in your Azure subscription.
We also have another Enterprise GPT demo that allows you to piece all the azure building blocks yourself. An in-depth blog written by Pablo Castro chalks the detail steps here.
Getting started directly from Azure OpenAI studio allows you to iterate on your ideas quickly. At the time of writing this blog, the completions playground allow 23 different use cases that take advantage of different models under Azure OpenAI.
Summarize issue resolution from conversation
Summarize key points from financial report (extractive )
Summarize an article (abstractive)
Generate product name ideas
Generate an email
Generate a product description (bullet points)
Generate a listicle-style blog
Generate a job description
Generate a quiz
Classify Text
Classify and detect intent
Cluster into undefined categories
Analyze sentiment with aspects
Extract entities from text
Parse unstructured data
Translate text
Natural Language to SQL
Natural language to Python
Explain a SQL query
Question answering
Generate insights
Chain of thought reasoning
Chatbot
Resources
There are different resources to get you started on Azure OpenAI. Here’s a few:
This article is contributed. See the original author and article here.
Busy sales account managers prioritize their activities by mining information from their accounts. But manually making sense of all that unstructured data takes time and can lead to inaccurate assumptions. They can end up focusing on the wrong activities, which results in a lower impact on business outcomes. The most productive and successful account managers are the ones who focus on the right customers with the right priority. Dynamics 365 Sales account-based seller insights can help.
Account-based seller insights help drive priorities
Account-based seller insights help you set priorities and formulate the best engagement plan for your customers. These are automated, actionable insights that are derived from multiple sources of unstructured data and presented to you in the right context. For instance, you might be shown an upsell insight for an account based on past won opportunities for similar accounts, along with guidance on the next best action to take. Seller insights help you proactively manage the customer journey, from the first engagement to the final sale.
Behind the scenes with seller insights
Account-based seller insights can be generated in three ways:
Bring your own model. Use your own AI model, trained on your data, to generate insights, and work with them in the Dynamics 365 sales accelerator.
Use out-of-the-box models. The account-based seller insights solution comes with its own models, which mine the data in Dynamics 365 Sales to generate insights.
Build a back-end rule framework. You can build your own rule framework that uses Power Automate flows to generate insights when certain conditions are met.
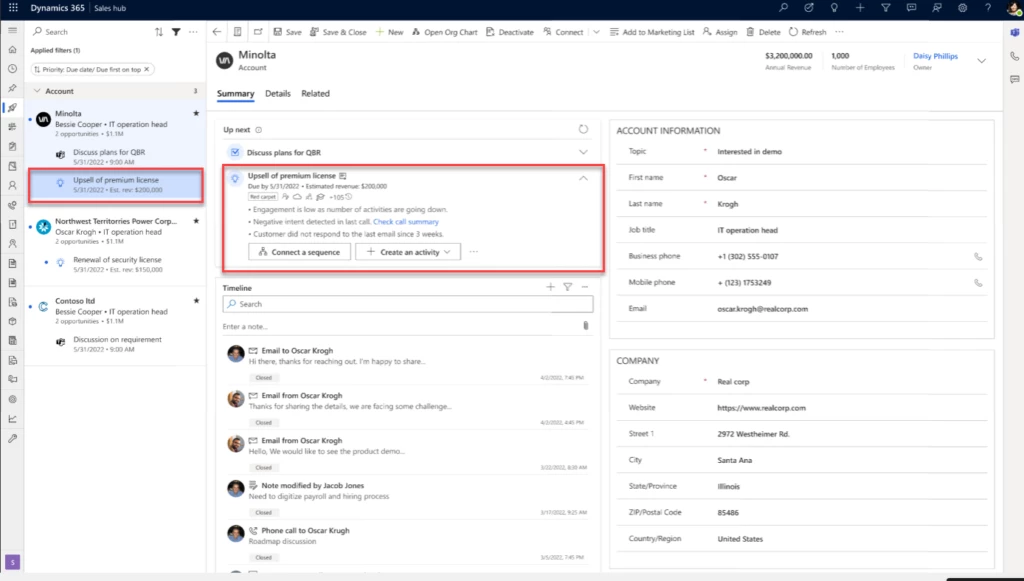
The sales accelerator in Dynamics 365 Sales, with seller insights and next actions highlighted.
How seller insights boost productivity
How can seller insights help you be a more effective sales account manager? Let’s look.
Insight list and actions
First, you get curated insights for all your accounts:
You only see insights that are relevant to you, not your team members.
The insights have expiration dates so that you know the information is fresh and relevant.
You can see the reasons an insight appears in the list.
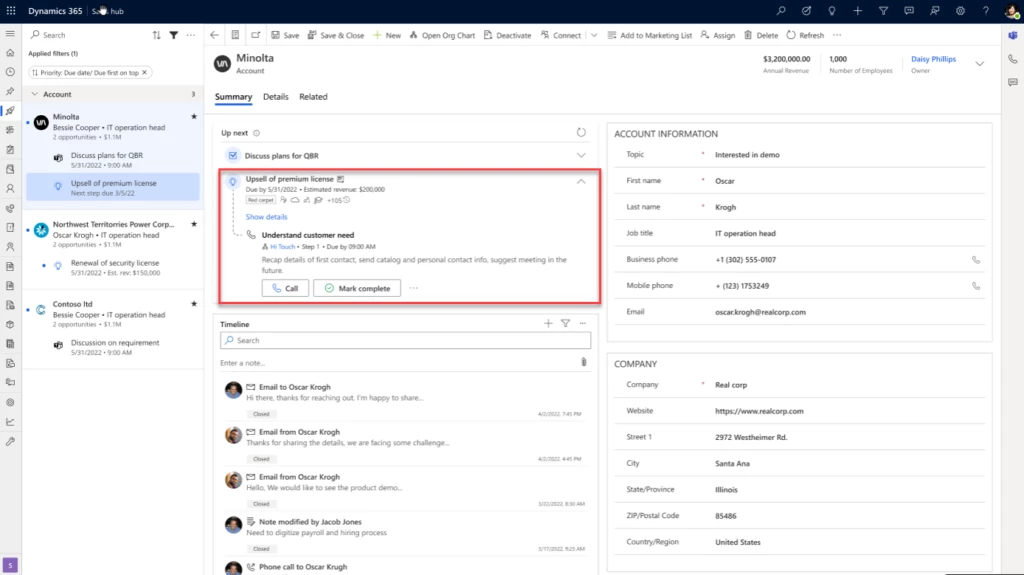
And after you acknowledge an insight, you’re guided through the next best steps to act on it, optimizing the sales workflow for better results. You can also collaborate with team members while you’re working on your insights.
The sales accelerator in Dynamics 365 Sales, with a seller insight and sequence highlighted.
Insight assignment and distribution
Second, although your insights are curated, that doesn’t mean they’re siloed. Insights are assigned to the account owner. If the owner of an entity is a team, an insight can be automatically assigned to the appropriate salesperson on the team, based on role, through the flexible rule framework. Ownership can be transferred from one seller to another, and multiple sellers can work on a single insight.
Insight action history
Finally, you can find all the insights that have been generated for an account on the account’s Insights tab. The list includes status, type, due date, and other helpful information. Filter and sort it to focus on what’s most important. You can easily identify all seller activities for the insights on the timeline view of the account.
By helping you identify your most important and profitable accounts, understand their needs and preferences, tailor your messages and offers, and nurture long-term relationships with them, account-based seller insights can lead to higher revenues, shorter sales cycles, and better customer satisfaction.
It is often required to copy data from on-premises to Azure SQL database, Azure SQL Managed Instance or to any other data store for data analytics purposes. You may simply want to migrate data from on-premises data sources to Azure Database Services. You will most likely want to be able to do this data movement at scale, with minimal coding and complexity and require an automated and simple approach to handle such scenarios.
In the following example, I am copying 2 tables from an On-premises SQL Server 2019 database to Azure SQL Database using Microsoft Fabric. The entire migration is driven through a metadata table approach, so the copy pipeline is simple and easy to deploy. We have used this approach to copy hundreds of tables from one database to another efficiently. The monitoring UI provides flexibility and convenience to track the progress and rerun the data migration in case of any failures. The entire migration is driven using a database table that holds the information about the tables to copy from the source.
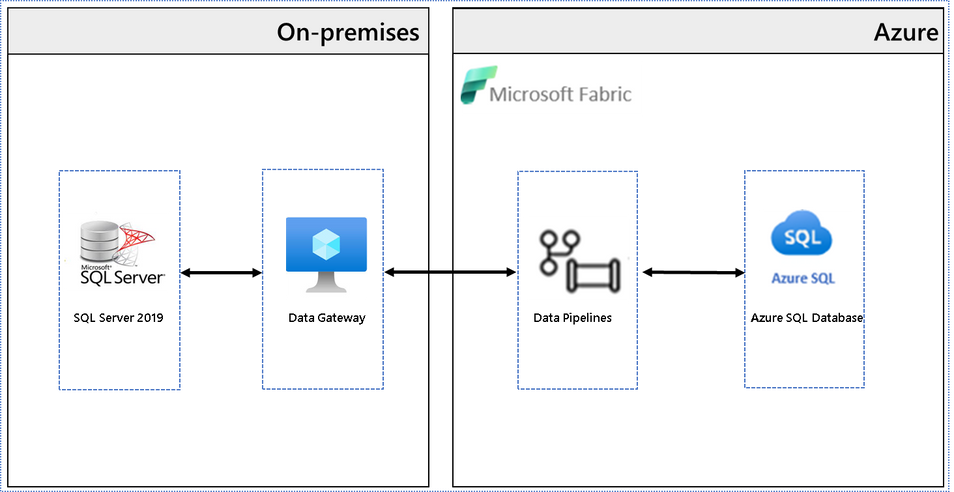
Architecture diagram
This architectural diagram shows the components of the solution from SQL Server on-premises to Microsoft Fabric.
I intend to copy two tables – Customer and Sales – from the source to the target. Let us insert these entries into the metadata table. Insert one row per table.
Ensure that the table is populated. The data pipelines will use this table to drive the migration.
Create Data Pipelines:
Open Microsoft Fabric and click create button to see the items you can create with Microsoft Fabric.
Click on “Data pipeline” to start creating a new data pipeline.
Let us name the pipeline “Copy_Multiple_Tables”.
Click on “Add pipeline activity” to add a new activity.
Choose Azure SQL Database from the list. We will create the table to hold metadata in the target.
Ensure that the settings are as shown in the screenshot.
Click the preview data button and check if you can view the data from the table.
Let us now create a new connection to the source. From the list of available connections, choose SQL Server, as we intend to copy data from SQL Server 2019 on-premises. Ensure that the gateway cluster and connection are already configured and available.
Add a new activity and set the batch count to copy tables in parallel.
We now need to set the Items property, which is dynamically populated at runtime. To set this click on this button as shown in the screenshot and set the value as:
@activity('Get_Table_List').output.value
Add a copy activity to the activity container.
Set the source Table attributes in the copy activity as shown in the screenshot. Click on the edit button and click the “Add dynamic content” button. Ensure that you paste the text only after you click the “Add dynamic content” button, otherwise, the text will not render dynamically during runtime.
Set the Table schema name to:
@item().SourceSchemaName
Set the Table name to:
@item().SourceTableName
Click on the destination tab and set the destination attributes as in the screenshot.
Set the Table schema name to:
@item().TargetSchemaName
Set the Table name to:
@item().TargetTableName
We have configured the pipeline. Now click on save to publish the pipeline.
Run pipeline:
Click the Run button from the top menu to execute the pipeline. Ensure the pipeline runs successfully. This will copy both tables from source to target.
Summary:
In the above example, we have used Microsoft Fabric pipelines to copy data from an on-premises SQL Server 2019 database to Azure SQL Database. You can modify the sink/destination in this pipeline to copy to other sources such as Azure SQL Managed Instance or Azure Database for PostgreSQL. If you are interested in copying data from a mainframe z/OS database, then you will find this blog post from our team also very helpful.
This article is contributed. See the original author and article here.
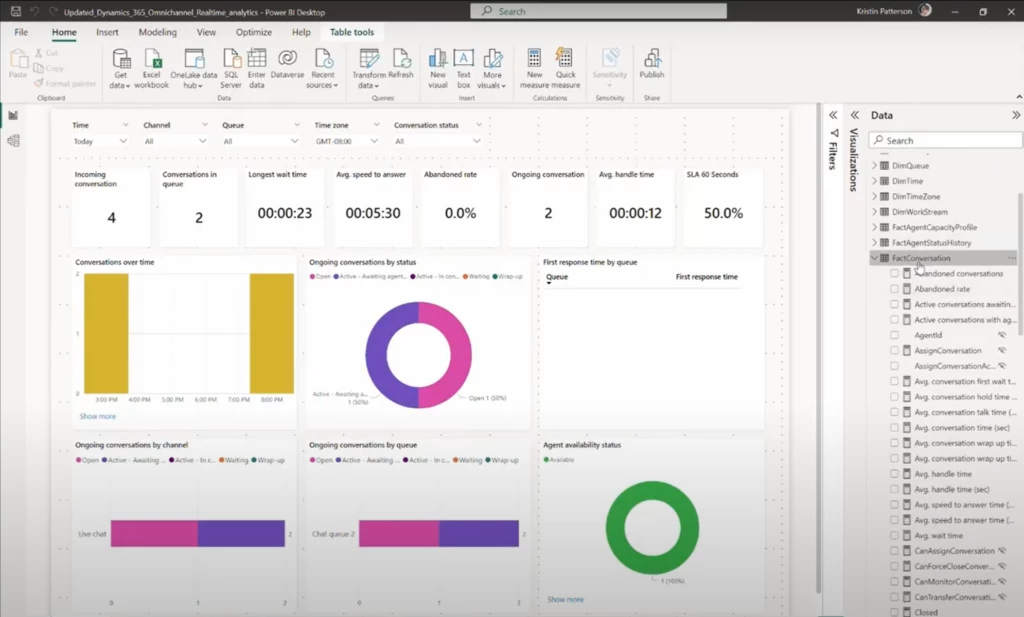
Dynamics 365 Customer Service is a powerful tool for managing your contact center. Its built-in analytic dashboards, such as the recently launched Omnichannel real-time analytics dashboard, provide a wealth of industry standard KPIs and metrics to help you monitor and improve performance. These dashboards are built on Power BI with two components: a data model (or data set) that houses the KPIs, and reports that visualize the data for viewers. Dynamics 365 Customer Service reads the data from Dataverse, performs transformation logic for each of the KPIs, and makes these KPIs available for you within the data model. You can customize data models using data within Dynamics or external data to view metrics tailored to your needs.
Every Dynamics organization that has analytics enabled gets their copy of this solution deployed and available only to them. While the data model is not editable, the reports are fully customizable through visual customization. This way, you can see and use the data in ways that make sense for your organization. You can view metrics outside of what’s in the out-of-box reports. You can also create additional pivots and dimensions to slice the data as needed.
We have received a lot of feedback from you around the need for customizations. You want to modify the data or logic used to calculate metrics in the data set. You also want to create your metrics in addition to the out-of-box metrics available in the data model. Additionally, you want to create variants of existing metrics or calculate metrics differently based on your organization’s unique processes. Another frequent request has been guidance around building custom dashboards that combine KPIs from Dynamics Customer Service with other applications.
To address these scenarios, Dynamics 365 Customer Service launched model customization. This feature deploys a copy of the data set used by the out-of-box reports into your organization’s Power BI workspace. Therefore, you can build composite models that connect to the Dynamics data model.
By leveraging the out-of-box model and only creating the metrics that are unique to your organization, you can reduce the risk of metric definitions going stale as Dynamics updates its capabilities. This also saves you valuable time and development effort. Furthermore, by using model customization, you can build custom reports and dashboards that combine data from multiple applications. This gives you a more complete picture of your contact center’s performance.
Overall, Dynamics 365 Customer Service provides a powerful set of tools for managing your contact center. Its built-in analytic dashboards offer the specific insights you need to improve contact center performance. And with model customization, you can tailor these to your specific needs.
This article is contributed. See the original author and article here.
Since 2019, Microsoft has had a long-standing partnership with OpenAI. The goal: to accelerate breakthroughs in AI and ensure the benefits are broadly shared with the world. A significant milestone in this collaboration occurred in January 2023 with the introduction of Microsoft’s Copilot offerings. Referred to as an “AI collaborator,” Copilot functions as a valuable assistant that works alongside you, enhancing your productivity and efficiency. Our thought leaders across the organization have shared many perspectives on its use spanning approaches to responsible AI to its use in low-code app development. In the last few months, we have also shared several copilot announcements regarding model improvements. AI brings the potential of innovation to every line of business, and in this post we focus on our journey with Copilot in Dynamics 365 Marketing.
The Dynamics 365 Marketing journey began when we launched our first previews of content ideas in May 2022 and query assist in October 2022. The real-world feedback we have received has been instrumental in our learning process. It has allowed us to gain valuable insights, but we acknowledge that there is still much more to learn and accomplish to truly revolutionize the marketing domain. With the technology changing so rapidly, it has also become very clear that we will—the use cases for Copilot in customer experience (CX) are endless. Let’s delve into how these copilot features came to be and highlight our generative AI roadmap moving forward.
Dynamics 365 Marketing
Transform your customer experience with generative AI
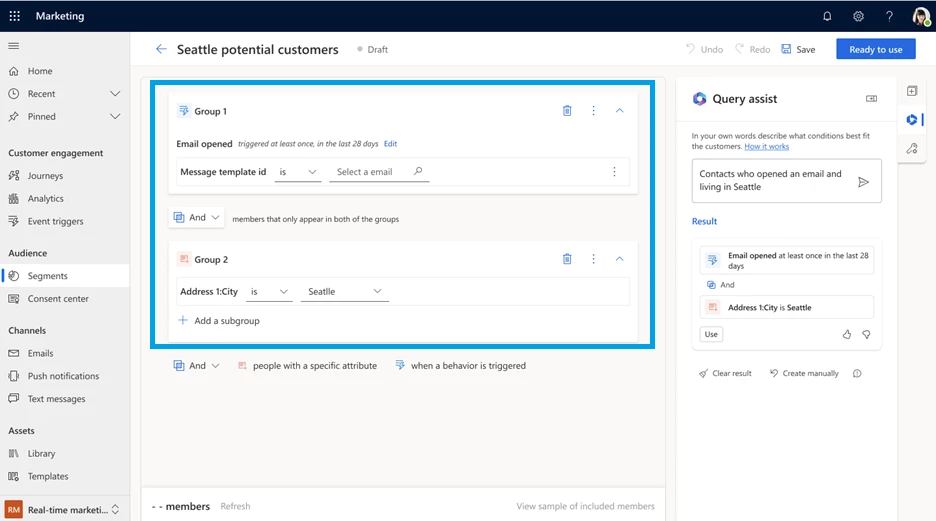
Query assist, using Copilot to democratize segmentation
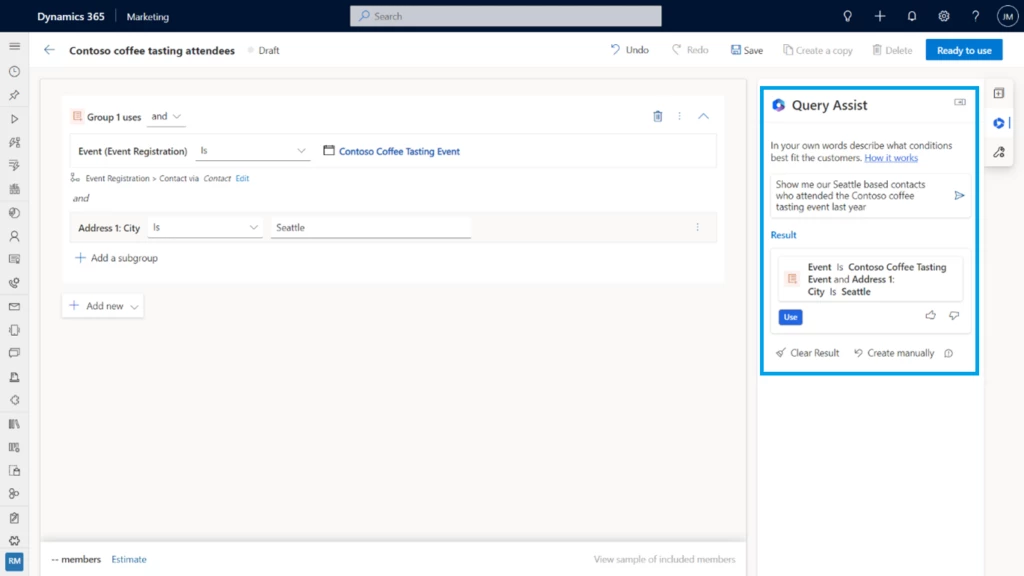
Marketing segmentation enables targeting—choosing an audience based on their characteristics. It could be demographics, psychographics, behaviors, preferences, or a combination thereof. Effective segmentation has traditionally required a thorough understanding of complex data models, database management, and SQL (Structured Query Language). Consequently, marketing organizations frequently face the challenge of relying on a single individual to create segments for the entire team, leading to a bottleneck in the process. The Copilot feature query assist is built upon OpenAI’s GPT foundational model to empower marketers to easily target the right audience by using everyday language to describe and quickly build segments without having to learn data models and construct queries. Directly within their workflow, marketers provide the segment description, and query assist starts to create a new segment and automatically generates the segment rules that marketers can add to the segment definition before publishing the segment.
“Our goal was to develop powerful and user-friendly features to enable everyone to create segments with confidence, while still providing flexibility and power for advanced users. OpenAI was the foundation, but customer needs were the central focus.”
Gaju Gatera, Dynamics 365 Marketing Product Manager for query assist
Ultimately, marketers who use query assist spend less time on segmentation and more time on creating campaigns that truly connect with their customers.
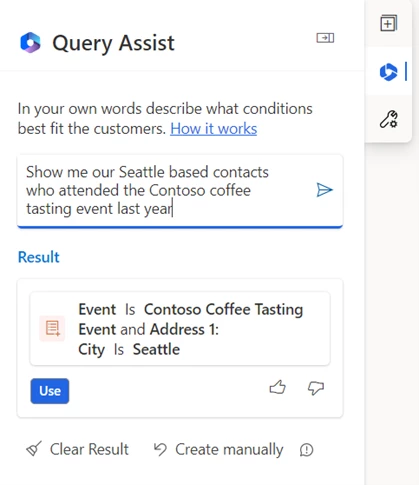
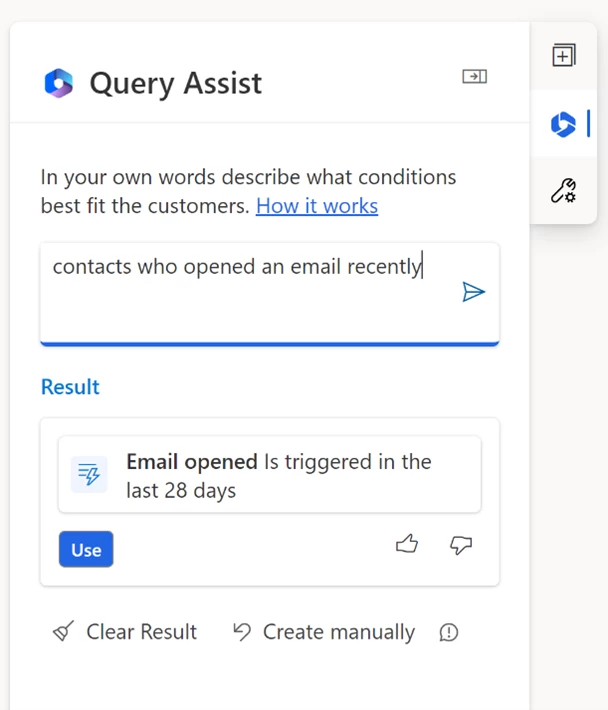
Query assist was initially released with our own AI model. We then experimented with OpenAI GPT and found that query assist could understand different syntaxes from formal language to more conversational language. For instance, users could type “Show me our Seattle based contacts who attended the Contoso coffee tasting event last year” rather than the prior version’s requirement for more structured or SQL-like inputs such as “contacts who live in Seattle city and attended the Contoso coffee tasting event 2022.” This was very encouraging.
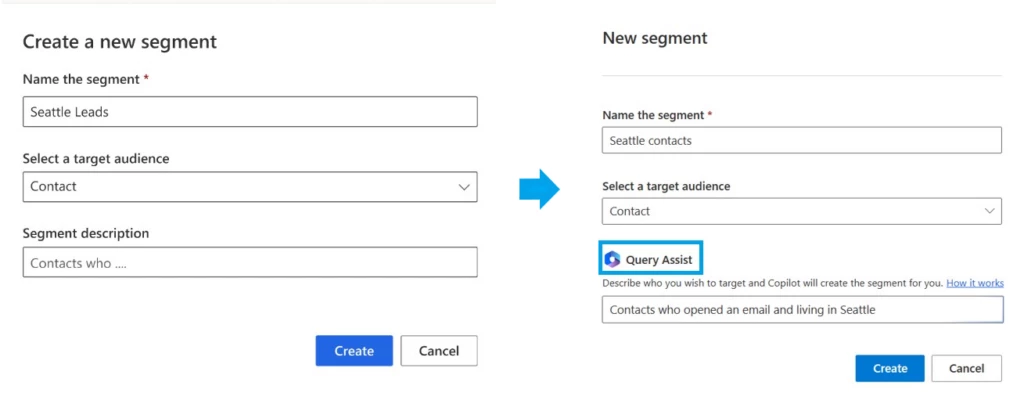
We collaborated with customers to improve the UX and embedded query assist seamlessly into marketers’ workflows. Originally marketers would input a description powered by query assist, land on Copilot, and get stuck without a way to transition back to manual segmentation. So we made sure to highlight query assist in the entry card, and we introduced a button that lets you switch from Copilot and manual segmentation in the canvas, allowing marketers with different levels of expertise to choose the experience that they like most.
We also changed the interaction design and streamlined the UX so that complex segments (requiring relationships traversals) are now created automatically without human intervention; what required three to four manual steps before is now one click as Copilot can create the relationships automatically.
Immediately following the launch of the enhanced version of query assist in March, we’ve seen substantial results where we now see 66 percent of marketers creating segments with query assist. We also saw the accuracy (as measured by thumbs up or down) improve from 15 percent to 86 percent within a month of the release.
We are particularly excited to witness how Copilot is driving positive change and contributing to the success of our customers. Chris Barnhart, Marketing Director at NC Fusion, a professional soccer team and sports organization serving the Triad region of North Carolina is an early adopter of Copilot. As a SQL expert, Chris knows how to design relationships among tables to create segments that engage a wide range of audiences from fans, to parents, to donors. “When I saw how you just type in common phrases and query assist will connect everything for you, I was blown away!” He was thrilled to discover how query assist could simplify his work and make his team more efficient, especially since many of his interns haven’t learned about data structures in school.
Sidney Fernandes, Chief Information Officer and Vice President for Technology at the University of South Florida, shared with us his excitement for the potential of using copilot to empower stakeholders across the organization.
“Once we share this with our teams, it has the potential to be quite transformational. Students and staff won’t need to be educated on the nuances of student data or copywriting to engage the right audiences impactfully.”
Sidney Fernandes, Chief Information Officer and Vice President for Technology at the University of South Florida
Tyler McClain, Senior Solution Consultant with Connected Experience partner Coffee + Dunn tried the feature and shared their experience, saying “Using query assist was quick and easy. I just typed ‘anniversary within the past five years,’ and it gave me exactly what I was looking for. This feature can further empower our clients to engage their customers with ease, and I’m excited to share it with them.”
Encouraged by these positive results we continue to iterate on query assist. We are excited to announce that Copilot now supports segments that include marketing interactions or specific customer behaviors such as “customers who opened an email recently” enabling them to optimize segment creation to drive more effective campaign engagement. We can’t wait to see how marketers use it to drive better results and achieve their business goals.
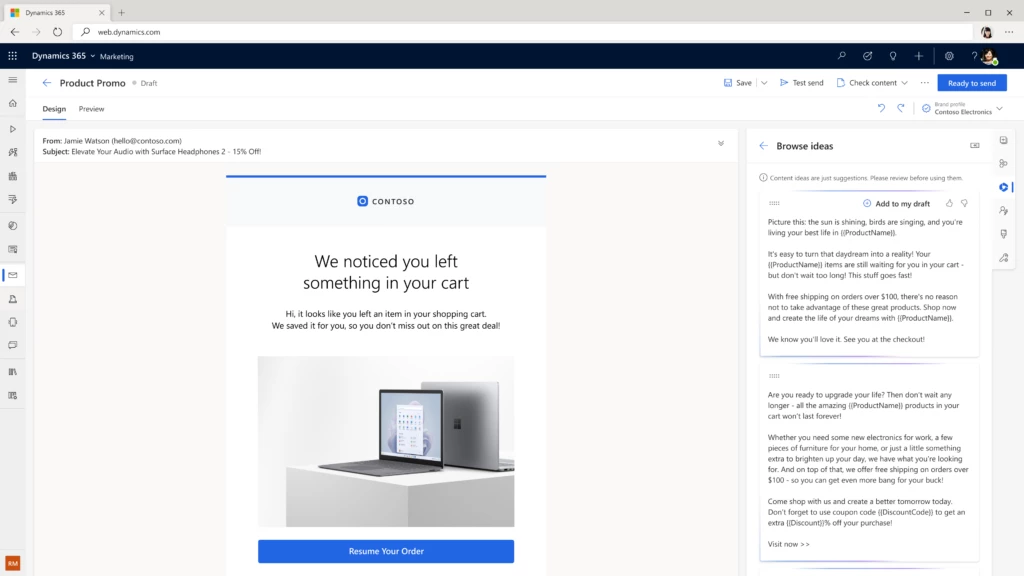
Content ideas, simplifying email creation using Copilot to generate compelling content
Email marketing can be a highly effective way to connect with customers and drive business growth, but it also comes with its challenges. Over time, content can begin to feel stale or repetitive. Producing engaging content for email campaigns is time-consuming and requires significant creative energy.
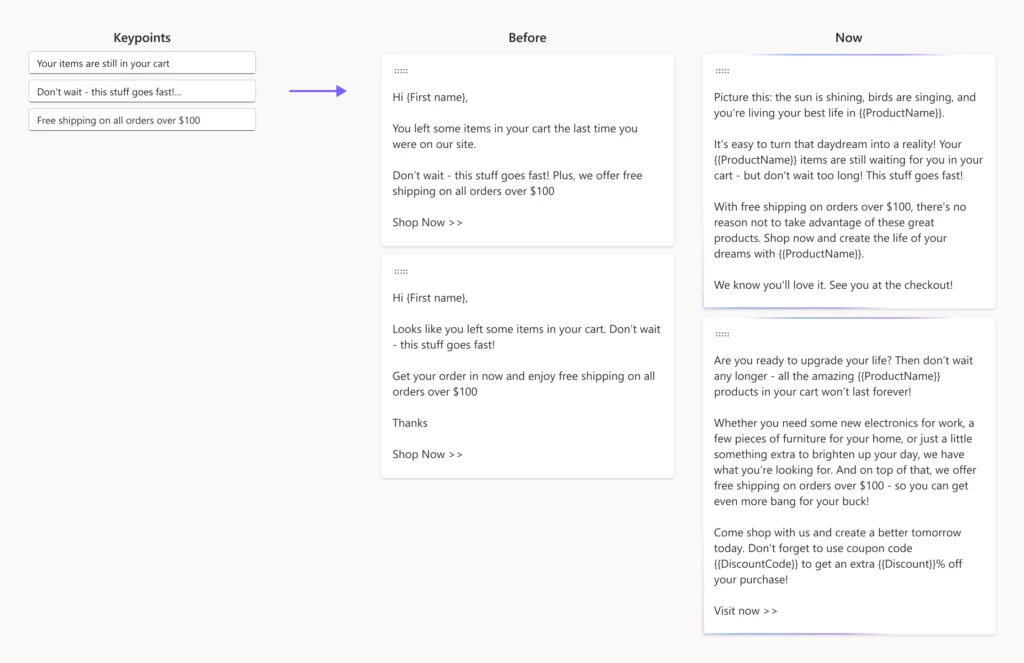
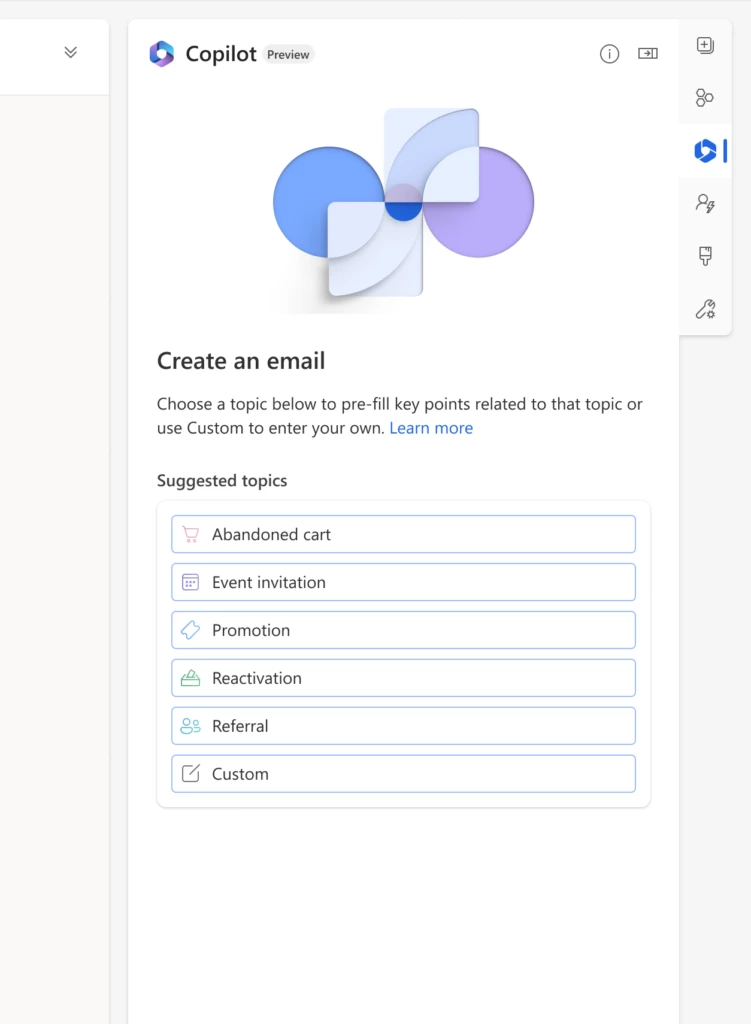
To assist marketers in their email creation, we’ve used OpenAI GPT to develop content ideas. Given a few short key points, Copilot generates engaging email content ideas within seconds that marketers can select from and tweak to perfectly match their needs.
“Content ideas was developed with one goal in mind–saving hours of copywriting, by helping marketers kick-start their email creation and create compelling content within minutes.”
Aga Miskowiec, Principal Product Manager for content ideas
With this innovative tool, writer’s block is becoming a thing of the past, allowing marketers to accelerate the delivery of engaging email campaigns that resonate with their audiences.
After releasing the first iteration of content ideas, we rapidly realized its potential and have been working to refine the approach for over a year. This includes tuning that we haven’t seen in any other products. We tune based on a library of public emails, not for any branding but rather for the type of tone and content a marketer would use. We also enable companies to use content they’ve created in the past to tune the generation of new content.
In March, we took content ideas to the next level by upgrading the language model to OpenAI GPT-3.5, and this had a significant impact on the quality of ideas generated.
Our customers started to see a positive impact on their business Chris Barnhart Marketing director at NC Fusion shared with us that “Normal engagement runs about 20 to 30 percent and there’s a lot of factors that go into the email itself, but with the email written with content ideas the engagement was about 70 percent.”
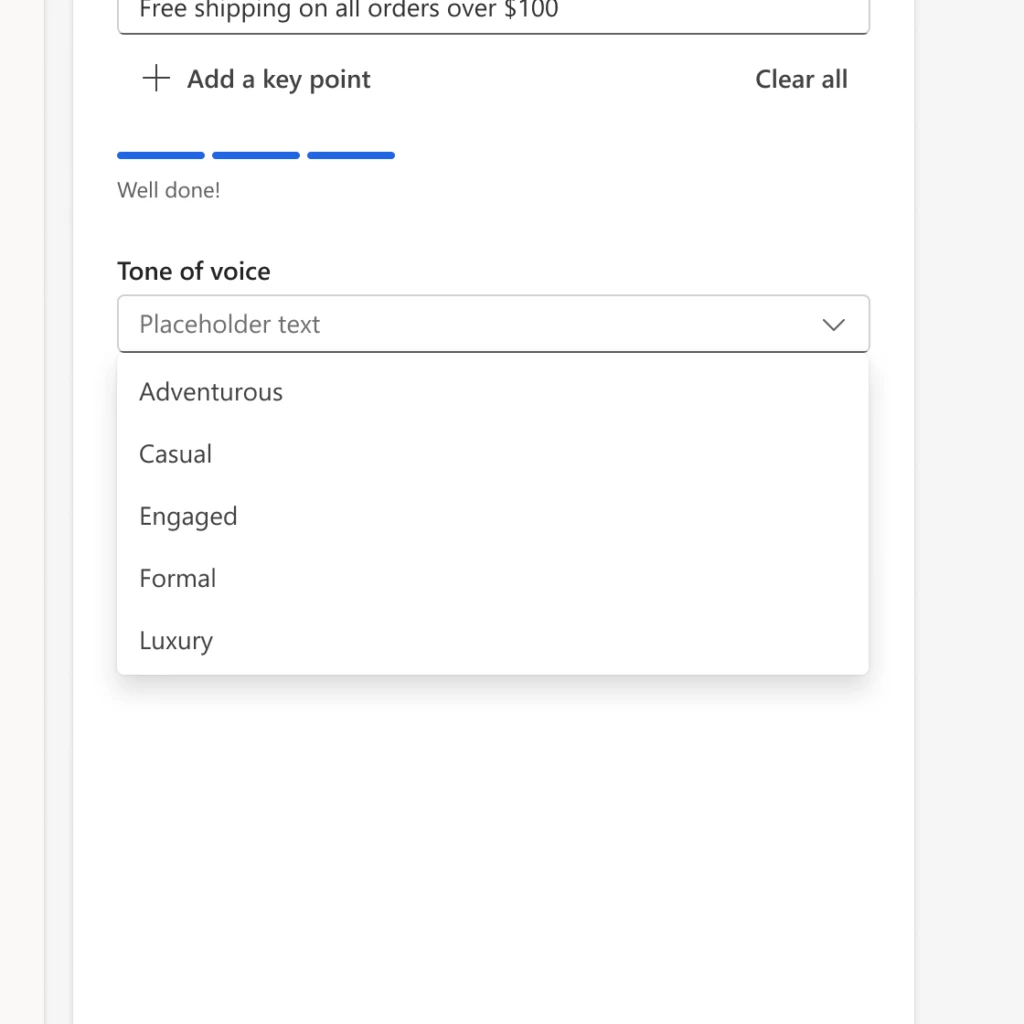
But that’s not all, we’ve also added a range of different tone of voice options to help marketers tailor the content to their brand and audience. Whether they’re looking for an engaging, adventurous, casual, luxury, or formal tone, content ideas has got marketers covered.
“Setting the tone allows Campari Group, a global company, to tailor the tone of voice for each brand and region’s communication style saving us hours of copywriting” according to Liam Barnes, Global IT Director – Marketing Technologies from Campari Group, a worldwide leader in the spirits industry.
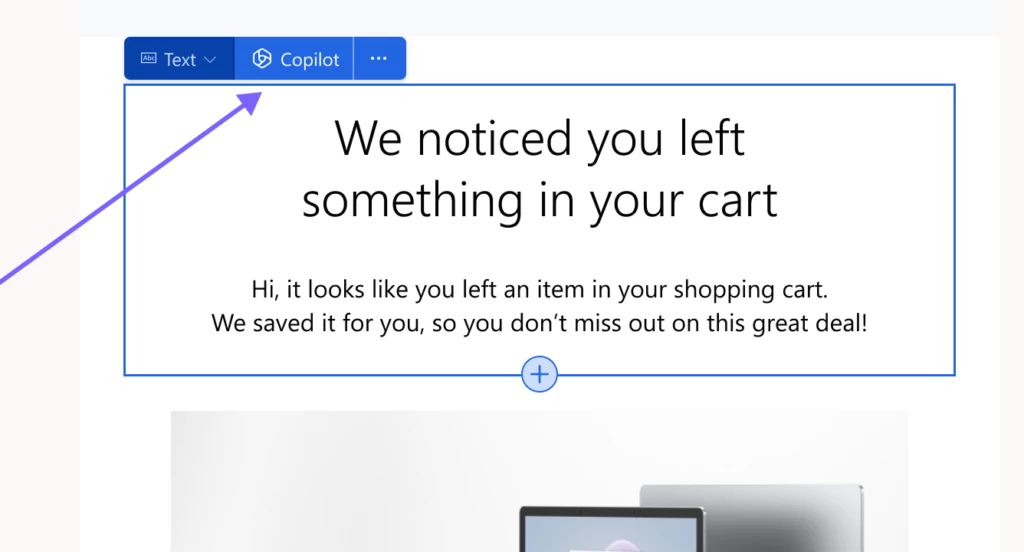
To level up usability, we put content ideas right in the email creation flow where marketers are adding or editing text as our data showed that switching to the Copilot tab was a significant discoverability usage drop off.
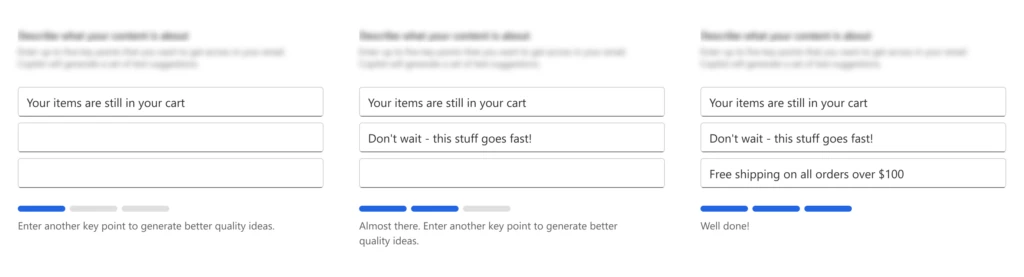
We’ve also gamified our UX to better guide marketers and help them craft higher quality key points used to generate content. “It’s pretty impressive. I was very happy using the feature. Our team has been very happy using the feature–it’s making delivering great content faster and easier.” shared Keith Perfect, Director of Technology and Intelligence from Northrop & Johnson, a luxury yacht brokerage.
As a result, the number of daily users who opened the feature doubled, the percentage of users who generated ideas (out of those who opened the feature) increased by 75 percent. Furthermore, the number of organizations using content ideas daily increased more than 5 times.
Receiving early feedback from our customers and partners who tried the latest version of content ideas was a rewarding experience. Their input helped us prioritize our focus and further enhance customer satisfaction.
“It’s awesome, content ideas helps us tremendously to efficiently produce emails. In fact, I can tell you it was normally at least an hour, and I did it in 15 minutes, it takes me ~25 percent of the time it took before to create email content!”
Chris Barnhart, Marketing Director at NC Fusion
“The results are very creative now, and tone of voice capability is great,” said Steve Smith, Principal Solutions Architect – Data & Artificial Intelligence at TTEC Digital.
And we’re just getting started! We are working on adding personalization, journey creation, brand style creation, and conversation help capabilities, just to name a few.
Our goal is to empower marketers in delivering exceptional customer experiences that drive business success with less effort and time than ever before. With the limitless potential of AI, we eagerly anticipate the future of customer experience.
Get started with Dynamics 365 Marketing
Start using content ideas and query assist today, and see how it can help you boost your productivity while creating deeply personalized experiences.


Recent Comments