What is your role and title? What are your responsibilities associated with your position?
I am a Senior Digital Architect with Sonata Software Europe Limited. I am responsible for delivering the right integration technologies to the customers. I interact with my team members to share the latest updates on various integrations and brainstorm the best fit for the client requirement. My manager provides me additional support in exploring new concepts and encourages us to do POCs with latest updates and share the knowledge to the wider forum.
Can you provide some insights into your day-to-day activities and what a typical day in your role looks like?
I plan my day beforehand, but it takes a different direction as it progresses. This is what my role demands. I am involved in multiple assignments and learn everyday with various challenges. More complex it is, the more growth is my thought, and this keeps me motivated throughout the day. I also offer guidance to other teams, and I get excited when the discussion or the task is for Logic Apps integration.
What motivates and inspires you to be an active member of the Aviators/Microsoft community?
My spouse, Santosh Ramamurthy, always motivates me in upgrading my skills. He supported my learning path and noticed my passion, he advised me to write blogs, sharing techniques via forums.
I started my career in 2006 and have been travelling with Microsoft Technologies for close to 17 years. With the limited resources those days, we had challenges in getting proper guidance. We referred to books and often learnt from our mistakes. I thought our future generation should have a strong foundation on technologies which they can pass on. So, I started writing blogs, attending forums, giving sessions which will motivate the people who are new to the technology or planning to switch the domain. Resources are abundant nowadays. How to use and where to apply is our skill. Logic Apps Aviators is a community which binds the people at all levels – be it beginner, intermediate or expert.
Looking back, what advice do you wish you would have been told earlier on that you would give to individuals looking to become involved in STEM/technology?
As I said earlier, resources are abundant. Learn to use, apply, make mistakes, correct them, and keep moving. Gone are the days where a high-speed PC or a classroom is needed to start your learning path. Most of the technologies are giving free trial and lab environments to encourage the individuals and give an attempt on the new skill. It is only the interest and the passion which keeps their learning spirit on.
What has helped you grow professionally?
Passion for learning new skills, handling complexities are my best teachers. Expand the network and time management is an important skill as we have numerous distractions around us. Tiny drops make a mighty ocean – so learning something new every day (be it simple concept or complex) and we are sure to trace the growth in the learning graph.
Imagine you had a magic wand that could create a feature in Logic Apps. What would this feature be and why?
Logic apps can create wonders in integration when some of the minor features can be incorporated to make them more friendly to the beginners.
For instance, when suggesting recurring API integration with D365FO via logic apps, there comes a question of creating a zipped package file. As most connectors are missing this action and even though azure functions / ADF / third-party tool comes to rescue, integration becomes simpler if available readymade.
Also, a feature to track the state of the previous run – this is needed for integrations to safeguard the data overlap and thus to cancel the run automatically if the previous execution is still in progress.
Read about how Cargolux leveraged Azure’s capabilities to streamline their operations, improve efficiency, and deliver a better experience to their customers.
In this post you’ll learn how we can use Regular Expression functions in the new Data Mapper that helps us validate and transform data to ensure of data consistency.
This article outlines the process of providing secure and controlled access and exposing data from Azure Cosmos DB or Azure SQL by utilizing Azure API Management.
We are excited to announce the consolidation of our BizTalk Server, Host Integration Server and Azure Logic Apps Blogs into the Azure Integration Services Blog
In this post, we are going to discuss some troubleshooting strategies that you can use when developing custom code solutions in Azure Logic Apps (Standard).
In the .NET Framework Custom Code post, we discussed how to author code and debug it. We now want to expand upon that scenario and discuss how we can call an existing assembly from our custom code project.
Harris discusses the issue of encountering a 401 Forbidden error during the deployment of Logic Apps ARM templates and provides steps to resolve it. Learn the potential causes of the error and suggests troubleshooting methods, including adjusting authentication settings and ensuring proper access permissions are set, to successfully deploy the Logic Apps template.
In this video Srikanth discusses Azure Messaging Services’ three most utilized components: Azure Service Bus, Azure Event Grid, and Azure Event Hub. See real-world applications and demonstrations on how these services ensure smooth communication between different parts of a software program.
Developers looking for more cloud skills should read Ryan’s post on mastering GraphQL Resolvers in Azure Cosmos DB. He covers everything from setting up your API Manager Instance to querying and mutating the graph in Azure Cosmos DB.
This article is contributed. See the original author and article here.
Introduction
Companies seek efficiency in their customer engagement activities. Front office salespeople, traveling sales representatives, account managers, and others need to engage efficiently with customers while using Dynamics 365 Sales without spending time to ensure that data flows efficiently between their front-office work environment and the Dynamics 365 Supply Chain Management back-office environment. True end-to-end process integration must work seamlessly across applications, using an integrated process flow from quotation to invoice, to help businesses drive efficiencies in their sales and fulfilment processes, improve accuracy, and reduce lead times.
We are excited to announce the general availability of a set of new features and capabilities that will enhance the efficiency of the prospect-to-cash integration between Dynamics 365 Sales and Dynamics 365 Supply Chain Management. These additions to the prospect-to-cash integration aim to improve efficiency and cover several new features in Dynamics 365 Supply Chain Management 10.0.34, as well as a new Dual-write Supply Chain solution version 2.3.4.203.
This new feature set enables businesses to achieve true end-to-end process support and unlock various benefits. In this blog post, we will briefly showcase and explain the advantages that companies can gain by leveraging this feature set in an integrated scenario between Dynamics 365 Sales and Dynamics 365 Supply Chain Management.
Integrate Sales Quotation Lifecycle
Sales quotations can be created and processed throughout their lifecycle in both Dynamics 365 Sales and Dynamics 365 SCM. It is crucial that when a sales quotation is processed in one application, it is accurately reflected in the other application. Let’s consider a scenario where Dynamics 365 Sales serves as the CRM application. Salespeople utilize Dynamics 365 Sales to create, edit, collaborate on, and communicate sales quotations with customers. From a back-office perspective, it is essential for these sales quotations to be visible in Dynamics 365 SCM. This visibility allows for insights into expected demand, supporting back-office supply planning.
Furthermore, it is equally important for these sales quotations to be accessible in Dynamics 365 SCM to enable collaboration between back-office staff and front-office salespeople. This collaboration enhances sales quotations by incorporating necessary information that only back-office staff possess insights into. Lastly, but certainly not least, it is critical that when a sales quotation is activated and communicated to the customer by the front-office, this event triggers the appropriate quotation update in Dynamics 365 SCM.
With our new feature set, we now allow for such an integrated scenario with fewer touch points, better efficiency, and improved transparency.
Key benefits of this feature include:
End-to-end quotation lifecycle integration:
The sales quotation process can be initiated in either Dynamics 365 Sales or Dynamics 365 SCM and completed in either application, ensuring that changes and lifecycle updates seamlessly flow between both applications. This eliminates the need for manual duplication of sales quotation data and processing.
Unambiguous and transparent quotation lifecycle processing:
With the introduction of new concepts of origin and ownership, it is always clear and transparent which application is responsible for processing the sales quotation. This eliminates human errors in the quotation process.
Reduced cost of ownership:
The end-to-end lifecycle integration is supported without the need for customizations, resulting in reduced costs of ownership.
The integrated sales quotation lifecycle is supported by Dual-write Supply Chain solution version 2.3.4.203 and the following Dynamics 365 SCM 10.0.34 features: Integrate Sales Quotation lifecycle with Dynamics 365 Sales, Copy Supply Chain Management sales quotation data to sales orders synced from Dynamics 365 Sales, Set default ownership for sales quotations when integrated with Dynamics 365 Sales.
To learn more about these features, follow the link:
Before the release of Dual-write Supply Chain solution version 2.3.4.203, in conjunction with Dynamics 365 SCM 10.0.34, the recommended method for integrating pricing between the two applications was to configure Dynamics 365 Sales to utilize the system price calculation. This setup, coupled with the synchronization of totals and subtotals from Dynamics 365 SCM to Dynamics 365 Sales, along with the utilization of price quote and price order actions in Dynamics 365 Sales, as well as the implementation of manual discounts in Dynamics 365 Sales, could lead to a loss of transparency. This lack of transparency pertains to identifying which application controls and calculates the monetary values associated with sales quotations and sales orders, including prices, discounts, subtotals, and totals.
In Dynamics 365 SCM 10.0.34, we introduce two features to simplify and enhance transparency in calculations related to price, discount, subtotal, and total when integrating with Dynamics 365 Sales. The first feature is to designate Supply Chain Management as the price master when integrated with Dynamics 365 Sales. The second feature enables the calculation and pushing of prices, discounts, and totals specifically for selective sales orders and sales quotations when integrated with Dynamics 365 Sales.
Key benefits of these features include:
Calculations for extended amounts, summary amounts, subtotals, and totals for sales quotations and sales orders are not performed in Dynamics 365 Sales; All calculated monetary fields are calculated in and synchronized from Supply Chain Management.
Front-office salespeople can now, if authorized, manually apply a discount from Dynamics 365 Sales which is fully integrated with discounts in Dynamics 365 SCM.
Back-office staff can now calculate and push, whenever needed, all price and discount related updates for one or more sales quotation and sales orders from Dynamics 365 SCM to Dynamics 365 Sales.
To learn more about these features, follow the link:
Front-office salespeople using Dynamics 365 Sales need to work efficiently on quotations and sales orders without unnecessary wait times. They also need to maintain efficiency when Dynamics 365 Sales is integrated with Dynamics 365 SCM. The same applies to back-office staff working on quotations and sales orders in Dynamics 365 SCM. Achieving a smooth user experience and efficiency in these tasks heavily relies on asynchronous processing of events.
Asynchronous processing of Sales-integrated events allows events to be processed asynchronously in Dynamics 365 SCM using the message processor framework. This approach significantly enhances the user experience and performance of sales order and sales quotation integration in various use cases.
Front-office salespeople in Dynamics 365 Sales activates a quotation. This event will update the Sales Quotation in Dynamics 365 SCM to Sent and create a quotation journal.
Front-office salespeople in Dynamics 365 Sales creates an order from a sales quotation won. This event will update the Sales Quotation in Dynamics 365 SCM to Won, create a quotation confirmation journal, link the resulting sales order with the sales quotation, and, if setup, copy sales quotation data from the Dynamics 365 SCM sales quotation to the Dynamics 365 SCM sales order, and synchronize the changes to the sales order in Dynamics 365 Sales.
Back-office staff in Dynamics 365 SCM recalculates and pushes prices and totals for one or more sales quotations and sales orders to Dynamics 365 Sales
Key benefits of this feature include:
The user experience of front-office salespeople in Dynamics 365 Sales will not be impacted any additional time it may take to process integration related events.
Companies can flexibly decide which events to be processed synchronously and which to be processed asynchronously to provide the optimum user experience.
Improved system performance which will have a positive impact on user experience in both applications.
To learn more about this feature and Supply Chain at Microsoft, click below:
We’re excited to launch Free Trial | Microsoft Supply Chain Center Preview , which harnesses generative AI to assist Supply Chain managers in real-time communication with suppliers regarding specific news
This article is contributed. See the original author and article here.
Based on Lesson Learned #368: Connection Retry-Logic using ODBC API code – Microsoft Community Hub I would like to share but was my lesson learned execution TSQL command. Executing a TSQL command connectivity issues or command timeouts can occur, leading to failed executions. To overcome these challenges, it is essential to implement robust error-handling mechanisms. In this article, we will explore how to leverage the ODBC API to retry the execution of TSQL commands when faced with connection drops or command timeouts.
Implementing a Retry Mechanism: The following steps outline how to implement a retry mechanism using the ODBC API.
Catch the error: Surround the TSQL command execution with a try-catch block or equivalent error-handling mechanism. In the catch block, examine the error code or exception to identify connection drops or command timeouts.
Determine the retry conditions: Define the conditions under which a retry should occur. For example, you might retry when the error code corresponds to a dropped connection (e.g., SQLSTATE 08S01) or a command timeout (e.g., SQLSTATE HYT00).
Set a maximum retry limit: To prevent infinite retries, set a maximum retry limit. It is essential to strike a balance between allowing enough retries to handle temporary issues and avoiding prolonged execution times.
Introduce a delay between retries: To avoid overwhelming the database server, introduce a delay between retries. Exponential backoff is a popular technique where the delay increases exponentially after each retry, allowing the server time to recover.
Retry the execution: Once the retry conditions are met, re-execute the TSQL command using the same connection. Remember to handle any additional exceptions that may arise during the retry process.
Track retries: Keep track of the number of retries attempted to monitor the effectiveness of the retry mechanism. This information can be useful for troubleshooting and optimizing the system.
Code
        public void MainRetry()
        {
            // Initialize ODBC environment handle
            IntPtr environmentHandle = IntPtr.Zero;
            String sErrorMsg = "";
            Boolean bExecution = false;
            SQLAllocHandle(1, IntPtr.Zero, out environmentHandle);
            //SQLSetEnvAttr(environmentHandle, 201, (IntPtr)2, 0);
            SQLSetEnvAttr(environmentHandle, 200, (IntPtr)380, 0);

            bExecution = bMainRetryExecution(environmentHandle, ref sErrorMsg,"WAITFOR DELAY '00:02:50'",4 );
            if(!bExecution)
            {
                Console.WriteLine("Error: " + sErrorMsg);
            }
            else
            {
                Console.WriteLine("Execution correctly");
            }
            SQLFreeHandle(1, environmentHandle);
        }

        public Boolean bMainRetryExecution(IntPtr environmentHandle,
                                           ref string sErrorMsg,
                                           string sQuery = "SELECT 1",
                                           int iRetryCount = 1)
        {
            // Initialize ODBC connection and statement handles
            Boolean bExecute = false;
            int retryIntervalSeconds = 2;

            for (int i = 1; i <= iRetryCount; i++)
            {
                try
                {
                    IntPtr connectionHandle = IntPtr.Zero;
                    IntPtr statementHandle = IntPtr.Zero;
                    int retcode;

                    Console.WriteLine("Try to execute {0} of {1} Query: {2}", i, iRetryCount, sQuery);
                    retcode = SQLAllocHandle(2, environmentHandle, out connectionHandle);
                    if (retcode == -1)
                    {
                        sErrorMsg = "Not possible to obtain the environment Handle";
                    }
                    else
                    {
                      if (RetryLogicUsingODBCAPI(connectionHandle) == -1)
                      {
                            sErrorMsg = "Connection was not possible after the retries";
                      }
                      else
                      {
                            retcode = SQLAllocHandle(3, connectionHandle, out statementHandle);
                            if (retcode == -1)
                            {
                                sErrorMsg = "Not possible to obtain the statementHandle";
                            }
                            else
                            {
                                SQLSetStmtAttr(statementHandle, SQL_ATTR_QUERY_TIMEOUT, (IntPtr)(30*(i)), 0);
                                retcode = SQLExecDirect(statementHandle, sQuery, sQuery.Length);
                                if (retcode == -1)
                                {
                                    GetODBCErrorDetails(statementHandle, 3);
                                    sErrorMsg = "Error: not possible to execute the query.";
                                    System.Threading.Thread.Sleep(1000 * retryIntervalSeconds);
                                    retryIntervalSeconds = Convert.ToInt32(retryIntervalSeconds * 1.5);
                                }
                                else
                                {
                                    SQLDisconnect(connectionHandle);
                                    SQLFreeHandle(3, statementHandle);
                                    SQLFreeHandle(2, connectionHandle);
                                    sErrorMsg = "Command executed correctly";
                                    bExecute = true;
                                    break;
                                }
                            }
                        }
                    }
                }
                catch (Exception ex)
                {
                  Console.WriteLine("Error: " + ex.Message);
                  sErrorMsg = "Error: " + ex.Message;
                }
            }
            return bExecute;
        }
Explanation:
The script demonstrates a retry mechanism for executing TSQL commands using the ODBC API. Let’s go through the code step by step:
MainRetry() is the entry point method. It initializes the ODBC environment handle (environmentHandle) using the SQLAllocHandle() function. The SQLSetEnvAttr() function is called to set an attribute related to query execution time. Then, it calls the bMainRetryExecution() method to perform the actual execution.
bMainRetryExecution() is the method responsible for executing the TSQL command and handling retries. It takes the ODBC environment handle (environmentHandle), an error message string (sErrorMsg), the TSQL query string (sQuery), and the number of retry attempts (iRetryCount) as parameters.
Inside the method, a loop is set up to attempt the execution multiple times based on the specified iRetryCount. The loop starts with i set to 1 and continues until it reaches iRetryCount.
Within each iteration of the loop, the method attempts to execute the TSQL command. It first initializes the ODBC connection handle (connectionHandle) using SQLAllocHandle().
If obtaining the connection handle fails (retcode == -1), an error message is set, indicating the inability to obtain the environment handle.
If obtaining the connection handle is successful, the method calls RetryLogicUsingODBCAPI() to handle the retry logic for the connection. The details of this method are not provided in the code snippet, but it likely includes connection establishment and retry mechanisms specific to the application. You could find more information here: Lesson Learned #368: Connection Retry-Logic using ODBC API code – Microsoft Community Hub
Once the retry logic completes, the method proceeds to allocate the ODBC statement handle (statementHandle) using SQLAllocHandle(). If the allocation fails, an error message is set.
If the statement handle is successfully allocated, the method sets the query timeout attribute using SQLSetStmtAttr(), adjusting the timeout value based on the current retry attempt (30*(i)).
The TSQL command is then executed using SQLExecDirect() with the statement handle and the provided query string. If the execution fails (retcode == -1), the GetODBCErrorDetails() method is likely called to retrieve specific error information. The code sets an appropriate error message in the sErrorMsg variable, waits for a specified interval using Thread.Sleep(), and increases the retry interval by multiplying it by 1.5. Of course, we could capture the error and depending if the execution and provide other ways to react , also, remember that the connection would be re-stablished – Lesson Learned #381: The connection is broken and recovery is not possible message using API ODBC – Microsoft Community Hub
If the execution succeeds, the code disconnects from the database, frees the statement and connection handles using SQLDisconnect(), SQLFreeHandle(), and SQLFreeHandle(), respectively. It sets a success message in sErrorMsg, sets bExecute to true, and breaks out of the retry loop.
Finally, the method catches any exceptions that occur during the execution and sets the error message accordingly.
The method returns the bExecute flag to indicate whether the execution was successful (true) or not (false).
The provided code showcases a basic retry mechanism utilizing the ODBC API for executing TSQL commands.
This article is contributed. See the original author and article here.
As organizações estão cada vez mais dependendo de tecnologias em nuvem para melhorar a eficiência e otimizar as operações no ambiente empresarial acelerado de hoje. À medida que a adoção da nuvem cresce, também aumenta a demanda por medidas de segurança robustas para proteger dados e aplicativos sensíveis. A certificação AZ-500 Microsoft Azure Security Technologies tem o objetivo de fornecer aos profissionais as habilidades e o conhecimento necessários para proteger a infraestrutura, os serviços e os dados do Azure.
A abordagem de Segurança Zero Trust, que parte do pressuposto de que todos os usuários, dispositivos e redes são não confiáveis e requerem verificação constante, é uma das metodologias de segurança mais críticas da indústria atualmente. À medida que as empresas adotam a tecnologia de Inteligência Artificial (IA), surgem novas preocupações de segurança, tornando crucial que as organizações se mantenham atualizadas nas práticas de segurança mais recentes.
Este guia de estudos fornece uma visão geral dos objetivos do exame AZ-500, que incluem controles de segurança, gerenciamento de identidade e acesso, proteção da plataforma, proteção de dados e aplicativos, além de recursos de governança e conformidade no Azure.
O que esperar no exame
O Exame AZ-500 mede o conhecimento do aluno em implementar, gerenciar e monitorar a segurança de recursos no Azure, em ambientes multi-cloud e híbridos. Isso inclui recomendação de componentes de segurança e configurações para proteger identidade e acesso, dados, aplicativos e redes.
O exame consiste em 40 a 60 perguntas e tem duração de 180 minutos. Você pode encontrar perguntas de múltipla escolha, bem como perguntas de arrastar e soltar e perguntas de área ativa na tela.
Recursos adicionais de aprendizado
Se você não tem muita familiaridade com computação em nuvem, recomendo estudar a trilhaAzure Fundamentals:
As porcentagens indicadas em cada tópico da prova são referentes ao peso / volume de questões que você poderá encontrar no exame.
AZ-500 Microsoft Azure Security Technologies
Gerenciar identidade e acesso (25-30%)
Para gerenciar efetivamente identidade e acesso, os alunos devem ser capazes de projetar e implementar soluções de acesso seguras, como multi-factor authentication e políticas de acesso condicional. Eles também devem ter um bom entendimento do Azure Active Directory e ser capazes de gerenciar contas de usuário, grupos e funções.
Os alunos devem ser capazes de projetar e implementar soluções de rede seguras, como redes virtuais privadas (VPNs), Azure ExpressRoute e Azure Firewall no que se refere à segurança de rede. Eles também devem entender os grupos de segurança de rede (NSGs) e a proteção contra DDoS do Azure.
Planejar e implementar a segurança para acesso público aos recursos do Azure
Compute, armazenamento e bancos de dados seguros (20-25%)
Os alunos devem estar familiarizados com recursos de segurança do Azure, como Azure Security Center e Azure Key Vault, para garantir a segurança de computação, armazenamento e bancos de dados. Além disso, eles devem ser capazes de projetar e implementar soluções de armazenamento seguras, como criptografia do Azure Storage e Azure Backup. Eles também devem ser capazes de usar recursos de segurança de banco de dados, como auditoria do Azure SQL Database e Criptografia de Dados Transparente (TDE).
Tópicos abordados:
Planejar e implementar a segurança avançada para computação
Planejar e implementar a segurança para armazenamento
Por fim, os alunos devem ser capazes de gerenciar operações de segurança de forma eficaz. Isso inclui monitorar logs e alertas de segurança, responder a incidentes de segurança e implementar políticas e procedimentos de segurança. Eles também devem ter um bom entendimento dos requisitos de conformidade, como GDPR e HIPAA.
Tópicos abordados:
Planejar, implementar e gerenciar a governança para segurança
Gerenciar a postura de segurança usando o Microsoft Defender para Nuvem
Configurar e gerenciar a proteção contra ameaças usando o Microsoft Defender para Nuvem
Configurar e gerenciar soluções de automação e monitoramento de segurança
Documentação técnica
Azure Active Directory:Gerencie identidades de usuários e controle o acesso a seus aplicativos, dados e recursos com o Microsoft Azure Active Directory (Azure AD), um componente do Microsoft Entra.
Azure Firewall:Saiba como instalar e configurar o Firewall do Azure, um serviço de segurança de rede baseado em nuvem.
Azure Firewall Manager:Descubra como configurar o Azure Firewall Manager, um serviço de gerenciamento de segurança global.
Azure Application Gateway:Descubra como criar gateways de aplicativos. Esta documentação ajudará você a planejar, implantar e gerenciar o tráfego da Web para seus recursos do Azure.
Azure Front Door e CDN:O Azure Front Door é um ponto de entrada escalonável e seguro para fornecer aplicativos Web globais rapidamente.
Web Application Firewall:O Web Application Firewall (WAF) protege seus aplicativos da Web contra explorações e vulnerabilidades comuns. O WAF pode ser implantado no Azure Application Gateway ou no Azure Front Door Service.
Azure Key Vault:Aprenda a usar o Key Vault para gerar e gerenciar chaves que permitem acessar e criptografar recursos, aplicativos e soluções em nuvem. Tutoriais, referências de API e muito mais estão disponíveis.
Políticas Azure virtual network service endpoint:As políticas de endpoint de serviço de rede virtual (VNet) filtram o tráfego de rede virtual de saída para contas de armazenamento do Azure no ponto de extremidade de serviço e permitem a exfiltração de dados para contas específicas. As conexões de ponto de extremidade de serviço para armazenamento do Azure permitem controle de acesso granular para tráfego de rede virtual.
Manage Azure Private Endpoints – Azure Private Link:A configuração e implantação de endpoints privados do Azure são adaptáveis. Consultas de link privado revelam GroupId e MemberName. Os valores GroupID e MemberName são necessários para configurar um endereço IP estático para um endpoint privado durante a criação. O endereço IP estático e o nome da interface de rede são propriedades de terminal privado. Crie o terminal privado com essas propriedades. Um provedor de serviços e um consumidor devem aprovar uma conexão de serviço de link privado.
Crie um serviço de link privado usando o portal do Azure:Comece desenvolvendo um serviço de Link Privado que se refira ao seu serviço. Permita o acesso do Link Privado ao seu serviço ou recurso protegido pelo Azure Standard Load Balancer. Os usuários do seu serviço têm acesso privado de sua rede virtual.
Azure DDoS Protection Standard:Saiba como a Proteção DDoS do Azure, quando combinada com as práticas recomendadas de design de aplicativos, fornece defesa contra ataques DDoS.
Endpoint Protection em VMs Windows no Azure:Saiba como instalar e configurar o cliente Symantec Endpoint Protection em uma máquina virtual (VM) existente do Windows Server. Este cliente completo inclui proteção contra vírus e spyware, um firewall e prevenção contra invasões. Usando o VM Agent, o cliente é instalado como uma extensão de segurança.
Políticas de uso e segurança – Azure Virtual Machines:É fundamental manter sua máquina virtual (VM) segura para executar aplicativos. Proteger suas VMs pode incluir um ou mais serviços e recursos do Azure que cobrem o acesso seguro à VM e o armazenamento de dados. Este artigo ensinará como proteger sua máquina virtual e seus aplicativos.
Security – Azure App Service:Descubra como o Serviço de Aplicativo do Azure pode ajudá-lo a proteger seu aplicativo Web, back-end de aplicativo móvel, aplicativo de API e aplicativo de funções. Ele também demonstra como proteger ainda mais seu aplicativo usando os recursos integrados do Serviço de Aplicativo. Os componentes da plataforma do Serviço de Aplicativo, como máquinas virtuais do Azure, armazenamento, conexões de rede, estruturas da Web, gerenciamento e recursos de integração, são ativamente protegidos e reforçados.
Azure Policy: Com definições de política que impõem regras e efeitos para seus recursos, o Azure Policy ajuda você a gerenciar e prevenir problemas de TI.
Visão Geral do Microsoft Defender for Servers:O Microsoft Defender for Servers protege seus servidores Windows e Linux em execução no Azure, Amazon Web Services (AWS), Google Cloud Platform (GCP) e on-premises. A detecção e resposta de endpoint (EDR) e outros recursos de proteção contra ameaças são fornecidos pela integração do Defender for Servers com o Microsoft Defender for Endpoint. Descubra como projetar e planejar uma implantação bem-sucedida do Defender for Servers.
Microsoft Defender for Cloud:O Microsoft Defender for Cloud protege cargas de trabalho de nuvem híbrida com gerenciamento de segurança unificado e proteção avançada contra ameaças.
Visão Geral – Microsoft Threat Modeling Tool:O ciclo de vida de desenvolvimento de segurança da Microsoft depende da ferramenta de modelagem de ameaças (SDL). Ele permite que os arquitetos de software identifiquem e mitiguem potenciais problemas de segurança desde o início, quando eles são relativamente simples e baratos de corrigir. Reduz significativamente os custos de desenvolvimento. Projetamos a ferramenta para especialistas que não são de segurança para simplificar a modelagem de ameaças para todos os desenvolvedores, fornecendo orientações claras sobre como criar e analisar modelos de ameaças.
Azure Monitor: Serviços de monitoramento no Azure e no local. Métricas, logs e rastreamentos podem ser agrupados e analisados. Envie alertas e notificações ou use soluções automatizadas.
Microsoft Sentinel:Saiba como começar a usar o Microsoft Sentinel por meio de casos de uso. Com o SIEM reinventado para o mundo moderno, você pode ver e interromper as ameaças antes que elas causem danos. O Microsoft Sentinel oferece uma visão panorâmica da empresa.
Azure Storage:O Armazenamento do Azure fornece armazenamento para objetos, arquivos, discos, filas e tabelas. Há também serviços para soluções de armazenamento híbrido, bem como serviços para transferência, compartilhamento e backup de dados.
Azure Files:Compartilhamentos de arquivos em nuvem de nível empresarial que são simples, seguros e sem servidor.
Azure SQL:Encontre documentação para os produtos do mecanismo de banco de dados SQL do Azure na nuvem, incluindo banco de dados SQL do Azure, instância gerenciada do Azure SQL e SQL Server na VM do Azure.
Espero que este guia tenha sido útil na preparação para o exame de certificação AZ-500 e deseja a você boa sorte em sua jornada de certificação!
This article is contributed. See the original author and article here.
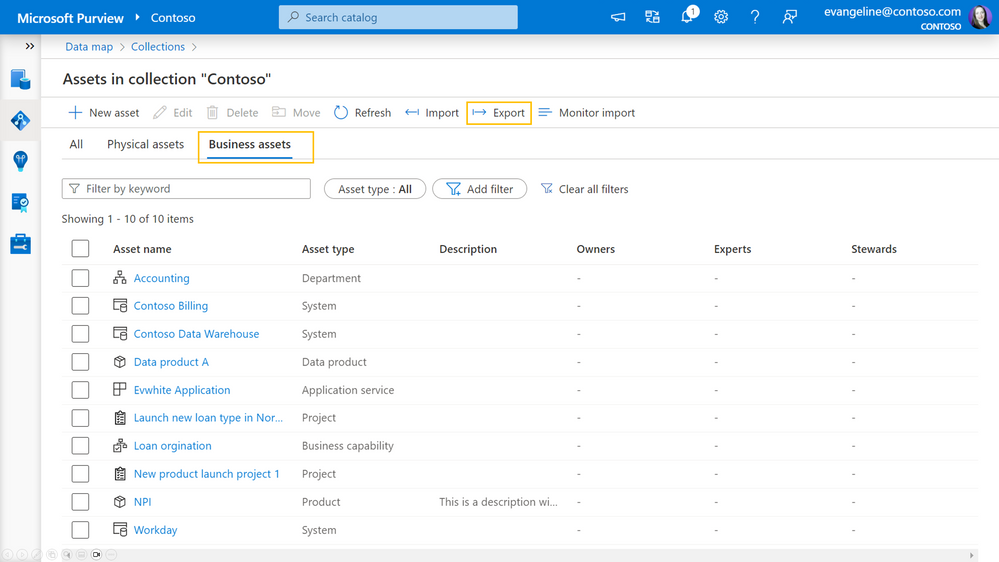
One of the easiest ways to curate metadata is to pull all the information you need into a csv file so you work quickly in a spreadsheet, then make updates in bulk by importing information. You can now do this in Microsoft Purview.
Right now, you can only export one asset type at a time, and this only works for business assets. We plan to offer import and export for data assets in the future.
Exporting assets is easy. Just go to any collection, select business assets, and export:
Select the asset type you want to export. Reminder, we only support one asset type at time:
You’ll get csv of your assets, their guides, and the fields you chose to export. To import, just update the file with the information you want, and import into the right collection.
This article is contributed. See the original author and article here.
Introduction:
Have you ever found yourself in a situation where you needed to stream Microsoft Defender for Cloud data to another system? Microsoft Defender for Cloud provides the option of streaming data like recommendations and security alerts, to a Log Analytics workspace, event hub, or another SIEM solution. This capability is called continuous export.
Imagine if the system you want to stream Microsoft Defender for Cloud data is located behind the firewall. How would you go about doing that? This article teaches you how to accomplish this scenario by configuring export as a trusted service.
To configure Continuous export as a trusted service, you need to perform the following steps in sequence:
Identify the destination event hub.
Add the relevant role assignments on the destination event hub.
Configure continuous export as a trusted service to use the destination event hub.
Verify data is being exported to the destination event hub.
The first step is identifying the event hub used to stream data from Defender for Cloud, to the system located behind the firewall.
Identify the destination event hub
Event hub provides you with a way to ingest data and integrate with other Azure services, like Defender for Cloud. For the purposes of configuring continuous export to stream data located behind a firewall you can either use an existing event hub or create a new one.
After you identify the event hub to be used as the destination for your Defender for Cloud data, you need to grant the continuous export service access the necessary permissions.
Add the relevant role assignment on the destination event hub
To add the necessary permissions, perform the following actions:
Navigate to the Event Hubs dashboard.
Click the destination Event Hub.
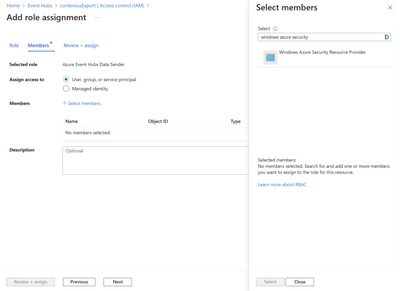
Select Access Control > Add role assignment > Azure Event Hubs Data Sender.
Click + Select members > Windows Azure Security Resource Provider (like in figure 1).
Select > Review + assign.
Figure 1. Adding the relevant role assignment on the destination event hub
After you add the relevant permissions to the event hub, you can proceed to the next step of configuring continuous export.
Configure continuous export as a trusted service to use the destination event hub
To configure continuous export, you need to have write permissions on the event hub policy. Imagine you wanted to stream data related to recommendations and security alerts in near real-time, to a system located behind a firewall. To achieve this scenario, perform the following actions:
Navigate to the Cloud for Cloud dashboard.
Select Environment settings.
Click the desired subscription.
On the left, select Continuous export.
Select Event hub.
Select Security recommendations and Security alerts.
Under Export frequency select streaming updates.
Ensure Export as a trusted service is selected (like in figure 2).
Choose the destination event hub.
Figure 2. Ensure that Export as a trusted service is selected
If you need further guidance on how to configure continuous export as a trusted service you can start here.
After you perform these actions, you can optionally verifying that data is being sent to the destination event hub.
Conclusion:
Configuring continuous export as a trusted service to event hub, allows you to stream Defender for Cloud data to a system located behind a firewall. For the purposes on this article, I focus on teaching you how to configure continuous export with the portal. However, for large organizations it’s recommended to use something like Azure policy to configure this scenario at scale. To configure continuous export as a trusted service to event hub you can use the following Azure policy: Deploy export to Event Hub as a trusted service for Microsoft Defender for Cloud data. The respective policy definition ID is af9f6c70-eb74-4189-8d15-e4f11a7ebfd4.
Reviewers:
Arik Noyman, Principal Group Software Engineering Manager,
This article is contributed. See the original author and article here.
In this blog post, we will show you how to get started on your journey with generative AI for Microsoft Dynamics 365 Business Central. Microsoft’s unique partnership with OpenAI allows us to bring the innovative power of large-scale language models (LLM) to the Business Central ecosystem in a unique, complete, and responsible way. Microsoft Azure OpenAI Service provides access to OpenAI’s advanced models such as GPT-4, GPT-3, Codex, and DALL-E with the security and enterprise features of Azure.
Over the last few months, we’ve listened to many community ideas on how generative AI can enrich existing features, or deliver entirely new customer value, and the follow-up question is always the same: how do I get started with AI in AL and Visual Studio Code? We’ve collected a few tips, including sample code, to make it easy for you to start exploring Azure OpenAI and share your learnings with the community.
New to generative AI?
We appreciate that there is much to learn about this new and exciting technology. If you’re new to this branch of machine learning and Azure OpenAI, these links are a great introduction to understand the basics.
Explore key Responsible AI guidelines and principles at https://aka.ms/RAI
How to get started with your AL code
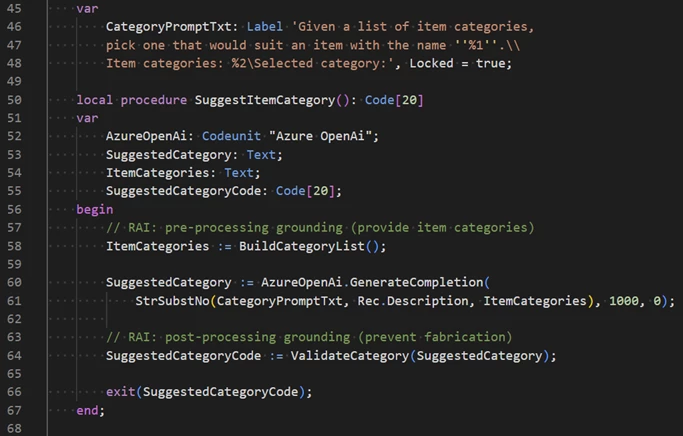
We’ve shared some sample code as an extension that enables you to explore the possibilities of LLM. This code is designed to simplify the process of setting up and running LLM experiments, starting with easily configuring and testing your connection to the Azure OpenAI service. After that, you can extend your AL logic to do more exciting things with this code.
The sample code uses Azure OpenAI to suggest an item category based on the item description field.
The extension’s source code is available at the Business Central BCTech repository on GitHub. You can get to it directly at https://aka.ms/BCStartCodingWithAI. You can either download or install the sample extension to your sandbox environment or clone the source code for your own projects.
How to get an Azure OpenAI key
To use Azure OpenAI Service, you need to have an Azure subscription and apply for access to the service. Azure OpenAI is generally available with a limited access policy to promote responsible use and limit the impact of high-risk use cases. Once you apply and are approved, you will receive an email with instructions on how to create an Azure OpenAI resource and get your API key.
How to use the Azure OpenAI playground
Azure AI Studio offers an Azure OpenAI playground: a web-based interface that allows you to explore the capabilities of generative AI models and try them out with your own prompts and data. You can access the playground from the Azure portal or from this link: Azure OpenAI Studio.
If you’re not a developer but have played around with ChatGPT or similar, you will find the playground to be a convenient place to experiment and assess whether ChatGPT is a suitable tool to solve the problem at hand. It’s perfect for product managers, designers and consultants looking to get their feet wet without having to write code or without having to build a deep understanding of the underlying technology.
And if you’re ready to dive into the more technical side of things, the playground lets you choose a model, a scenario, and a few shot learning examples to generate outputs. You can also modify the parameters such as temperature, top-p, frequency penalty, and presence penalty to control the randomness and diversity of the outputs.
How to get started with prompt engineering
Prompt engineering is the art of crafting effective inputs for generative models to produce desired outputs. Prompt engineering involves understanding the model’s capabilities and limitations, choosing the right format and tone for the input, providing relevant examples and instructions, and evaluating the output quality and reliability. Prompt engineering is a crucial skill for using Azure OpenAI Service effectively and responsibly. Here are some short links that can help you learn more about prompt engineering:
While Microsoft is hard at work bringing more generative AI to Business Central, we hope that these simple tips will get you started on your AI journey with Azure OpenAI. The product team is eager to hear your feedback on how we can support your use cases and help you design, build, and deliver AI solutions quickly and responsibly in the AI era: community partners are invited to join us at the Copilot and AI Innovation group on our Yammer partner community network. And if you’re looking for inspiration on how to enrich your features with generative AI, check out our 30 minute video where we present the details around our first generative AI feature in Business Central: Marketing Text Suggestions.
This article is contributed. See the original author and article here.
Microsoft is delighted to announce that the new Dynamics 365 Community is now live, marking a significant milestone in our journey of empowering users, fostering collaboration, and driving innovation.
With its fresh new look, streamlined experience, and a suite of powerful features, the new Dynamics 365 Community sets a new standard for user engagement and knowledge sharing. We have listened to your feedback, studied your needs, and made significant enhancements to ensure a seamless and immersive experience. Our aim is to create a platform that not only meets your present requirements but also inspires you to explore new possibilities and accelerate your success.
Here are the highlights of some of the new and future features of our new community:
Enhanced User Experience: Navigate through the community effortlessly and find the answers you need quickly. With intuitive search functionality, personalized recommendations, and a modern interface, your journey within the community has never been smoother.
Achievements Elements: Get ready for a fun and rewarding experience! Engage in community activities, earn badges, and unlock new levels as you contribute and grow. We believe that recognizing your valuable contributions is vital to building a thriving community.
AI-Powered Assistance: Our AI-assisted moderation ensures a safe and inclusive environment for all community members. By leveraging intelligent algorithms, we can maintain the quality and relevance of discussions while fostering a sense of belonging and respect.
This is just the beginning of an incredible journey! We are committed to continuous improvement and will be rolling out regular updates and new features to address your evolving needs. Your feedback and suggestions are invaluable to us, and we encourage you to share your thoughts to help shape the future of the Dynamics 365 Community.
As we embark on this exciting chapter together, we are excited to see the positive impact that this community will have on your professional growth, collaboration, and innovation. The Dynamics 365 Community is more than just a platform; it’s a catalyst for driving positive change in the world of business applications.
Microsoft would like to express our sincere gratitude to our incredible community members, MVPs, and User Group leaders who have played an instrumental role in shaping the Dynamics 365 Community. Your passion, expertise, and dedication continue to inspire us as we strive to create an inclusive and thriving ecosystem.
Thank you for being a part of this remarkable community. We invite you to explore the new Dynamics 365 Community at http://community.dynamics.com/ and embark on a journey of learning, collaboration, and success. Together, let’s unleash the full potential of Dynamics 365 and shape the future of business applications.
This article is contributed. See the original author and article here.
Before we start, please not that if you want to see a table of contents for all the sections of this blog and their various Purview topics, you can locate the in the following link:
This document is not meant to replace any official documentation, including those found at docs.microsoft.com. Those documents are continually updated and maintained by Microsoft Corporation. If there is a discrepancy between this document and what you find in the Compliance User Interface (UI) or inside of a reference in docs.microsoft.com, you should always defer to that official documentation and contact your Microsoft Account team as needed. Links to the docs.microsoft.com data will be referenced both in the document steps as well as in the appendix.
All of the following steps should be done with test data, and where possible, testing should be performed in a test environment. Testing should never be performed against production data.
Target Audience
The Information Protection section of this blog series is aimed at Security and Compliance officers who need to properly label data, encrypt it where needed.
Document Scope
This document is meant to guide an administrator who is “net new” to Microsoft E5 Compliance through.
We will be covering the recommendation of labels for new files and emails based on the Sensitive Information Type within those files and emails.
It is presumed that you already have a Sensitive Information Type that you want to use in your Information Protection policy. For the purposes of this document, I will be using a previously created Data Classification called “Recommended_Label_Contoso_medicine”. The keyword I am tracking within that data classifier is “Contoso_medicine”. I am doing this to avoid labeling any files by accident by using an out-of-the-box classifier. For information on how you create your own data classifier, refer back to “Part 1 – Sensitivity Information Types” of this blog series.
This document is only meant to be an introduction to the topic of multiple Sensitivity labels. Always refer back to official Microsoft documentation or your Microsoft account team for the latest information.
Out-of-Scope
This document does not cover any other aspect of Microsoft E5 Purview, including:
Data Classification
Data Protection Loss (DLP) for Exchange, OneDrive, Devices
Data Lifecycle Management (retention and disposal)
Records Management (retention and disposal)
eDiscovery
Insider Risk Management (IRM)
Priva
Advanced Audit
Microsoft Cloud App Security (MCAS)
Information Barriers
Communications Compliance
Licensing
It is presumed that you have a pre-existing of understanding of what Microsoft E5 Compliance does and how to navigate the User Interface (UI).
For details on licensing (ie. which components and functions of Purview are in E3 vs E5) you will need to contact your Microsoft Security Specialist, Account Manager, or certified partner.
We will not be covering the auto-labeling of data at rest. That will be covered in another blog post and those auto-labeling policies should not be done until after you have locked down your Sensitivity labeling of all “net new” data.
Overview of Document
Create a recommended Sensitivity Label
Create a recommended Sensitivity labeling policy
Verify that the user is prompted to apply the specific Sensitivity Label to a new file
Verify that the user is prompted to apply the specific Sensitivity Label to a new email
Use Case
The prompting of users to apply a Sensitivity Label when sensitive data is detected within a new file or email.
Definitions
Sensitivity Label – a metadata tag
Publish Label – making the metadata tag available to your tenant
Policy – The monitoring and applying of Sensitivity labels through the Microsoft tenant
Notes
Types of labels:
Automatic labels are applied to data at rest in Exchange mailboxes, SharePoint/Teams sites and users’ OneDrives.
Default labels are applied to data upon creation (and based on what is in the file/email).
Recommended labels do not label data, but appear when a specific piece of Sensitive Information Type (ex. Contoso_Medicine) are added to a file/email. It is up to the user to apply or not apply the recommended label.
Pre-requisites
You have read Parts 0, 1 and 2 of this blog series
You have a Sensitive Information Type (SIT) that will be tied to this automatic label.
Part 1 – Create a Recommended Sensitivity label
We will first set up our recommended label.
Give the label a name and description (and color marker, if you wish). Then click Next.
For the Scope, select Items and be sure that Files and Emails are selected. Then click Next.
Under the Items section of the wizard, select Apply or remove encryption and Apply content marking, then click Next.
We now arrive at Encryption. Click Configure encryption settings.
Assign Permissions now or let users decide? and chose Let users assign permissions when they apply the label.
For the purpose of this blog, under In Outlook, enforce one of the following restrictions -> Do Not Forward.
We want this label to be applied to MS Office related workloads. So, select In Word, Powerpoint, and Excel, prompt users to specify permissions.
Click for Apply content watermarking, I like to use the header option as it is the easiest because it is at the top of each electronic page. I will be using this watermark – “Contoso Medicine (Blog Recommended Label)”.
Next, we will Enable auto-labeling for files and emails.
At the top of this page, for the Content contains, we will select the SIT that we created previously. In my case, I am using the “Recommended_Label_Contoso_medicine”. The keyword I am tracking within that data classifier is “Contoso_medicine”.
At the bottom of this page, for the When content matches these conditions select Recommend that the users apply the label.
Note – this is the proverbial switch that needs to be flipped for a label to enable Recommend vs. Automatic vs Default labels.
We also want to provide an explanation in Word, Excel, etc. for the users. So in the field Display this message to users when the label is applied, type the message you want your user to see when the label is recommended. Then click Next.
On the protection settings for Groups and Sites, we will not be enabling anything as they are not applicable for this label and policy. Accept the defaults and click Next.
On the schematized data assets, we will leave this at the default of Off. Click Next.
Review your label and click Create Label.
Accept the defaults and then click Done and then Create Policy and then Close.
You are now ready to publish your policy.
Part 2 – Publish your Recommended Sensitivity label
We will now publish your label to your tenant.
On the left click on Information protection -> Label policies.
Click Publish label to start the publication wizard.
On the first step of the wizard, click Choose sensitivity labels to publish.
Select your recommended above label and click Add.
Note – you can publish (or republish) 1, many or all your labels in a Publish label wizard.
Click Next.
In the next step of the wizard, you can assign a specific administrative team to manage this policy. We will not be doing that in this blog. Click Next.
Next, you can decide who will see the published label. I will be using the default of all Users and groups, but I recommend you only use your own test user accounts here to limit the who will be seeing this label.
Under Policy Settings, you can leave all of these boxes blank. I will leave the first 3 boxes blankc and enter a URL into the last box (Provide users with a link to a customer help page). When you are ready, click Next.
On Default settings for documents, we will not be selecting any Default labels. Accept the default and click Next.
On Default settings for emails, leave things as the default of Same as docuemtn. Click Next.
On Default settings for meetings and calendar events, leave things as the default of None. Click Next.
On Default settings for Power BI content, leave things as the default of None. Click Next.
Now give your policy a name and description and click Next.
Tk Review your settings. When you are satisfied, click Submit and Done.
You are not ready to start the testing phase of this blog.
Note – it can take 24-48 hours for labels and policies to replicated within a tenant.
Part 3 – Test Recommended label on new file
Before we start our file and email tests, remember that labels and policies can take a while to replicate throughout your tenant. One hour is usually a good amount of time to wait, but it might be quicker or slow to populate based on several variables in your tenant we will not cover at this time.
Open Word, Excel or PowerPoint
Create a New File.
Type in the Sensitive Information Type that you have associated with your recommended Sensitivity label. I am using the compound word “contoso_medicine”.
When you do, you will see a Policy Tip bar appear at the top of your document. Here is an example.
Here is a magnification of the left side above.
Here is a magnification of the left side above.
This is the end of the file testing.
Part 4 – Test Recommended label on new email
We will now test this recommended label against a newly created email.
Open Outlook.
Create a New Email.
Type in the Sensitive Information Type that you have associated with your recommended Sensitivity label. I am using the compound word “contoso_medicine”.
When you do, you will see a Policy Tip bar appear at the top of your document. Here is an example.
Note: This solution is a sample and may be used with Microsoft Compliance tools for dissemination of reference information only. This solution is not intended or made available for use as a replacement for professional and individualized technical advice from Microsoft or a Microsoft certified partner when it comes to the implementation of a compliance and/or advanced eDiscovery solution and no license or right is granted by Microsoft to use this solution for such purposes. This solution is not designed or intended to be a substitute for professional technical advice from Microsoft or a Microsoft certified partner when it comes to the design or implementation of a compliance and/or advanced eDiscovery solution and should not be used as such. Customer bears the sole risk and responsibility for any use. Microsoft does not warrant that the solution or any materials provided in connection therewith will be sufficient for any business purposes or meet the business requirements of any person or organization.
This article is contributed. See the original author and article here.
Over the past few months, Microsoft Learn has published a series of blogs showcasing the latest trends in the tech industry and the increasing demand for tech skills. This series has highlighted in-depth LinkedIn data showing that preparing talent for an ever-changing job market is more important than ever. Despite recent layoffs at tech companies, the demand for technical skills in the modern workplace has never been greater; LinkedIn data has shown that the need for tech talent is flourishing in non-tech industries such as education, healthcare, finance, and government proving that not just tech companies are looking for people with technology skills.
Helping students become work-ready is top of mind for educators and institutions, as it is essential that students not only build technical skills and expertise, but also then connect with employers looking for these critical skills. Higher education institutions are looking for new ways to prepare their students, especially now that more employers are engaging in skills-based hiring and looking beyond just those people who have formal 4-year degrees. More of these institutions see the value in partnering with Microsoft to help their students learn valuable tech skills and earn industry-recognized certifications, and many are turning to the resources and training found through Microsoft Learn.
Recently, Times Higher Education, a British magazine reporting specifically on news and issues related to higher education, published an article discussing these trends and how, as the market for technical skills continues to evolve and grow, employers need a sustainable stream of talent to realize their ambitions. Many are experiencing a digital skills gap, where they are lacking access to professionals with the right experience and qualifications in current and emerging technologies. The article profiles three universities who have partnered with Microsoft to help students make career connections with employers and unlock opportunities for new talent to gain digital credentials and begin a rewarding career in tech.
Bridging the gap: helping students to be work-ready
The universities highlighted in the article are preparing students for the current tech employment landscape with the support of Microsoft programs including Microsoft Learn for Educators (MSLE), which provides higher education institutions and educators with a suite of comprehensive tools and resources to augment students’ existing degree paths with industry-recognized certifications. More educators are seeing the value of students acquiring these certifications in today’s job market, while MSLE gives them access to ready-made, instructor-led curriculum that can put students on a path to a variety of technical careers, as educators can work with students on certifications in their specialist fields. Students are increasingly more interested in pursuing these credentials because of growing awareness that employers value these industry certifications in addition to college degrees, as this combination gives students an advantage as they begin applying for jobs.
Further, students can also turn to Microsoft as they begin their careers in tech, gaining skills and connecting with employers with the help of Microsoft Learn Career Connected which pairs the tools and resources of Microsoft Learn with the power of LinkedIn. Microsoft Learn Career Connected has shown to be particularly useful for those students who don’t necessarily know their desired career path, as they can get recommended suggestions for learning paths that make sense based on their interests or the courses they are currently taking. Students can interact with a community of other learners and get their perspectives and support, share their experiences, and connect with employers who are looking for specific tech skills. MSLE offers pre-curated short courses in key skills areas and supports educators to further deliver learning that students can use once they enter the world of work.
There are several success stories from universities who have offered their students access to a range of complementary Microsoft credentials through MSLE and Microsoft Learn Career Connected. One of the examples cited in the article includes the real-world implications that the pandemic had on the hard-hit hospitality industry on the Hawaiian Islands. Debasis Bhattacharya, Associate Professor at Maui College at the University of Hawaii, teaches Applied Business and Information Technology and uses MSLE to support his students in gaining digital certifications that will make them stand out to employers.Maui College is already seeing results from using the teaching and learning content and resources available as part of MSLE. As more students gain certifications, the college has seen an uptick in employers approaching students before they graduate. “They are getting more internships that should lead to more full-time roles once they graduate,” Bhattacharya says.
MSLE is also being used with continuing education programs in Canada. The University of Calgary was the first institution in Canada to become an education global training partner with Microsoft. Valuable support has come from MSLE in terms of curriculum planning, according to Vui Kien Liau, Associate Director of Technology Programs for continuing education at Calgary. “Students could just access courses on the internet, but they get value out of the experience of sharing and interacting with instructors,” he says. “The MSLE program helps us to build a curriculum that appeals to all learners.” The university has already trained more than 13,000 students in Microsoft Azure Cloud.
Lastly, although Eastern Washington University (EWU) is in the early stages of using MSLE to support its teaching, many students have already successfully achieved certifications which will afford them an advantage in the labor market according to Alexandros Paparas, Assistant Professor at EWU. “Businesses often come to us looking for potential recruits, so the students all find jobs before they graduate.” While students often build early links with employers and apply directly for roles, Microsoft Learn Career Connected and its dedicated LinkedIn group have also been useful for students in terms of networking, showcasing their credentials, and honing their job applications.
Making career connections: how Microsoft opens doors for new talent
The article goes on to highlight in more detail how Microsoft Learn Career Connected can help students connect with employers looking for technical skillsets. Many find that gaining digital credentials can be the first step towards a rewarding career in tech, and then Microsoft Learn Career Connected can help link students with a range of opportunities with employers.
For example, Avanade, a global professional services company providing IT consulting and services focused on the Microsoft platform, has a long history with Microsoft and is part of Microsoft Learn Career Connected, offering students help with training, employee placement, and assistance finding a job.
Another organization showcased is TechFluent—a non-profit organization supported by volunteers in the technology industry that aims to provide mentorship and training on Microsoft’s Dynamics 365 and the Power Platform—that also connects participants to available jobs within the tech industry.
Preparing the next generation with MSLE, Microsoft Learn Career Connected, and Microsoft Certifications
Now more than ever we are seeing that all jobs truly are tech jobs and that tech skills are in-demand across so many industries. When it comes to employment, we are seeing the value that industry-recognized certifications provide for students beyond formal and traditional degrees. More higher education institutions are turning to Microsoft programs like MSLE to help them prepare students for an evolving job market and to build the technical skills they need to meet growing demand. And it doesn’t stop there—once students have the skills, they can turn to Microsoft Learn Career Connected as they begin their career— connecting with employers and new job opportunities. Programs like Microsoft Learn for Educators and Microsoft Learn Career Connected, as well as training and certifications, are here to help prepare students as they begin their career and can offer continued support throughout their learning journey.


Recent Comments