by Contributed | Jul 20, 2023 | Technology
This article is contributed. See the original author and article here.
There are several actions government IT admins can take to increase their organizational security resilience and continue to deliver the citizen services, including: building the right team to assess your current security environment and utilizing a comprehensive security portfolio to maximize protection and reduce data exposure.
The Microsoft Teams Product Group is excited to introduce Teams Premium for Government Community Cloud (GCC). On Wednesday, July 19th 10:00 AM PST |1 PM EST, Teams engineers will walk you through the details of the new Teams Premium SKU.
Microsoft To Do is a task management tool that helps you stay productive, manage your day, and collaborate with your colleagues. We are pleased to announce that it’s now available for use by customers in GCC High and DoD tenants via the web app, as well as integration in Outlook on the web. Other platforms (desktop, mobile) are not available yet in GCC High and DoD.
We’re excited to announce that customers using US Government Community Cloud (GCC) environment and Microsoft Azure can now purchase Windows 365 Enterprise and deploy their Cloud PCs in Microsoft Azure commercial regions.
Join Jay Leask and other members of the Government Community live on LinkedIn!
Customers in our Office 365 government clouds, GCC, GCCH, and DoD, are continuing to evolve how they do business in the hybrid workplace. As Microsoft Teams is the primary tool for communication and collaboration, customers are looking to improve productivity by integrating their business processes directly into Microsoft Teams via third-party party (3P) applications or line-of-business (LOB)/homegrown application integrations.
Empowering US public sector organizations to transition to Microsoft 365
We have a great line-up of new features to announce.
Exchange Online
Teams
Purview
Microsoft 365
References and Information Resources
|
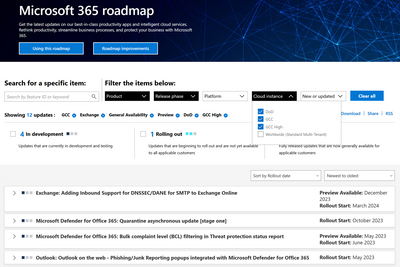
Microsoft 365 Public Roadmap
This link is filtered to show GCC, GCC High and DOD specific items. For more general information uncheck these boxes under “Cloud Instance”.
Stay on top of Microsoft 365 changes
Here are a few ways that you can stay on top of the Office 365 updates in your organization.
Microsoft Tech Community for Public Sector
Your community for discussion surrounding the public sector, local and state governments.
Microsoft 365 for US Government Service Descriptions
· Office 365 Platform (GCC, GCCH, DoD)
· Office 365 U.S. Government GCC High endpoints
· Office 365 U.S. Government DoD endpoints
· Microsoft Purview (GCC, GCCH, DoD)
· Enterprise Mobility & Security (GCC, GCCH, DoD)
· Microsoft Defender for Endpoint (GCC, GCCH, DoD)
· Microsoft Defender for Cloud Apps Security (GCC, GCCH, DoD)
· Microsoft Defender for Identity Security (GCC, GCCH, DoD)
· Azure Information Protection Premium
· Exchange Online (GCC, GCCH, DoD)
· SharePoint (GCC, GCCH, DoD)
· OneDrive (GCC, GCCH, DoD)
· Teams (GCC, GCCH, DoD)
· Office 365 Government (GCC, GCCH, DoD)
· Power Apps (GCC, GCCH, DoD)
· Power Automate US Government (GCC, GCCH, DoD)
· Power BI (GCC, GCCH, DoD)
· Planner (GCC, GCCH, DoD)
· Outlook Mobile (GCC, GCCH, DoD)
· Viva Insights (GCC)
· Dynamics 365 US Government

Public Sector Center of Expertise
We bring together thought leadership and research relating to digital transformation and innovation in the public sector. We highlight the stories of public servants around the globe, while fostering a community of decision makers. Join us as we discover and share the learnings and achievements of public sector communities.
|

|
Microsoft Teams for US Government Adoption Guide
|

|
 |
Message Center Posts and Updates for Microsoft Teams in GCC
|
Looking for what’s on the map for Microsoft Teams and only Teams in GCC?
Go right to the GCC Teams Feature Communications Guide
Message Center Highlights
|
SharePoint Online
MC616550 — InfoPath 2013 client and InfoPath Forms Services in SharePoint Online will reach end of support in July 2026

>365 Days
Industry trends and feedback from our customers and partners make it clear that today’s businesses demand an intelligent, integrated forms experience that spans devices which InfoPath does not provide. As announced earlier, InfoPath Client 2013 will reach the end of its extended support period on July 14, 2026 (link), and to keep an aligned experience across Microsoft products, InfoPath Forms Service will be retired from SharePoint Online. We’re sending this message to bring it to your early attention to minimize the potential impact on your organization.
Key Points:
- Major: Retirement
- Timeline: Starting from July 14, 2026, Microsoft will remove InfoPath Forms Services for existing tenants.
- Action: Review and assess impact
How this will affect your organization:
After July 14, 2026, users will no longer be able to use InfoPath forms in SharePoint Online.
What you need to do to prepare:
To understand how InfoPath is used in your organization, you can run the Microsoft 365 Assessment tool to scan the tenant for InfoPath usage. Using the Power BI InfoPath Report generated by the scanner tool, you can:
- Identify all InfoPath Forms usage in the tenant, per site collection and site.
- Evaluate the recency and volume of usage of InfoPath Forms.
- Understand lists, libraries and content types that use InfoPath.
We recommend communicating to the impacted site owners/teams inside your organization now, so they are aware of the coming change.
For scenarios where InfoPath or InfoPath Forms services are currently being used, we recommend migrating to Power Apps, Power Automate or Forms. Please ensure that you allow adequate time for migration of any use of InfoPath/InfoPath Forms Services in your organization ahead of this date, as there is no migration tool provided. Additional instructions on how to migrate can be found in this blog.
Please plan appropriately as there will not be an option to extend InfoPath Form Services beyond the InfoPath retirement date of July 14, 2026.
MC602601 — We’re making changes to promoted results in Microsoft Search

30-60 Days
In order to improve the Microsoft Search experience, promoted results will no longer be supported in Microsoft Search for Organization level scoped searches and will be replaced by the Bookmarks and Q&A features. This aligns with similar retirement for general clouds in October 2021.
Note: Promoted results will continue to be supported for hub and site level scoped searches in Microsoft search and the deprecation will not affect any classic search experiences or SharePoint Search API based experiences.
When this will happen:
We will roll out this change beginning in early August and expect to complete by mid-August.
How this will affect your organization:
Promoted results will no longer trigger in Microsoft Search for SharePoint Home or office.com when this change is implemented.
What you need to do to prepare:
Microsoft Search provides an alternative to promoted results using either Bookmark or Q&A answers.
If your organization set up Promoted Results in SharePoint, you can import the Promoted Results into Microsoft Search and make the imported content available to your users. This is an easy way to quickly populate search results as soon as you set up Microsoft Search and make it more effective for your users. We recommend using promoted results from SharePoint as a reference to understand how to name and create relevant search results.
Microsoft Search allows a search administrator to import promoted results as Bookmarks. See Manage bookmarks for more information.
MC600726 — Microsoft Lists User Experience Update

<30 Days
Microsoft 365 Roadmap ID 124867
This update improves the overall performance of Microsoft Lists and introduces new features, including the ability to add ratings to any list, drag and/or paste images directly into a list, see who is collaborating with you in real-time, switch views by clicking tabs, and more.
When this will happen:
Targeted Release: We will begin rollout in mid-July and expect to complete rollout by late July.
Standard Release: We will begin rollout in late July and expect to complete rollout by late September.
How this will affect your organization:
Users in affected tenants will see Lists feature updates as described in this blog post. These improvements will reach all Lists, except those that have been configured with the following features:
- SharePoint Framework extensions
- PowerApps forms
- Approvals
- The Playlist template
Lists that are using these features will not receive the new user experience with this feature rollout. Future rollouts will bring support for Lists that are using these features.
Lists with the new experience will always open inside the Lists app, whether those lists are opened from Lists Home, a sharing link, a direct link, or a link in SharePoint navigation. This means SharePoint site elements like the header and left navigation will not be shown on initial load. There are two ways to show these site elements in a List:
- Users can click the “Open in Site” button in the upper right corner of the list. This causes the List to reload inside the parent SharePoint site with those site elements visible on the page.
- Admins can set a property on a site collection to make all lists in that site collection always load with the site elements intact. This property is called ListsShowHeaderAndNavigation. This an example PowerShell cmdlet that will set this property for a site given its URL: Set-SPOSite -Identity https://contoso.sharepoint.com/sites/site1 -ListsShowHeaderAndNavigation $true
When this change rolls out, there is one workaround to be aware of. Gallery views that have a Group By specified will be displayed in list mode. This is because of an issue where gallery views and group by are mutually exclusive. To get gallery mode back inside this view, remove the Group By. This issue will be resolved in August and you will no longer need this workaround to see gallery cards properly.
What you need to do to prepare:
You don’t need to do anything to prepare for this change.
The ListsShowHeaderAndNavigation setting is currently available if you wish to proactively set this setting to prepare for this rollout. Doing so will mean that lists inside those sites will always be shown with SharePoint site elements like the header and left navigation.
MC590117 — IPv6 by default for SharePoint Online – GCCH

30-60 Days
SharePoint Online will begin enabling IPv6 by default for all SharePoint tenant URLs endpoints. The scope of this change includes all URLs under *.sharepoint.us including .sharepoint.us and -my.sharepoint.us.
When this will happen:
Changes will begin to roll out beginning of July and be completed by the beginning of August.
How this will affect your organization:
When the change is complete SharePoint will begin advertising both AAAA and A DNS records allowing clients to connect either via IPv4 or IPv6. This dual-stack configuration is expected to be transparent with many Office 365 products already configured as such.
What you need to do to prepare:
This is for your information.
For additional information please visit IPv6 support in Microsoft 365 service
MC588324 — Microsoft Lists: Custom List Template Updates

30-60 Days
The Custom List Templates feature will give organizations the ability to create their own custom list templates with custom formatting and schema. It will also empower organizations to create repeatable solutions within the same Microsoft Lists infrastructure (including list creation in SharePoint, Teams, and within the Lists app itself).
We have made some updates to the feature we are releasing:
- We have updated the extraction cmdlet, Get-SPOSiteScriptFromList to now generate list scripts with bindings.
- In the CreateSPList action you will see key-value pairs, with the tokens and identity, where identity is a unique string to identify the CreateSPList action.
- UI updates to the list creation dialog for the end-user
When this will happen:
Rollout will begin in mid-June 2023 and is expected to be complete by late August 2023.
How this will affect your organization:
End-user impact: Visual updates to the list creation dialog and the addition of a From your organization tab when creating a new list. This new tab is where your custom list templates appear alongside the ready-made templates from Microsoft.

Admin impact: Custom list templates can only be uploaded by a SharePoint administrator for Microsoft 365 by using PowerShell cmdlets. For consistency, the process of defining and uploading custom list templates is like the custom site templates experience and will reuse some of the existing sites related PowerShell APIs.
To define and upload custom list templates, admins will use the following site template PowerShell cmdlets:
- Use the Get-SPOSiteScriptFromList cmdlet to extract the site script from any list
- Run Add-SPOSiteScript and Add-SPOListDesign to add the custom list template to your organization.
- Scope who sees the template by using Grant-SPOSiteDesignRights (Optional).
What you need to do to prepare:
If you are already using the feature in First Release, please re-extract the list script using Get-SPOSiteScriptFromList to get the latest version. Next, update the existing custom list template by using Set-SPOSiteScript.
For all other customers, the visual updates for this feature will be seen by end-users in the updated user interface (UI) when creating a list.

Note: The From your organization tab will be empty until your organization defines and publishes custom list templates.
PowerShell Cmdlets documentation for custom list templates is available here. Public facing documentation for creating custom list templates can be found here.
MC564196 — (Updated) Microsoft Stream: Playlist View in SharePoint List Webpart

<30 Days
Microsoft 365 Roadmap ID 124808
Updated June 20, 2023: We have updated the rollout timeline below. Thank you for your patience.
Users can soon select a playlist to be displayed in the list webpart in the full-blown playlist view along with video playback.
When this will happen:
Standard Release: We will begin rolling out in early June 2023 and expect to complete rollout by late July 2023 (previously late June).
How this will affect your organization:
- Users will be able to select a playlist from the list picker while configuring the list webpart.
- Users will be able to see the full-blown playlist view as the default view for playlists.

What you need to do to prepare:
There is no action required at this time, this change will be enabled automatically.
MC540126 — (Updated) Applied Filters in Microsoft Lists

Rolled Out
Microsoft 365 Roadmap ID 117585
Updated June 7, 2023: We have updated the rollout timeline below. Thank you for your patience.
Microsoft Lists is rolling out a new way to visualize and clear the filters that are present in a view.
When this will happen:
Targeted Release: Rollout will begin in late April and is expected to be complete by early May.
Standard Release: Rollout will begin in early May and is expected to be complete by late June (previously late May).
How this will affect your organization:
As you add and adjust filters to narrow or expand what appears in a view inside a list, you will see which filters have been applied and you can remove them without having to go back into the column filter pane.

What you need to do to prepare:
You don’t have to do anything to prepare for this change.
MC525663 — (Updated) SPO Site Sharing will now use Azure B2B Invitation Manager

<30 Days
Microsoft 365 Roadmap ID 117557
Updated June 30, 2023: We have updated the rollout timeline below. Thank you for your patience.
We are updating the SharePoint Online Site Sharing backend to use Azure B2B Invitation Manager instead of the legacy SharePoint Invitation Manager.
When this will happen:
This change will begin rolling out in late March, and complete rollout by late July (previously late June).
How this will affect your organization:
Today, sharing just the SharePoint site goes through the original SharePoint Invitation Manager which always creates guest users in your organization’s directory. We are now updating this flow & experience to use the Azure B2B Invitation Manager instead. The sharing flow will remain identical to what users see today, but external recipients will now go through your organization’s B2B Invitation Manager experience.
Note: This change will only impact sharing of sites. Users who share files or folders will continue to receive the same experience they have today.
What you need to do to prepare:
You may want to review your Azure B2B Invitation Manager policies.
OneDrive for Business
MC597037 — (Updated) New UI to view OneDrive files excluded from Sync

<30 Days
Microsoft 365 Roadmap ID 124868
Updated June 27, 2023: We have updated the rollout timeline below. Thank you for your patience.
Introducing a UI in OneDrive Sync Advanced Setting to allow users to view the admin configuration of files to be excluded (ignored) from Sync.
When this will happen:
Standard Release: We have started rolling out and expected to complete by mid-July (previously mid-June).
How this will affect your organization:
Commercial tenants will not have any changes to their experience. The commercial users will now be able to see the Sync Excluded files in their OneDrive Settings.
What you need to do to prepare:
No prep is needed.
MC559933 — (Updated) OneDrive: Restore files to original location when turning off folder backup

<30 Days
Updated June 27, 2023: We have updated the rollout timeline below. Thank you for your patience.
OneDrive: Restore files to original location when turning off folder backup.
This feature provides new functionality for users who turn off folder backup (also known as “PC folder backup” and “known folder move”). When users turn off folder backup, they will have the option to restore the files back to their original location. Note: when a folder contains files stored only in the cloud, those files will not be moved; they will remain in the cloud
When this will happen:
Standard Release: This is currently rolling out and will complete rolling out in mid-July (previously late June).
Note: Some users may see this feature before others in your organization.
What you need to do to prepare:
There is no action needed to prepare for this change. You may want to notify your users about this change and update any relevant documentation as appropriate.
MC545906 — (Updated) SharedWith and SharedWithDetails column in OneDrive and SharePoint will no longer be updated

TBD
Updated June 30, 2023: We are not proceeding with this change at this time. We will communicate via Message center when we are ready to proceed. Thank you for your patience.
We will be retiring the SharedWith and SharedWithDetails columns from OneDrive and SharePoint starting in early June. These columns have been hidden by default in OneDrive and SharePoint for several years and were replaced by the Manage Access experience and the “Shared With” section of the Share dialog.
When this will happen:
We will communicate via Message center when we are ready to proceed.
How this will affect your organization:
As described in this documentation, the SharedWith and SharedWithDetails column do not accurately reflect the permissions and people who have access to an item. As such, the column has been hidden by default in OneDrive and SharePoint for 3+ years. With this change, we will no longer update the SharedWith fields during sharing operations. The data within the column will move to being considered customer content and will not be updated or changed by Microsoft. In a future update, we will stop provisioning this column entirely.
Most users already use Manage Access and the Sharing Dialog to manage and understand who has access to their content and these experiences are not impacted by this change. We are continuing to develop and improve the Manage Access experience to make understanding permissions easy and simple for users.
What you need to do to prepare:
If you use the SharedWith or SharedWithDetails columns, we recommend using the Manage Access experience to understand which users have permission to an item.
Please click Additional Information to learn more.
See who a file is shared with in OneDrive or SharePoint
MC529434 — (Updated) Microsoft Syntex: Split PDF Pages into new PDF files with the Extract action in OneDrive for iOS

Rolled Out
Microsoft 365 Roadmap ID 117548
Updated June 7, 2023: We have updated the rollout timeline below. Thank you for your patience.
Users of Microsoft Syntex can soon split a PDF file into multiple PDFs with the Extract file action in OneDrive for iOS. The Extract file action lets you quickly split and extract multiple pages of a PDF into a new PDF file stored in SharePoint or OneDrive.
When this will happen:
We will begin rolling out in late April and expect to complete rollout by mid-June (previously late May).
How this will affect your organization:
Syntex users won’t have to worry about sharing unnecessary information from a large PDF file. Splitting a large PDF file into multiple, smaller files lets users tailor the information they want to view or share with others.
To split a PDF file in Syntex using the Extract action:
- Open the PDF file you want to split in OneDrive for iOS.
- At the bottom of the screen, tap the horizontal bar or drag the bottom menu up to expand the new menu.
- Under File actions, select Extract.
- Choose the page(s) you want to separate and tap Extract.
- Select a location to save the extracted PDF.
- After the new PDF is done processing, a Your PDF is ready banner will appear at the bottom of the screen. Tap Open from the banner to access your new file.
Note: Some users may see this feature before others within your organization. PDF extraction is available only for Microsoft Syntex licensed users; users without a Syntex license will not see the feature. We will bring the capability to other clients, including OneDrive, SharePoint and Syntex browsers soon.
What you need to do to prepare:
There is nothing you need to do to prepare for this feature. You may want to notify your users about this new capability and update your training and documentation as appropriate.
Power Platform
MC611565 — The Modern Security Role Editor User Interface is now available

Rolled Out
We are pleased to announce that the Modern Security Role Editor User Interface is now available for the Power Platform admin center (PPAC). The rollout has started and will be fully completed by June 30, 2023.
How will this affect me?
The new Modern Security Role Editor is only available to PPAC administrators and will include the same functionality as the classic interface that was used to support Dynamics 365 Apps. In addition to carrying over the functionality of the classic interface, the Modern User Interface provides an additional set of rich features that will enhance an Administrator’s governance experience in PPAC.
Where can I learn more?
For more information on the Modern Security Role Editor User Interface and its capabilities, click here.
MC589752 — Action Required: Allow list Azure Front Door service tags

Rolled Out
We are updating the recommendation for controlling access to Power Platform URLs and IP address ranges. Our current guidance is to configure your allow-lists using the “AzureCloud” service tag in the Azure IP Ranges and Service Tags JSON files. If you have created a customized implementation of allow-list entries, you will need to update your allow-list to avoid disruption of service.
New Service Tag:
When this will happen:
We will begin using the IP address ranges included in the new Service Tag starting June 16th, 2023 and rolling it out globally according to our safe deployment process.
This change is applicable to all customers in the Public and Government cloud offerings.
What action do I need to take?
Please update your allow-lists to include either the AzureCloud service tag, or add the AzureFrontDoor.Frontend service tag to existing rule sets to prevent potential disruption of service.
If you require further assistance, please contact Microsoft Support.
MC584218 — Manage email notifications to admins

Rolled Out
Direct email notifications are sent to users who are assigned a pre-configured administrator role in an impacted Dynamics 365 or Power Platform environment, or Microsoft Dynamics 365 Lifecycle Services (LCS) project or environment.
To ensure that the administrators receive email notifications in alignment with our existing notification policy, please ensure that the correct roles are assigned, or additional email addresses have been added to the “Additional Notification” list via PowerShell.
What actions do I need to take?
Please review the “Manage email notifications to admins” article and ensure your admins and additional users are assigned the appropriate roles.
If you want additional recipients who are not System administrators in Dataverse or assigned administrator roles in LCS to receive direct email communications, please see use the PowerShell cmdlets to add those email addresses to the “Additional Notification” field of the environment.
Additional resources:
Service incident and change communications are primarily posted to the Microsoft 365 Service health dashboard and the Message center. More information about our service communications can be found here: Policies and Communications for Power Platform and Dynamics 365 Services.
MC579277 — AI Builder – “Create text with GPT” model (preview) is now available

Rolled Out
We are excited to introduce a new AI model in AI Builder: Create text with GPT. This model leverages generative AI, powered by Azure OpenAI Service, to help users create new text content, summarize existing text, extract information from text, and more. This model preview is now available in all environments hosted in the United States.
With this model, users:
- Have a prompt engineering to guide the model to perform various tasks, such as summarizing, creating text, classifying, translating, and more.
- Can embed the model in Power Automate flows to automate workflows with generative AI.
- Will be able to use PowerFx to embed and invoke the model within Power Apps.
Like all new AI Builder models, this model is automatically available in all environments within the tenant.
How do I disable “Create text with GPT?”
If you are still evaluating generative AI and want to disable this model, it can be done at environment or tenant level through the Power Platform admin center.
To disable the model at the environment level:
- Sign-in to the Power Platform admin center.
- Click on Environments in the left navigation pane.
- Select the desired environment and click on Settings.
- Select Product and Features, look for Copilot setting and click on the toggle to switch off the generative AI copilot features.
To disable the model at the tenant level:
- Sign-in to the Power Platform admin center.
- Click on Settings in the left navigation pane.
- Select Copilot setting and click on the toggle to switch off the generative AI copilot features in the right pane.
For more information about this model and how to use it, please visit the Azure Open AI in AI Builder documentation.
We hope this new capability enhances user experience, and we look forward to hearing feedback.
MC576046 — Power Automate – Immediate change to universal search

Rolled Out
Effective immediately, we are no longer supporting Microsoft Learn and Documentation search category results from Power Automate universal search bar by default.
How does this affect me?
Power Automate users who are accustomed to seeing search category results in Microsoft Learn and Documentation will no longer see those results if PowerPlatform.Search.disableDocsSearch is set to True.
What action do I need to take?
If you want to enable Microsoft Learn and Documentation search category results across the Power Platform, you will need to set PowerPlatform.Search.disableDocsSearch to False. You can find more information in this article: Manage search providers.
Please communicate as appropriate with your Power Automate users. If you have questions, please contact Microsoft Support.
Microsoft Viva
MC611679 — Microsoft Viva: Topic card expanded view shows more details about a topic

<30 Days
Microsoft 365 Roadmap ID 118590
We are rolling out the expanded view of the topic card for Viva Topics tenants that brings more information on the topic to users. Users can click on the topic name to view the expanded view of the card and learn more about the topic.
When this will happen:
Standard Release: We will begin rolling out early July and expect to complete by early July 2023.
How this will affect your organization:
No impact. Default feature that will be available to all Viva Topics licensed users.
What you need to do to prepare:
There is no action needed to prepare for this change.
MC590126 — Viva Insights Manager, Leader, and Advanced Insights Available for GCC

<30 Days
Microsoft 365 Roadmap ID 88843
Premium Viva Insights capabilities will soon be available for Government Community Cloud environments.
When this will happen:
Rollout will begin in early July and is expected to be complete by late July.
How this will affect your organization:
In addition to the personal insights and experiences available with a Microsoft 365 subscription, users with a Viva Insights license will also have access to premium personal features available through the Viva Insights app in Microsoft Teams and on the web. Premium personal features which include additional time management features, shared plans, schedule send in Teams, and more – further enable individuals to build better work habits and improve their effectiveness at work. More details here: Personal insights in Viva Insights.
Manager and leader insights are available through the Viva Insights app in Teams and on the web provide visibility into work patterns that can lead to burnout and erode productivity. The metrics presented to managers and leaders have built-in safeguards to protect the privacy of individuals, like de-identification, aggregation, and differential privacy. More details here: Team and Organization insights.
The advanced insights app is used for deep-dive analysis. Viva Insights analysts can use flexible, out-of-the-box report templates as well as advanced tools to generate custom insights tailored to specific business challenges. More details here: Introduction to advanced insights.
The following controls will be available to IT Admins to configure the roll out:
- Manager and leader insights and premium personal insights require a Viva Insights license for every user. Admins can assign Microsoft Viva Insights service plan to users or for specific groups in your organization to enable these enhanced experiences in Viva Insights app in Teams and on the web.
- For advanced insights, every individual included in the analyzed population must be licensed and assigned the Microsoft Viva Insights service plan. Admins can set up advanced insights using these instructions: Microsoft Viva Advanced Insights setup.
What you need to do to prepare:
Review and assess the impact for your organization. Consider updating documentation as appropriate.
MC533820 — (Updated) New Home Experience for Viva Connections desktop for GCC

>60 Days
Updated June 20, 2023: We have updated the rollout timeline below. Thank you for your patience.
A new desktop experience is being released for Viva Connections that’s easier and faster to set up and optimizes content to deliver a modern employee experience. The new Viva Connections desktop design serves as a new home experience option that centers essential job tasks, personalized content, easy access to other Viva experiences, and better aligns with the mobile experience. The New home experiences for Viva Connections desktop will begin rolling out to GCC tenants.
When this will happen:
Rollout to GCC tenants will begin in late September and is expected to be complete by late October.
How this will affect your organization:
For customers who are currently using Viva Connections, the new home experience will automatically update in Microsoft Teams. Customers with existing home sites can choose to keep the existing desktop experience using a new PowerShell command that will become available to all customers by mid-November. For more details, please visit the customization guidance documentation.
If you’ve already set up Viva Connections, existing content will pre-populate into the new home experience.
If you haven’t set up Viva Connections yet, the default experience includes starter cards on the Dashboard, but otherwise does not impact the current mobile experience.

What you need to do to prepare:
With the new desktop experience, admins and editors will be able to edit content and manage permissions from Microsoft Teams. To prepare for this change, admins and editors for Viva Connections can learn more about how to customize the new home experience and how permissions work by visiting this documentation.
End users in your organization will use the same entry point in Teams as the previous desktop experience. When they view the new experience for the first time, visual prompts will walk them through the main functions of the design and how to interact with different elements.
Microsoft Teams
MC611685 — Click Through Collaborative Annotations Layer in Teams Meetings

30-60 Days
Microsoft 365 Roadmap ID 127900
We are rolling out an enhancement to the current Collaborative Annotations experience whereby screen sharers can click through the annotations layer and interact with underlying content without stopping the existing annotation session. After a sharer initiates annotations from their presenter toolbar, sharers will be able to interact with their background to edit their content by default.
When this will happen:
Standard Release: We will begin rolling out late July and expect to complete by mid-August.
GCC-High and DoD: We will begin rolling out early August and expect to complete by mid-August.
How this will affect your organization:
Click through is available on desktop (Windows and Mac) and web. When users share their screen in Teams meetings and select Start annotation in the presenter toolbar, they will see a new button, Interact with background, in Microsoft Whiteboard toolset which allows them to interact with underlying content without stopping the existing annotation session.


What you need to do to prepare:
No preparation is needed. You may want to update your training materials indicating that the feature is now supported.
MC611680 — Make calls through speed dial and call history on Apple CarPlay

>60 Days
Microsoft 365 Roadmap ID 125556
Users can now easily call their speed dial contacts and get back to their recent calls on Apple CarPlay with Teams after connecting iPhone to vehicles that support Apple CarPlay.
When this will happen:
Production and GCC: We will begin rollout in mid-July and expect to complete rollout by early August.
GCC-High and DoD: We will begin rollout in early September and expect to complete by early October.
How this will affect your organization:
Users in your organization can now make calls to their speed dial contacts and get back to recent calls on Teams on Apple CarPlay with your iPhone.
After tapping the Teams icon and navigating to the Calls tab (which is next to Meetings tab), users can either choose to access speed dial contacts or call history.


What you need to do to prepare:
No specific action is required as this will be available to all Teams users and not gated by an admin policy.
MC609889 — Microsoft Teams Compact Chat List

>60 Days
Microsoft 365 Roadmap ID: 126428
Compact chat list is a feature addition that is coming to compact mode. Users in compact mode will now have hidden message previews in their chat list. This new design will enable users to keep messages more private, view more chats in their chat list and navigate the chat list more easily. This feature addition to the existing compact mode will be rolling out across Microsoft Teams Desktop and Web and will provide a condensed view of the chat list for compact mode users.
When this will happen:
Standard Release: We will begin rolling out to commercial tenants in early June and expect to complete rollout by late June.
GCC: We will begin rolling out in July.
GCCH: We will begin rolling out in August.
DoD: We will begin rolling out in September.
This feature addition will be available in the new Teams desktop experience later this calendar year.
How this will affect your organization:
Users can access this feature addition by switching to compact mode. To do so, users must navigate to Settings and go to the “Chat density” section under the “General” tab. From there, users can select “Compact”.
Upon exiting Settings, users will see a more condensed view of messages in their message pane (existing feature) as well as a compacted chat list (feature addition). The compacted chat list includes hidden message previews and allows the user to see more chats on their screen at a given time.


What you need to do to prepare:
You may want to notify your users about this new design/feature addition in compact mode. Users can switch to compact mode in the Settings menu under the General tab in T1.
MC604885 — Teams admin center: Simplified App Pre-Install Experience

<30 Days
We are excited to announce a new feature designed to improve the app pre-installation experience in the Teams Admin Center.
When this will happen:
This feature will begin rolling out at the end of June 2023 and is expected to be fully complete by early July 2023.
How this will affect your organization:
Pre-installed apps can enhance the productivity of your users in their daily work. With this new feature, you’ll be able to install useful apps for all your end users with just a few simple clicks.
For Admins:
- Pre-install an app from the banner


- Pre-install an app from the app details page

- Manage a pre-installed app

For Users: Once an app is pre-installed by admins, it will appear in the flyout of the Teams client end for your users.

What you need to do to prepare:
At this time, no action is required from admins.
MC602604 — Microsoft Teams: New App Sharing Experience

Rolled Out
Microsoft 365 Roadmap ID 122536
We are introducing a new app sharing feature in Microsoft Teams, enabling users to share apps directly from the app details dialog to a chat, group chat, or channel.
When this will happen:
Rollout has begun and is expected to be complete by late June.
How this will affect your organization:
This new feature streamlines the app sharing process, eliminating the need to copy and paste app links across different locations on Teams. Users will be able to share apps directly from the app details dialog, enhancing collaboration and communication within the organization.
What you need to do to prepare:
There is no action required from you at this time as this feature will be enabled automatically. You may want to notify your users of this update.
MC602596 — Microsoft Teams Panels Update

>60 Days
Microsoft 365 Roadmap ID 129366
With this update, Teams Panels will support reserving a room using a QR code. This feature lets Microsoft Teams users book a room for meetings now, in the future, or add the room to an existing meeting by scanning a QR code on the scheduling panel and using the Teams app on their Android or iOS mobile phones.
All Teams Panels will have a QR code shown in the top left of the home screen. Panels users can either schedule a new meeting with the room pre-populated for them or easily see the room’s availability for their meetings and book the room with one click.
When this will happen:
Rollout is expected to begin in early August and is expected to be complete by early September.
How this will affect your organization:
In order to access this feature, be sure to have the most up-to-date release of Teams Panels and check that your users have access to the latest version of the Teams app on their mobile phones.
Please note the following:
- External tenants are currently not able to use this feature.
- This feature will ship default “ON”.
You can disable this feature on Teams Panels under Settings > Device settings > Teams Admin Settings > Meetings.
To reserve the room:
- Users need to scan the QR code using their mobile phone.
- In the Teams app on their mobile phone, users should select if they’d like to ‘Schedule a new meeting’ or ‘Reserve for existing meeting’.
- If the user schedules a new meeting, the room will be auto added as the location of the meeting. Users can then fill out the other meeting details.
- If the user selects to reserve the room for an existing meeting that is happening between now and midnight the next day, they will be able to see whether the room is available or booked at those times and can reserve with one click.


What you need to do to prepare:
To prepare for this incoming feature, we strongly recommend communicating this new feature to your users and share instructions if needed.
A recommended scanner for this feature is the mobile system/OS scanner on mobile phones. However, for Android, the scanning may not work if your users have both work and personal profiles on their Android phones. In this case, users will need to add mobile system/OS scanner in the work profile. To do that, follow the steps below:
- In Intune go to Apps -> Android and add
- Select Android enterprise system app
- Enter type of Android phone and Google and paste OS camera package name
- Assign to user / group of users
MC591878 — Introducing “Microsoft Default” setting to Teams Tag Management Settings

<30 Days
Microsoft 365 Roadmap ID 88318
We are introducing a Microsoft Default setting to Teams Tag Management settings in Teams Admin Center.
- If you have already explicitly made a selection to your Tag Management settings your tenant will not be affected by this change.
- If you have not made changes to Tag Management settings, Microsoft Default settings will apply for your tenant. Microsoft Default settings currently map to “Team Owners” value but is subject to change in the future.
- As Admin, please set tag management settings to reflect tenant-level preference. Select “Team Owners” to keep tag management limited to Team Owners, or select “Team owners and members” to allow all team members to create and edit tags.
In Teams client, users will still see the same options as they do today: “Team Owners” and “Team owners and members”.
When this will happen:
- Preview: We will begin rolling out late June 2023 and expect to complete by mid-July 2023.
- Targeted Release: We will begin rolling out early July 2023 and expect to complete by mid-July 2023.
- Standard Release: We will begin rolling out early July 2023 and expect to complete by mid-July 2023.
How this will affect your organization:
- If you have already explicitly made a selection to your Tag Management settings your tenant will not be affected by this change.
- If you have not made changes to Tag Management settings, Microsoft Default settings will apply for your tenant. Microsoft Default settings currently map to “Team Owners” value but is subject to change in the future.
If you are an EDU tenant, non-owner students cannot manage tags as long as the Tenant level settings is Team Owners or Microsoft Default. We will continue to respect explicit and preferred tenant settings over Microsoft Default settings. Select your preferred tag management setting for your tenant to ensure you are not impacted by future changes.
What you need to do to prepare:
As tenant Admin, please change your tag management settings to your preferred setting. Here are some steps you can take:
- Sign in to Microsoft Teams admin center at https://admins.teams.microsoft.com.
- In the left navigation pane under Teams section, select Teams settings
- Under Tagging section, select your preference for “Who can manage tags”

MC584833 — Group chat message copy links are now available!

30-60 Days
Microsoft 365 Roadmap ID 122522
This feature allows group chat members to create and share links to specific messages within the chat, with the intention of improving communication and organization of information in group chats.
When this will happen:
Targeted Release: Rollout will start in early June and expected to complete by early July.
Standard Release: We will begin rolling out early July and expect to complete by end of August.
How this will affect your organization:
Links work only for members already in the chat.
What you need to do to prepare:
There is no action needed to prepare for this change. You may want to notify your users about this change and update any relevant documentation as appropriate.
MC579613 — (Updated) Net Promoter Score survey coming to Teams Rooms on Windows

30-60 Days
Microsoft 365 Roadmap ID 121117
Updated June 30, 2023: We have updated the content below with additional information. Thank you for your patience.
In a continuous effort to gather feedback from our Teams Rooms on Windows customers, a new Net Promotor Score survey will appear at the end of some meetings in your conference rooms starting at the end of June.
When this will happen:
Standard Release: We will begin rolling out in late June and is expected to complete by early August.
How this will affect your organization:
After this release is completed, when the user ends a meeting in a conference room, sometimes they will be presented with a survey on the room console to answer some questions about the experience in the room.
Answering the survey is optional and the user can answer none, 1, 2 or the 3 questions from the survey.
The NPS for Teams Rooms is governed by the same rules as any other NPS survey from M365 in your organization:
- There is no PII (Personal Identifiable Information), EUPI (End User Pseudonymized Information) or OII (Organizational Identifiable Information) gathered as part of the survey.
- The information collected corresponds exclusively to the choices selected by the user
- The results of the survey are solely by Microsoft consumption and can be shared with the IT admin if needed via a Support ticket.
The selection of these rooms is random. In the future we will add a control for the IT admin to turn off or on the survey.
What you need to do to prepare:
If desired, inform users they may see a short survey at the end of some meetings and encourage them to give feedback.
The survey will be presented once every 5 days and for only one meeting in that day. If the survey is not answered, it will disappear from the console after a few seconds.
If you want to disable the survey, you can follow this guide Manage feedback policies in Microsoft Teams – Microsoft Teams | Microsoft Learn.
MC579612 — Admin Policy for Collaborative Annotations

Rolled Out
With privacy and security restrictions, we have implemented a user-level IT admin policy for admins to choose whether some or all users in the company can use Collaborative Annotations. Currently, there is a way to turn Annotations ON or OFF through cmdlet Set-SPOTenant-IsWBFluidEnabled, this will also influence Whiteboard.
When this will happen:
We will begin rolling out in mid-June and expect to complete rollout by late June.
How this will affect your organization:
IT admins will be able to turn ON or OFF Collaborative Annotations from the Teams admin center in Meetings –> Meeting policies.
What you need to do to prepare:
There is nothing you need to do to prepare.
MC579610 — (Updated) Microsoft Teams: Attach Cloud Files in Chat and Channel from Teams Mobile

30-60 Days
Microsoft 365 Roadmap IDs 98321 and 98327
Updated June 30, 2023: We have updated the rollout timeline below. Thank you for your patience.
We are introducing the capability to upload files from OneDrive from Teams Mobile chat and channel for iOS and Android. Additionally, users will be able to view Recent files and attach the most used files upfront from the Recent section.
When this will happen:
We will begin rolling out in late June 2023 and expect rollout to be complete by mid-August (previously mid-July).
How this will affect your organization:
To upload files, click on the ‘+’ icon in any chat or channel message when composing and then click on the paperclip icon.


What you need to do to prepare:
There is no action required from you at this time. You may want to notify your users of this update.
MC578280 — (Updated) Animated Backgrounds in Teams Meetings

>60 Days
Microsoft 365 Roadmap ID 122513
The animated background feature in Teams Meetings allows users to replace their existing background with a dynamic animation for a more immersive virtual environment. It offers various options to enhance meeting experience with creativity and personalization according to users’ preferences. Currently, only pre-defined backgrounds from Microsoft are supported. Animated backgrounds are identified by the small video icon in the bottom-left corner of the preview picture.
When this will happen:
Targeted Release: We will begin rolling out in mid-June and expect to complete rollout by late June.
Public Preview: We will begin rolling out in mid-June and expect to complete rollout by late June.
Standard Release: We will begin rolling out in early July and expect to complete rollout by late July.
GCC-High and DoD: We will begin rolling out in late September and expect to complete rollout by late October.
How this will affect your organization:
Users can go to the pre-join screen before the meeting start > Effects and Avatars > Video effects and select a new animated background. Animated backgrounds can be identified by the little video symbol in the bottom left corner of the preview picture.

Users can also change animated backgrounds when they start a meeting and go to More in meeting toolbar > Effects and Avatars > Select an animated background.
- Animated backgrounds are not available on low-end devices and require at least 8 GB RAM, CPU with 4 logical processors.
- Only pre-defined backgrounds from Microsoft are currently supported.
- Using more video filters might slow down background animation, in case of high machine workload.
What you need to do to prepare:
No preparation is needed. You may want to update your training materials indicating that animated backgrounds are now supported Teams meetings.
MC567504 — (Updated) Updated companion mode for Android meetings

<30 Days
Microsoft 365 Roadmap ID 109606
Updated June 20, 2023: We have updated the rollout timeline below. Thank you for your patience.
This feature allows you to add your Android device to an ongoing meeting, making it easy to chat, react, share, and more.
When this will happen:
Standard Release: We will begin rolling out early June 2023 and expect to complete by early July 2023 (previously mid-June).
How this will affect your organization:
The feature introduces Companion Mode for Android users.
What you need to do to prepare:
Nothing is needed to prepare. However, feel free to test this feature once it has rolled out.
MC565156 — (Updated) Teams Room Windows: Simplified Device Registration Process for Microsoft Teams Rooms Pro Management Portal

Rolled Out
Updated June 9, 2023: Pro portal enrollment will only work for devices that are in commercial cloud and not GCC-H – thus once the Pro Management agent is successfully installed and connected, devices with the Teams Rooms Pro license will be automatically enrolled and visible on the Pro Management portal.
We are pleased to announce an enhancement to the device registration process for Windows-based Teams Rooms devices on the Pro Management portal, aimed at making it more convenient for IT admins.
With the upcoming Teams Rooms app update (v. 4.17) scheduled for release by the end of June 2023, we have streamlined the registration process for Windows-based Teams Rooms devices. IT admins will no longer need to manually download and install the Pro Management agent on each device.
Instead, the Pro Management agent will be automatically downloaded and installed onto the Windows-based Teams Rooms devices as part of the Teams Rooms app update. This improvement simplifies the agent deployment and device enrollment tasks for IT admins, reducing their workload.
Once the Pro Management agent is successfully installed and connected, devices with the Teams Rooms Pro license will be automatically enrolled and visible on the Pro Management portal. This eliminates the need for any additional user action, making the process more efficient.
We understand the importance of a seamless and hassle-free device registration experience for IT admins. This update aims to improve the overall management process and reduce friction when connecting Windows-based Teams Rooms devices to the Pro Management portal.
Stay tuned for the upcoming Teams Rooms app update (v. 4.17) to take advantage of the simplified device registration process and enhance your device management capabilities with the Pro Management service.
How this will affect your organization:
MTRW Devices with Teams Room Pro license will automatically enroll into the pro management portal for state of the art monitoring and remote management capabilities for Microsoft Teams Rooms
What you need to do to prepare:
No action needed.
MC564198 — (Updated) Microsoft Teams: Select Together Mode for everyone on Microsoft Teams Rooms on Windows

<30 Days
Microsoft 365 Roadmap ID 126105
Updated June 30, 2023: Breakout room support (95680) will not be rolling out at this time, and we will communicate via Message center when we are ready to proceed. Thank you for your patience.
The latest version of Teams Rooms on Windows app 4.17 update includes new in-meeting experiences including:
- Choose your Together Mode scene and select it for everyone.
When this will happen:
We will begin rolling out in late June (previously mid-June) and expect to complete rollout by late July.
How this will affect your organization:
Choose your Together Mode scene and select it for everyone:
- Teams Rooms on Windows can now choose a Together Mode scene that fits your meeting type, using the view switcher on console.
- When your Teams Rooms on Windows is an organizer or presenter, you can have all of the participants see the same scene by clicking the ‘Select for everyone’ checkbox and ‘Apply’ button.
What you need to do to prepare:
Kindly notify your users about this new experience and update your training and documentation as appropriate.
MC556772 — (Updated) Microsoft Teams: A new default home screen and enhanced custom background feature for Teams Rooms on Windows

<30 Days
Microsoft 365 Roadmap ID 124774
Updated June 27, 2023: We have updated the content below with additional information. Thank you for your patience.
The latest version of Teams Rooms on Windows app 4.17 update includes new and improved home screen features, including:
- New default home screen experience with modern UI update
- Enhanced custom background feature for Teams Rooms Pro users.
When this will happen:
Roll out begins late-June and is expected to be completed by late July.
How this affects your organization:
New default home screen
The refreshed home screen with modern UI/UX updates for Teams Rooms on Windows was released as ‘opt-in’ in 4.16 app version to allow IT Admins to prepare for changes (M365 Public Roadmap #117952).
In June with the 4.17 app release, the modernized home screen becomes the default experience. Please see this documentation for important checks and changes.
Note that the calendar on the new Teams Rooms UI is aligning with how Teams desktop, web, and mobile communicate with Exchange – all of which do not support purely on-premises Exchange deployments. Only on-premises Exchange servers with Hybrid Configuration and AutoDiscover v2 published externally is supported in the 4.17 app and later versions. For a complete list of requirements, see Microsoft Teams and on-premises mailboxes and How Exchange and Microsoft Teams interact.
If you don’t meet all the requirements listed in the links above: once the 4.17 app version rolls out and your Teams Rooms calendar stops working, you will need to roll back to the legacy UI using the false XML setting to restore your calendar. The value of this setting will carry over in 4.18 and later app updates until the legacy UI is deprecated. More information on the timeline for the retirement of the legacy UI will be announced soon.
Enhanced custom background (Teams Rooms Pro SKU only)
On Teams Rooms with the new home screen experience and Teams Rooms Pro license: IT admins will have the option to specify up to 3 background images and identify which image is applied on the main room display, extended room display, and room console, using the following XML settings:
Custom
file1.jpg
file2.jpg
file3.jpg
Please carefully review the following input requirements for this feature to work as expected:
- Images must be in PNG, JPG, JPEG, and BMP format
- – this XML setting specifies background for the right side of the dual display which has the calendar; input in this setting is required regardless of whether the device is in single or dual display mode
- – this XML setting specifies background for the left side of the dual display which has the time and room info; input in this setting is required when dual display setting is ON
- – this XML setting specifies background for the room console; input in this setting is optional
To avoid cropping of background images, use the following image dimensions (based on 1080p display standards) for each screen aspect ratio respectively:
- 16:9 – 1920 x 1080 px (minimum image dimension required for room displays)
- 21:9 – 2560 x 1080 px
- 3:2 – 1920 x 1280 px
- 16:10 – 1280 x 800 px (minimum image dimension required for room consoles)
If a 4K image with a 3840 x 2160 px dimension is applied to a 4K display, the full image will be shown. However, if the dimensions of the image and the display do not match, the image scales to fill the frame while preserving the image aspect ratio (without letterboxing) and/or the image is cropped from the center. For example:
- If a 1080p image (1920 x 1080 px) with 16:9 aspect ratio is applied on a 21:9 display, the image scales to fill the frame without distorting the image, and is cropped from the center
- If a 4K image (3840 x 2160 px) is applied on a 1080p display, the image is cropped from the center
Note that once these new custom background XML settings are applied, the legacy custom theme settings will be disregarded. For more information, see
Set up and manage Teams Rooms on Windows custom backgrounds – Microsoft Teams | Microsoft Learn
What you need to do to prepare:
Kindly notify your users about this new experience and update your training and documentation as appropriate.
MC556150 — (Updated) Microsoft Teams: Collaborative Stageview

30-60 Days
Microsoft 365 Roadmap ID 93769
Updated June 30, 2023: We have updated the rollout timeline below. Thank you for your patience.
Users can now open app content in a separate Teams window that’s been built for collaboration.
When this will happen:
Standard Release: We will begin rolling out mid-July (previously mid-June) and expect to complete by late August (previously late June).
How this will affect your organization:
Collaborative Stageview is a new type of Teams window that allows users to engage with content and conversation, side-by-side. For apps that have built their experience for Collab Stage, it allows users to:
– Open their content from eligible adaptive cards directly into a new Teams window
– Engage with their app content in a large Teams canvas
– Continue the conversation from which they came, within the Collaborative Stageview side panel
What you need to do to prepare:
Users opening apps in the Teams web client will be unaffected by this change. In the web client, Collaborative Stageview will fall back to the current Stageview modal.No action is required from admins. Apps that have built for Collaborative Stageview will pop out into new Teams windows.
MC555188 — (Updated) Device State Change and Submit to Approve Admin Notifications Available in Teams admin center

Rolled Out
Updated June 8, 2023: Device state monitoring notifications is rolled out and available for use to all GCC customers now.
Please Note – LoB App submission notifications will be available to use around July/August timeframe.
In public cloud, Teams admin center has monitoring and alert functionality where admins can get notified if a device’s state has changed or if a custom app is submitted for admin approval.
In GCC cloud, Admins can soon use different sets of rules available under the Notifications and alerts section in the Teams admin center to monitor Teams capabilities and receive alerts. For example, you can actively monitor the health of Teams devices such as IP Phones, Teams Rooms on Android, and others if they unexpectedly go offline.
When this will happen:
We will begin rolling out in mid-May and expect to complete rollout by late May.
How this will affect your organization:
Your organization can use Teams monitoring and alerting to do the following items:
- Automatically manage Teams capabilities
- Be alerted if they show something unexpected.
- Take corrective actions to get things back on track.
You must be a global admin in Microsoft 365 or a Teams service admin to configure alerting rules. To use this feature:
- Sign into the Teams admin center.
- From the left navigation, select Notifications and alerts.
- Choose the rule you want to configure from Rules.
What you need to do to prepare:
There is nothing required from you at this time. If you would like to use this feature, please configure rules appropriately for your organization. For additional information, please visit this documentation.
MC554158 — (Updated) A new experience to search within chat and channels.

>60 Days
Microsoft 365 Roadmap ID 122550
Updated June 30, 2023: We have updated the rollout timeline below. Thank you for your patience.
We are excited to introduce a new and improved experience to search within chats and channels.
When this will happen:
- Standard: We will begin rolling this out in late July (previously mid-June) and expect to complete rollout by early August (previously early July)
- GCC: We will begin rolling this out in early August (previously mid-July) and complete rollout by late August (previously early August).
- GCC-H: We will begin rolling this out in late August (previously late July) and complete rollout by early September (previously mid-August).
- DoD: We will begin rolling this out in mid-September (previously mid-August) and complete rollout by early October (previously early September).
How this will affect your organization:
A few key enhancements include:
- The new in-chat and in-channel Search experience will now be available in the right handrail, making it possible to see your chat/channel list and your new search results in one single view. The initiation can be done using the keyboard shortcut Ctrl+F(win) or Cmd +F (Mac).
Note: Search capability on the new Channels experience is currently available on the main view, and we will extend it to the conversation view very soon.
- In addition to the keyboard shortcut, a dedicated button ‘Find in Channel’, placed on the channel info pane can be used to initiate contextual search:
Note: we are working on bring the search entry point to the chat surface soon.
- We now have introduced enhanced captioning and keyword highlighting to aid the discernment of results in chat and channel.
- In-chat search will now also be available in pop-out chats.
What you need to do to prepare:
No preparation needed. The new search experience is set up by default, but you may want to draw attention to these new capabilities in Teams.
MC554154 — (Updated) Teams Rooms on Android support for GCCH

<30 Days
Microsoft 365 Roadmap ID 121548
Updated June 24, 2023: We have updated the content below with additional information. Thank you for your patience.
Teams Rooms on Android and the Teams Admin Center will fully support GCC-H customers. This is feature available only with the Teams Rooms Pro license.
When this will happen:
We will begin rolling out in late June (previously mid-June) and expect to complete by late July (previously mid-July).
How this will affect your organization:
Pro License customers in GCCH will be able to sign into Teams Rooms on Android and also leverage Teams Admin Center for managing their MTRAs.
Note: The following features are not available in GCC-High.
- People counting in a meeting
- Starting a whiteboard
- Report a problem
- 1 on 1 call recording
MC552789 — (Updated) Microsoft Teams: Block Anonymous Users’ Meeting Chat Read Access in Addition to Current Write Access

30-60 Days
This message is associated with Microsoft 365 Roadmap ID 123974
Updated June 20, 2023: We have updated the content below for clarity. Thank you for your patience.
Microsoft Teams IT Admins will soon be able to block anonymous users from accessing the chat in internally hosted meetings by disabling their read access on top of the existing disabled write access. This release of Microsoft Teams updated meeting chat setting will be rolling out across Microsoft Teams Desktop, Mobile and Web and will provide an additional way for tenants to manage external users’ chat access in meetings hosted by internal users.
When will this happen:
GA: We will begin rollout in mid-June and expect to complete rollout by late June.
GCC: We will begin roll out in early July and expect to complete rollout by mid-July.
GCCH: We will begin rollout in late July and expect to complete rollout by early August.
DoD: We will begin rollout in early August and expect to complete rollout by mid-August.
How this will affect your organization:
IT Admins can turn ON this setting for internal users from the Teams Admin Center under Meeting Chat or from PowerShell under MeetingChatEnabledType. Anonymous participants joining meetings organized by internal users who have Meeting Chat as On for everyone but anonymous users from the Admin Center or MeetingChatEnabledType as EnabledExceptAnonymous from the PowerShell will not have read or write meeting chat access on any Teams platforms. Meeting participants who are in the same meeting and have chat access will be notified that some external participants in the meeting might not see chat when this setting is in effect.
What you need to do to prepare:
You may want to notify your users about this new setting and the potential effect on participants’ chat access in their meetings with external users. For additional information, please visit this documentation.
MC552782 — (Updated) Microsoft Teams: Default Meeting Layout Controls for Teams Rooms on Android

<30 Days
This message is associated with Microsoft 365 Roadmap ID 121663
Updated June 7, 2023: We have updated the rollout timeline below. Thank you for your patience.
Microsoft Teams Rooms on Android IT admins can choose the default meeting layout. When a meeting begins, room users will see the default meeting layout. They can switch to other views using the view switcher during a meeting.
When this will happen:
We will begin rolling out in late-June (previously mid-June) and expect to complete by late-July (previously mid-July).
Note: There can be a delay between when features are released by Microsoft and when they become available on a device make and model. If an update isn’t available on your device, check with your device manufacturer for information on the availability timeline.
How this will affect your organization:
IT admins can choose the default meeting layout by selecting Content only and Content + Gallery when content sharing begins. Standard, Premium, and Pro customers can also choose Front Row as the default layout.
What you need to do to prepare:
Please plan on updating all Microsoft Teams Rooms on Android in your tenant to the latest version through the Teams Admin Center. Once devices are updated, you can control new functionalities through the device settings and notify your users about these new capabilities and update your training and documentation as appropriate.
MC552334 — (Updated) Creation of Default Notes tab in new standard channels in Teams

TBD
This message is associated with Microsoft 365 Roadmap ID 101962
Updated June 13, 2023: We will not be rolling out to GCC, GCC-High, DoD and Microsoft 365 operated by 21Vianet as described below. Organizations in these environments can safely disregard this message and we will communicate the new timeline via Message center when we are ready to proceed. Additionally, MC496248 (January ’23) is not applicable to these environments. We apologize for any inconvenience.
MC550533 — (Updated) Microsoft Teams: Virtual Appointments for GCC

Rolled Out
This message is associated with Microsoft 365 Roadmap ID 121360
Updated June 13, 2023: We have updated rollout timeline below. Thank you for your patience.
Advanced Virtual Appointments features in Teams Premium launched to General Availability for commercial customers in early February 2023, and is currently supported in Microsoft Teams.
The Virtual Appointments app provides a central hub for all your virtual appointments needs in Microsoft Teams. You can schedule, view, and manage virtual appointments, get real-time status updates in a queue view, view analytics and reports to gain insight into virtual appointments activity, and configure calendar, staff, and booking page settings.
The virtual appointments are held through Microsoft Teams meetings, which offer robust video conferencing capabilities. For example, a user can share their screen and review data with the end user or an advisor can request electronic signatures on documents, allowing them to close transactions remotely.
Virtual appointments analytics will also be available as part of the release. With our reports, organizations can view and analyze usage trends and history. With individual or department analytics, organizations can focus on key metrics, such as no-shows, wait times, and calendar-level analytics. Organizational analytics allow administrators or operations supervisors to view aggregated analytics across their department and entire organization.
When this will happen:
Rollout for GCC will begin in mid-June (previously early June) and is expected to be complete by late June 2023.
How this will affect your organization:
With any Microsoft 365 license, you can use basic Virtual Appointments capabilities to schedule and join business-to-customer meetings. For example, you can schedule appointments in the Bookings calendar and external attendees can join through the Virtual Appointments Teams app. Teams Premium unlocks advanced Virtual Appointments capabilities that your organization can use to manage and personalize the experience. These include a queue view of scheduled and on-demand appointments, custom logo, and analytics.
The following advanced feature are currently not available in GCC:
- Mobile browser join: attendees joining Virtual Appointments from mobile browser will not be supported in GCC. They will instead be routed to the native Teams app.
- Two-way lobby chat from queue
- SMS notifications: SMS notifications will not be supported in GCC when appointments are scheduled in the Virtual Appointments app
- Virtual Appointments Graph API’s
What you need to do to prepare:
We recommend preparing your users to use Virtual Appointments.
MC550081 — (Updated) Microsoft Teams: New Channels Experience

30-60 Days
This message is associated with Microsoft 365 Roadmap ID 91683
Updated June 24, 2023: We have updated the rollout timeline below. Thank you for your patience.
A new channels experience in Microsoft Teams has been built with an intuitive design that allows teams to focus and stay on tasks, bring everyone up to speed, and actively engage in real-time. The following features will be rolling out:
- The compose box and recent posts will appear at the top of the page. It’ll now be much easier to start a new post, keep up with the latest conversations and participate – giving users the confidence that they’ve not missed anything.
- Every post is now a true conversation that users can focus on. Users can navigate to a conversation view that makes the discussion more engaging and synchronous, just like a chat. Users can also pop out the post, keep an eye on the discussion, while continuing to work on other topics.
- A streamlined information pane will include all the important contextual information like channel’s members and pinned posts so new team members can quickly on-board and for all members to find the information they need, right in the channel.
- Pin posts to make it easy for everyone to know what’s important in the channel and quickly reference it.
- Simplified badging is making it easier for users to understand when there are new unread activities in teams. In addition, the simplified design helps users focus on the specific channels which requires the most attention, like channels in which the user was @mentioned.
When this will happen:
Targeted Release: Started rolling out in May and is expected to complete in early July.
GA and GCC: We will begin rollout in late July (previously early June) and expect to complete rollout by early August (previously mid-June).
GCC-H and DoD: We will begin rollout in early August (previously mid-July) and expect to complete rollout by late August (previously late July).
How this will affect your organization:
Users in your organization will not need to make any changes and will get the new channels experience by default.
What you need to do to prepare:
Admins will not need to make any changes.
MC549348 — (Updated) Webinar Email feature updates -customize content and time to send reminders

30-60 Days
This message is associated with Microsoft 365 Roadmap ID 119391
Updated June 8, 2023: We have updated the rollout timeline below. Thank you for your patience.
Emails for Webinars are critical to engage with registrants and often organizers feel the need to customize the content. To enable this, we are rolling out two features.
- The content of the emails (i.e. all webinar related attendee emails) can be edited by the event organizers. This is reserved for Teams Premium licensed organizers.
- Time to send reminder emails can be configured by the event organizers. This is reserved for Teams Premium licensed organizers.
When this will happen:
Standard Release: rollout will start in mid-July and expected to be completed by end of July
GCC: rollout is end of July and should be complete by mid-August
How this will affect your organization:
Email customization is governed by IT admin policy to enable admins to restrict organizers with Teams Premium license from being able to edit the content of the emails. This setting is available in Teams Events policy. Set-CsTeamsEventsPolicy
What you need to do to prepare:
Both these features are reserved for users that have a Teams Premium license. The policy to customize content is enabled by default in commercial SKU.
MC543386 — (Updated) Microsoft Teams: Mark All As Read for Activity Feed

Rolled Out
This message is associated with Microsoft 365 Roadmap ID 102238
Updated June 20, 2023: We have updated the rollout timeline below. Thank you for your patience.
Users can triage their activity feed more efficiently using the new ‘Mark all as read’ feature. With just one click, users can mark all unread activities as read.
When this will happen:
Standard Release: We will begin rolling out in mid-June (previously early June) and expect to complete rollout by late June (previously mid-June).
How this will affect your organization:
Users can use this feature by following these steps:
- Go to the Activity feed
- Click on the ellipsis (…) next to the filter icon
- Select Mark all as read.
What you need to do to prepare:
There is nothing required from you at this time. You may want to notify users of this update.
MC537952 — (Updated) Microsoft Teams for Mobile: Chat Details Update

<30 Days
This message is associated with Microsoft 365 Roadmap ID: 114938
Updated June 24, 2023: We have updated the rollout timeline below. Thank you for your patience.
We are updating the chat details experience for Teams Mobile Group Chats, One on One Chats, and Self Chats.
When this will happen:
Targeted Release and Preview: We will begin rolling out in mid-June (previously mid-April) and expect to complete rollout by late June (previously mid-May).
Standard Release: We will begin rolling out in late June (previously mid-May) and expect to complete rollout by early July (previously mid-June).
GCC, GCC-H, DoD: We will begin rolling out in early July (previously late June) and expect to complete rollout by late July (previously mid-July).
How this will affect your organization:
The following items will be new:
- Updated UI and layout.
- Users are now able to access their own people card from the chat details and see Files and Apps from that conversation rather than seeing Files and Apps from the chat canvas, which will be deprecated.
What you need to do to prepare:
There is no action required at this time. You may want to notify your users of this change.
MC537412 — (Updated) Teams Rooms: Windows 11 support for Teams Rooms on Windows devices

<30 Days
This message is associated with Microsoft 365 Roadmap ID 122148
Updated June 30, 2023: We have updated the timing outlined below. Thank you for your patience.
While our rollout plans have not changed, based on feedback from customers who need some additional time to test Windows 11, we are offering a temporary hold on Windows 11 upgrade to customers until November 20, 2023. Customers who want to utilize this option MUST follow these instructions before mid-June 2023 (before 4.17 app update) to delay upgrade to Windows 11.
Instructions:
- Set this registry key to put the Windows 11 upgrade on an MTR on hold.
- Path: HKEY_LOCAL_MACHINESOFTWAREMicrosoftPPISkypeSettings
- Key: CBU11
- Data: 1 (as a dword)
- Delete the registry key to resume the upgrade.
Important: If you do not set this registry key prior to 4.17 app update (releasing in mid-June), eligible devices will automatically upgrade to Windows 11. Please also note that this only applies to existing in market/ in channel devices not on application version 4.17, and that OEMs have already moved to Windows 11 based images (due to end of sales for Windows 10 IoT Enterprise in Oct 2023, and lead time needed for OEMs to create media).
Teams Rooms on Windows devices that are eligible for Windows 11 upgrade will receive the Windows 11 22H2 release in June 2023 (previously May). This will be offered and installed on their devices with 4.17 dot release. Devices that are not eligible due to an incompatible processor will continue to use Windows 10 per Windows hardware support policy. These devices will be offered Windows 10 22H2 release.
Devices that cannot upgrade to Windows 11 will continue to be supported until the end of Windows 10 End of servicing for General Availability Channel or hardware support from OEM, whichever comes first. Windows 10 releases information atWindows 10 release information. Please note, not all Windows releases are supported for Teams Rooms, to find supported version, see Microsoft Teams Rooms app version support.
In addition, Teams Rooms on Windows OEMs will shift their manufacturing to Windows 11 IoT Enterprise as Windows 10 IoT Enterprise end of license sales is fast approaching (10/14/2023). OEMs with existing Windows 10 licenses inventory (or to support recovery media for existing Windows 10 based devices) may continue to provide Windows 10 based images for some time that should automatically update to Windows 11 post setup. All OEMs are expected to move to Windows 11 IoT Enterprise based images in future. Customers should ensure all new hardware purchases check for Windows 11 compatibility to future proof their device investment.
When this will happen:
Standard Release: We will begin rolling out late June (previously early May) and expect to complete by late July (previously late May).
How this will affect your organization:
Microsoft Teams Rooms on Windows application release 4.17 will be available in June 2023 (previously May). This app will allow eligible Teams Rooms on Windows devices to receive Windows 11 22H2 update through Windows update. After the dot release has booted normally at least once, customers can either wait for 8 days for Windows 11 22H2 to install automatically or can pull the latest Windows 11 update from Windows Updates manually by checking for updates from the Windows Settings app. Devices that are not eligible will be offered Windows 10 22H2 release.
To check if your device is eligible for Windows 11, you can either check the list of eligible Intel processors for Windows 11 at https://learn.microsoft.com/en-us/windows-hardware/design/minimum/supported/windows-11-supported-intel-processors
What you need to do to prepare:
To ensure that there are no issues preventing the Windows update in your environment, it is recommended to manually update a small set of devices to 4.16.134.0 (Release notes for Microsoft Teams Rooms—manual-update-only) and check for updates, after 4.16.134.0 release has been installed and booted normally at least once on them. From admin mode, check for updates using the Windows Settings app: Windows 11 22H2 or Windows 10 22H2 (depending on what’s supported for your devices) should be offered and should download and install. If the updates are not offered or installed, check for external policies (such as MDM or Active Directory Group Policies) that might be in place for your organization that could block this update.
MC536885 — (Updated) Changes in Normalization

30-60 Days
Updated June 7, 2023: We have updated the content below for clarity. Thank you for your patience.
Stopping normalization on number that starts with plus sign (+)
Normalization in Microsoft Teams was not designed to do normalization when the phone number starts with plus sign (+) as documented, but we’ve never enforced this in the Teams desktop or Web client. We are planning to enforce this in the future but for now we recommend avoiding this pattern.
We are making this change to align with our Calling Service, other Teams services, Azure Communication Services SDKs, and other Microsoft services. Numbers that start with a plus sign (+) will not pass through any normalization rules.
Translated numbers that do not start with a plus sign (+), will pass through normalization rules more than once. Please see Create and manage dial plans for more information.
When this will happen:
Standard Release: We will begin rolling out mid-July and expect to complete by late August.
How this will affect your organization:
There is no immediate impact. We are letting you know, so you can prepare for this change. If you are relying on dial plan policies to translate numbers dialed starting with a +, those rules will no longer work. You will need to instruct your end users to either dial the correct E.164 number starting with a +, or dial numbers without a + to match dial plan policies.
What you need to do to prepare:
There is no action needed to prepare for this change. You may want to notify your users about this change and update any relevant documentation as appropriate.
MC528955 — (Updated) Microsoft Teams: New Files app in Teams

<30 Days
This message is associated with Microsoft 365 Roadmap ID 97677
Updated June 20, 2023: We have updated the rollout timeline below. Thank you for your patience.
Securely store, organize, and collaborate on all your files anytime, from anywhere and across all of your devices with the new files app experience in Teams. The new files app brings a modern experience to all of your content from your chats, channels or meetings including any location from OneDrive or SharePoint.
When this will happen:
Preview: We will complete rollout by late March.
Standard Release: We will begin rolling out in early April and expect to complete rollout by mid-April.
GCC: We will begin rolling out in late May (previously early May) and expect to complete rollout by mid-June (previously late May).
GCC-H: We will begin rolling out in late June (previously mid-June) and expect to complete rollout by early July (previously late June).
DoD: We will begin rolling out in early July (previously late June) and expect to complete rollout by late July (previously mid-July).
How this will affect your organization:
Users can easily discover and locate files that are relevant right within the Teams app. This makes it possible to locate, share and collaborate with OneDrive files without leaving the Teams app and switching between various apps. An updated menu bar will help you navigate to your content quickly.
- Home: Get back to your recently accessed files
- My files: Access your personal OneDrive files
- Shared: Find files shared with you and files you have shared across M365
- Downloads: Locate files downloaded from Teams on your computer
- Quick Access: Pin document libraries or channels files tab to access them quickly
The existing Files app that is enabled by default will automatically be updated with new files app experience.
What you need to do to prepare:
There is nothing you need to do to prepare.
MC525143 — (Updated) Microsoft Teams: Video Clip Feature in Teams for Government Clouds

<30 Days
This message is associated with Microsoft 365 Roadmap ID 114155
Updated June 20, 2023: We have updated the rollout timeline below. Thank you for your patience.
Video Clips are a new way of working and connecting with coworkers using short video in Microsoft Teams. Users can record, send, and playback video messages in chats on all Teams endpoints. Recording limited to 1min across all platforms.
When this will happen:
GCC: We will start rolling out in mid-March and complete rollout by late March. – Complete
GCC-H: We will begin rolling out in early June (previously mid-Apr) and complete rollout by mid-June (previously late April).
DoD: We will begin rolling out in mid-June (previously mid-May) and complete rollout by mid-July (previously late June).
How this will affect your organization:
Teams users will soon be able to record, send and playback video messages in 1:1 and group chats with the Video Clips feature. Recording time will be limited to one minute across all platforms. This feature will be enabled automatically for users, however, Admins can disable this feature via the Teams Admin center.
What you need to do to prepare:
There is no action required from you at this time. For additional information on messaging policies, please visit this documentation. You may want to notify your users of this change and update any relevant training documentation as appropriate.
MC523057 — (Updated) Collaborate in Teams Meetings with Excel Live in GCC-H and DoD

30-60 Days
Microsoft 365 Roadmap ID 116897
Updated June 13, 2023: We have updated the rollout timeline below. Thank you for your patience.
With “Excel Live,” you can share and collaborate with Excel workbook in a meeting. This is handy when you want to get work done with your colleagues in a meeting, it seamlessly turns the meeting window canvas to an Excel workbook collaboration without having to move between windows and screens.
When this will happen:
GCCH: We will begin rolling out in early May (previously early April) and expect to complete rollout by late July (previously late May).
DoD: We will begin rolling out in early August (previously early June) and expect to complete rollout by late August (previously late June).
How this will affect your organization:
To begin collaborating with Excel workbook:
- While you are in a meeting, open share tray and scroll down to the Excel Live section.
- Select the Excel workbook from the most recently used file that you want to share and collaborate with others in the meeting. If you are not able to find the Excel workbook, you can also use ‘Browse OneDrive’ or ‘Browse my computer‘ to select the workbook.
- Once the workbook is selected the share permission dialog will appear. Click share to provide access to people invited to the meeting.
- The file will be loaded for all participants in a Teams meeting window and will be ready for editing.
Supported scenarios:
- Excel Live is supported on Desktop, Mac, and Mobile. Web support is coming soon.
- The feature is enabled by default. Specific IT admin controls will be available soon.
What you need to do to prepare:
There is no action needed to prepare for this change. You may want to notify your users about this change and update any relevant documentation as appropriate.
MC513664 — (Updated) Suggested Files in 1:1 Chats

>60 Days
This message is associated with Microsoft 365 Roadmap ID 95065
Updated June 22, 2023: We have updated the rollout timeline below. Thank you for your patience.
As an extension of Suggested Replies in 1:1 chats, you can now easily save time when you need to send a file in a chat by tapping on a “Share file” suggestion.
When this will happen:
Standard Release: We will begin rolling this out early July (previously early April).
GCC: We will begin rolling this out early August (previously early July).
GCC-High: We will begin rolling this out early September (previously early August).
DoD: We will begin rolling this out early September (previously early June).
How this will affect your organization:
Once available, users will be able to tap on a “Share file” action in chat whenever intent is detected to send a file.
What you need to do to prepare:
This feature ships default on; review Manage messaging policies in Teams.
If you wish to disable this feature in your tenant, please disable the Suggested Replies setting that is found in Messaging Policies.
Users also have a setting within the app so they can disable the feature.
MC496629 — (Updated) Changes coming to how dialed phone numbers are matched to users – GCCH

>60 Days
Updated June 27, 2023: We have updated the rollout timeline below. Thank you for your patience.
Microsoft will be changing how numbers dialed by Teams users or arriving from the PSTN match the number assigned to users. This process is often referred to as Reverse Number Lookup (RNL).
The change applies to users with an assigned phone number with an extension using the following formats:
- Where the last several digits of the base number are also added as the extension. For example, +14025557334;ext=334, where 334 is both included in the base number and as the extension.
- Where both the base number and extension are unique for each user. For example, +14025557253;ext=3111 and +14025556567;ext=3112
- Where the base number is common, and the extension is unique for each user. For example, +14025557000;ext=111 and +14025557000;ext=112
The users configured with this type of phone number are either Teams users or Skype for Business Server on-premises users.
This may be a breaking change if your Teams dial plans and Direct Routing Session Border Controllers are not configured to convert dialed numbers into the full number assigned to the user including the extension.
When this will happen:
We will begin rolling out this change in mid-September (previously early July) and will be complete by late October (previously mid-August).
How this will affect your organization:
You might be impacted by the change, if you have users configured with phone numbers with extensions.
Today, when a call is made to a phone number, the lookup to see if that number is assigned to a specific user works as follows:
- if a call is made to +14025557334;ext=334, we will find the user configured with the phone number +14025557334;ext=334
- if a call is made to +14025557334, and there is no user configured with +14025557334, we will find the user configured with the phone number +14025557334;ext=334.
This can be an issue in situations where the same base number is used for multiple users. For example:
- User Alice is assigned +14025557000;ext=111
- User John is assigned +14025557000;ext=112
If a call is made to +14025557000, and there is no user configured with +14025557000, we would match to the first user found with +14025557000 as a base number (Alice in this case).
Based on customer feedback, we are changing the matching logic to be an exact string match between the called number and the full phone number configured for a user.
After the change, in the above examples, we will not find a user configured with the phone number +14025557334, +14025557253 or +14025557000 and calls to those number will not match to a user instead of potentially being routed to the wrong person.
What you need to do to prepare:
If you have users configured with phone numbers with the extensions, to prevent calls not being matched to the intended user, please ensure that dialed numbers from Teams users and incoming PSTN calls are formatted to exactly match the full phone number configured on the user accounts.
Check that your tenant dial plans include normalization rules that can translate abbreviated dial strings to the full phone number configured on users. In example above, the following phone number normalization rule will translate a dialed 3-digit number to the full phone number configured on the users to ensure calls will succeed:
- Pattern ^(d{3})$ and Translation +14025557$1;ext=$1
Check that any phone number manipulation/translation rules used on your Direct Routing Session Border Controller are capable of making the translation to the full phone number configured on your users.
For more information, see:
MC513049 — (Updated) Video Closed Caption in PowerPoint Live

<30 Days
Microsoft 365 Roadmap ID 114494
Updated June 16, 2023: We have updated the rollout timeline below.
Closed captions will soon be supported for embedded videos in PowerPoint Live for Teams. Video closed captions in PowerPoint Live will be rolling out across Microsoft Teams Desktop and Web and will allow PowerPoint Live users to create accessible presentations that include video.
When this will happen:
We will begin rolling out to PowerPoint Live users in early-March and expect to complete rollout by mid-March.
GCC, GCC-High and DoD: We have begun rolling out and will complete by mid-July.
How this will affect your organization:
When creating a PowerPoint presentation in PowerPoint for Windows or PowerPoint for Mac, users have the option to include a closed captions file with their video (as shown below).
When the presentation is shared via PowerPoint Live for Teams, any embedded video that includes closed captions stored in a separate file will automatically include the option for attendees to turn on closed captions.
What you need to do to prepare:
To prepare for this change, you may want to notify your users about the new support for video closed captions in PowerPoint Live for Teams, update your training and documentation as appropriate, and encourage your users to make their PowerPoint presentations more accessible by adding closed captions for their embedded videos.
Intune
MC615367 — Plan for Change: Microsoft Visio Viewer for iOS will soon not be supported for Intune app protection policies

30-60 Days
Announced in MC517336, Microsoft 365 is retiring the Microsoft Visio Viewer mobile app for iOS, and it will soon no longer be available in the Apple App store. Starting in late August 2023 or soon after, Intune app protection policies (APP, also known as MAM) will no longer support Microsoft Visio Viewer.
How this will affect your organization:
If you are using APP for Microsoft Visio Viewer, we recommend enabling a Conditional Access (CA) policy to prevent users from accessing your organization’s resources through this app.
User impact: Once you have enabled the CA policy, users attempting to sign-in with their organization’s email will receive an error message.
What you need to do to prepare:
Update your documentation and notify your helpdesk as needed. We recommend creating an app-based CA policy with Grant access > Require app protection policy selected, to ensure only managed apps can access your organizations resources. For more information, see Use app-based Conditional Access policies with Intune.
Related information:
Microsoft Visio Viewer app for iOS will be retired from the App Store
MC604891 — Endpoint analytics is now available in Government cloud

Rolled Out
With Intune’s June (2306) service release, Endpoint analytics is available to tenants in Government cloud. To learn more, read What is Endpoint analytics?
When this will happen:
This feature is rolling out with Intune’s June (2306) service release.
How this will affect your organization:
These analytics give you insights for measuring how your organization is working and the quality of the experience you are delivering to your users, enabling you to proactively make improvements or resolve issues.
What you need to do to prepare:
Review the documentation and prerequisites to get started: What is Endpoint analytics?
MC591861 — Plan for Change: Updates to Managed Google Play apps in Intune

<30 Days
In Microsoft Intune’s July (2307) service release, admins will see several changes to how Managed Google Play public apps in Intune are managed, introducing automatic daily syncs and an improved User Interface (UI). Google has deprecated several features and methods in the Google Play Enterprise Mobility Management API as discussed in this post: https://developers.google.com/android/work/deprecations. As a result, we will be migrating to the newer Android Management API.
How this will affect your organization:
If you are using Managed Google Play apps in Intune, be aware of the upcoming changes:
- When adding Managed Google Play public apps in Intune, admins will no longer need to go through the app “Approve” workflow. Instead, admins will click “Select” for the apps they want to add and then “Sync.”
- When adding Managed Google Play private apps and Google Play web links, admins will need to click “Select” (similar to adding public store apps) in the Managed Google Play pane to add them.
- Note that admins will still need to check for updates to app permissions on the play.google.com/work portal.
- All Managed Google Play apps, including private apps and web links, will automatically sync daily. This applies to previously added apps and all newly added apps going forward.
- The Managed Google Play connector page will no longer link to the Managed Google Play Store. Apps should be added using the Managed Google Play iFrame in Apps > Android > + Add > Managed Google Play app. For more details read, Add Managed Google Play apps to Android Enterprise devices with Intune.
User Impact: Users will be unable to re-install Managed Google Play apps that were targeted as “uninstalled” or removed from the device by the admin until the app is targeted to the device again. This applies to all Android Enterprise enrollment scenarios.
What you need to do to prepare:
Review the changes outlined above and notify your admins and users, as needed. Additionally, we recommend evaluating your current assignment filters, if any, to ensure that included assignment filters for available apps does not create undesired changes to your app assignments. These changes are expected in Intune’s July (2307) service release. Please, refer to the Support tip at https://aka.ms/MGP_Updates for more up-to-date information and timelines.
MC591858 — Plan for Change: Updates for device compliance policy reports in Intune

<30 Days
Expected with Microsoft Intune’s July (2307) service release, we will be continuing to update device compliance policy reports in Intune to improve data accuracy, performance, and the user interface (UI). Additionally, the device compliance policy reports will now support scope tags. For more details, read: Updated experience for Intune device compliance reports.
How this will affect your organization:
If you are using reports within device compliance policy in the Intune admin center (Devices > Compliance policies > select a policy), you will need to be aware of the following changes:
- Important: Scope tag support means that some admins may no longer have access to view reporting for all compliance details, numbers of compliant or noncompliant devices, or compliance settings for their organization.
- The pane navigation for a selected compliance policy will be replaced by a single pane split into two tabs, Overview and Properties. The Overview tab will contain a bar chart summary for device compliance policy status and links for the Device status report and Per-setting status report. The Properties tab will contain the same information as today, including the “Essentials” section, and can continue to be used to edit existing policies.
- The User status report (currently located on the Overview page) will be removed as the same information will be discoverable in the updated Device status report.
- Additionally, new versions of the Setting compliance and Policy compliance reports (Devices > Monitor > Compliance) will be added to Device compliance reports (Reports > Device compliance) which will have the same information but with better performance and accuracy. The old reports under Devices > Monitor will be removed at a later date.
What you need to do to prepare:
Read the blog Updated experience for Intune device compliance reports for more details on the changes outlined above. Additionally, we recommend that you review your role-based access control (RBAC) roles and scope tags to ensure all admins have the access they need for their specific roles.
MC579608 — Plan for Change: Intune moving to support macOS 12 and higher later this year

TBD
Later this year, we expect macOS 14 Sonoma to be released by Apple. Microsoft Intune, the Company Portal app and the Intune MDM agent will be moving to support macOS 12 (Monterey) and later. Since the Company Portal app for iOS and macOS are a unified app, this change will occur shortly after the release of iOS/iPadOS 17. This does not affect existing, enrolled devices.
How this will affect your organization:
This will only affect you if you currently manage, or plan to manage macOS devices with Intune. This may not impact you because your users have likely already upgraded their macOS devices. See macOS Monterey is compatible with these computers – Apple Support for a list of devices that are supported.
Note: Devices that are currently enrolled on macOS 11.x or below will continue to remain enrolled even when those versions are no longer supported. New devices will be unable to enroll if they are running macOS 11.x or below.
What you need to do to prepare:
Check your Intune reporting to see which devices or users may be affected. Go to Devices > All devices and filter by macOS. You can add in additional columns to help identify who in your organization has devices running macOS 11.x or below. Request that your users upgrade their devices to a supported OS version before this change.
MC578235 — Plan for Change: Intune moving to support iOS 15/iPadOS 15 and higher later this year

TBD
Later this year, we expect iOS 17 to be released by Apple. Microsoft Intune, including the Intune Company Portal and Intune app protection policies (APP, also known as MAM), will require iOS 15/iPadOS 15 and higher shortly after the iOS 17 release.
How this will affect your organization:
If you are managing iOS/iPadOS devices, you might have devices that will not be able to upgrade to the minimum supported version (iOS 15/iPadOS 15). Provided that Microsoft 365 mobile apps are supported on iOS 15/iPadOS 15 and higher, this may not affect you; you have likely already upgraded your OS or devices.
See the following Apple documentation for devices to check which devices support iOS 15 or iPadOS 15 (if applicable).
For instructions on how to check in the Microsoft Intune admin center which devices or users may be affected, read below.
Note: Userless iOS and iPadOS devices enrolled through Automated Device Enrollment (ADE) have a slightly nuanced support statement due to their shared usage. The minimum supported OS version will change to iOS 15/iPadOS 15 while the allowed OS version will change to iOS 12/iPadOS 12 and later. For more details, see https://aka.ms/ADE_userless_support.
What you need to do to prepare:
Check your Intune reporting to see what devices or users may be affected. For devices with mobile device management (MDM) go to Devices > All devices and filter by OS. For devices with app protection policies go to Apps > Monitor > App protection status and use the Platform and Platform version columns to filter. Note: There is a current known issue where several columns are missing from the App protection status report. We expect a fix soon.
To manage the supported OS version in your organization, you can use Microsoft Intune controls for both MDM and APP. For more information, please review: Manage operating system versions with Intune – Microsoft Intune | Microsoft Learn.
MC574366 — Plan for Change: Updates to app configuration policy reporting

<30 Days
In early July 2023, as part of our continuing efforts to improve the Microsoft Intune reporting infrastructure, there will be several user interface (UI) changes in the Microsoft Intune admin center for app configuration policy reporting. The following reporting changes will be made for app configuration policies (Apps > App configuration profiles > select a policy for apps on a managed device):
- The User Status summary and the Not applicable device tiles will be removed from the Overview page.
- The User install status report will be removed from under the Monitor section.
- The Status column in the Device install status report will no longer show a “Pending” state.
Note: This is a UI change only, there is currently no change to the corresponding Microsoft Graph APIs.
How this will affect your organization:
If you are using app configuration policy reports, you will need to be aware of the changes outlined above. We recommend using the Device install status report to monitor the policy delivery.
What you need to do to prepare:
Update your documentation as needed, we recommend using the Device install status report to continue monitoring the policy delivery.
Microsoft Purview
MC611732 — Use double-key encryption to protect your most sensitive files and emails in Microsoft 365 Apps

>60 Days
This message is associated with Microsoft 365 Roadmap ID 124984
To protect your most sensitive content, users of Microsoft 365 Apps can now use Double Key Encryption (DKE) for files and emails using the built-in labeling client. With DKE, Microsoft stores one key in Microsoft Azure and you hold the other key, ensuring that only you can ever decrypt protected content, under all circumstances. Sensitivity labels configured with DKE in Microsoft Purview Compliance Portal are now available for users in Word, Excel, PowerPoint, and Outlook to publish or consume content protected with DKE.
When this will happen:
General availability:
- Current channel available mid-July
- Monthly Enterprise channel available early August
- Semi Annual Enterprise Channel early January 2024
How this will affect your organization:
Users who have sensitivity labels configured with DKE will be able to publish and consume DKE-protected content using the built-in labeling client in Word, Excel, PowerPoint, and Outlook.
With this update, organizations that have also enabled “co-authoring for files encrypted with sensitivity labels” can now deploy DKE labels in the same tenant, allowing users to benefit from M365’s collaboration tools even if some of your users require DKE content for some of their documents.
What you need to do to prepare:
If you’re already using DKE with the Azure Information Protection (AIP) add-in, you can now enable co-authoring for encrypted files and start planning your migration to the built-in labeling client before the add-in is retired in April 2024 (https://aka.ms/AIP2MIP/RetireAddin).
If you’ve been considering DKE for your organization, now is the time to plan for DKE in your environment using the built-in labeling client instead of attempting to deploy it through the AIP Add-in. (https://aka.ms/AIP2MIP/HowTo/GetStarted)
MC609873 — Microsoft Purview Data Loss Prevention: Configure policy tips as pop-up dialog for emails with sensitivity labels

30-60 Days
Microsoft 365 Roadmap ID 139511
Microsoft Purview Data Loss Prevention policies can be configured to display policy tips as a pop-up dialog for emails with sensitivity labels.
When this will happen:
Rollout will begin in early August and is expected to be complete by end of August.
How this will affect your organization:
Admins can configure DLP policies to show policy tips as a dialog to end users when they attempt to send email messages that include a sensitivity label on the email or attachment. With this capability, admins can set up rules to warn or block or request for an explicit acknowledgement or a business justification from users before sending emails. Furthermore, admins can customize a learn more URL in a DLP rule, ensuring that end users receive valuable guidance through the popup.
Note: Users included in these policies must hold E5/G5 or equivalent licenses.
What you need to do to prepare:
Configure policy tips for Data Loss Prevention in the Microsoft Purview compliance portal:
Learn more:
MC602593 — (Updated) New Service Endpoint for Applications using Microsoft Purview Information Protection

<30 Days
Updated June 29, 2023: We have determined that this message did not reach the intended audience. Please disregard this message. We apologize for any inconvenience.
We’re adding a new service endpoint for applications that use Microsoft Purview Information Protection labeling in applications and services. This includes applications like Microsoft 365 Apps, the Azure Information Protection client, and any application using the Microsoft Information Protection SDK.
Note: If your organization does not use Microsoft Purview Information Protection labeling policies, you can safely disregard this message.
When this will happen:
This change will be made beginning in late-July.
How this affects your organization:
Network configurations will need to be updated to include the host https://substrate.office.com to ensure that apps and services are able to continue to fetch the labeling policy.
What you need to do to prepare:
If your organization uses Microsoft Purview Information Protection labeling policies, review your current configuration and make changes as needed.
MC600718 — Microsoft Purview Information Protection: Configure Display Colors for Sensitivity Labels – GCCH & DoD

<30 Days
Microsoft 365 Roadmap ID 139362
We’re simplifying the policy management experience and enhancing the user experience for seeing and selecting sensitivity labels within Office apps by enabling display color configuration for labels.
When this will happen:
Standard Release: GCC-H and DoD will begin rolling out in mid-July and it is expected to complete in late July.
How this will affect your organization:
Built-in labeling in Microsoft Word, Excel, and PowerPoint apps (Win 32), and other first- and third-party applications that support reading the color property, will now display a highly visible sensitivity label and provide easy-to-use interface for choosing labels.
This will include label color defined by admins within the Microsoft Purview compliance portal, also supported by a PowerShell advanced setting for a label. To configure label color in the compliance portal, go to label creation in the Information protection left navigation. Then select a color for your parent label in the label creation or edit flow, see below:
What you need to do to prepare:
For built-in labeling to display label colors in Word, Excel, and PowerPoint applications, the label color must first be configured by the admin. You can opt into this preview experience by configuring your label policy to display specific colors for sensitivity labels.
View sensitivity label settings in the Microsoft Purview compliance portal.
Learn more:
MC598630 — Microsoft Purview Data Loss Prevention – DLP Policy tips revamp for Outlook for Windows for E5/G5 users

30-60 Days
Microsoft 365 Roadmap ID 138577
We’re rolling out new and improved DLP Policy tips in Outlook for Windows to support top DLP predicates and exceptions, all advanced classifiers, and override capabilities for E5/G5 users.
When this will happen:
Rollout will begin in early August and is expected to be complete by end of August.
How this will affect your organization:
You can now alert or restrict your users from unauthorized or accidental sharing of any sensitive information via email in Outlook win32 by leveraging new and improved DLP Policy tips in new or existing DLP policies. These real time alerts and recommendations empower your organization to accurately identify sensitive information being shared with unauthorized recipients or domains and take appropriate action.
DLP Policy tips now support a richer set of DLP conditions (and corresponding exceptions), including the following:
- Content Contains Sensitive Information
- Content contains Sensitivity label
- Content is shared internally/externally
- Sender is
- Sender domain is
- Sender is member of
- Recipient is
- Recipient domain is
- Recipient is a member of
- Subject contains words
Additionally, DLP Policy tips now support advanced classifiers like Trainable classifiers, Exact data match (EDM), Named Entities, and Credential scanning SITs, as well as an override feature that gives end users the ability to quickly and easily modify or override policies (if allowed in the DLP rule configuration), ensuring that the sensitive data is always protected, while still allowing end users to work efficiently.
What you need to do to prepare:
You can create new DLP policies or leverage the existing ones to use DLP Policy tips as an additional layer of security for sensitive data.
Get started with Data Loss Prevention in the Microsoft Purview compliance portal:
Learn more:
MC590098 — Records Management eDiscovery (Premium) – Discover the document version that has been shared

<30 Days
Microsoft 365 Roadmap IDs 106099 and 106100
To help you efficiently meet regulatory obligations for retention and eDiscovery of shared content in your organization, we’re rolling out a new Records Management capability that enables you to automatically apply retention labels and retain the version of files shared as cloud attachments or hyperlinks in email via Exchange and chat via Teams. This enables eDiscovery (Premium) to discover the version of the document at the time that it was shared.
When this will happen:
Rollout will begin in late June and is expected to be complete by mid-July.
How this will affect your organization:
Information workers in organizations benefit from quickly sharing cloud attachment files for visibility and collaboration, however this practice has been challenging for eDiscovery and legal professionals who are required to preserve and discover that content. eDiscovery (Premium) now supports the ability to discover the version of the document at the time that it was shared to help ensure that the relevant version of the file is available to eDiscovery processes.
To make this possible, you will now be able to create a retention auto-labeling policy in the Records Management solution, within the Microsoft Purview compliance portal, where you will be able to select the option to include files shared as cloud attachments (live links of SharePoint or OneDrive content shared as attachments or hyperlinks via email or Teams messages).

What you need to do to prepare:
Get started with Records Management and eDiscovery (Premium) in the Microsoft Purview compliance portal:
Learn more:
MC586557 — Microsoft Purview eDiscovery (Premium): Tenant-wide jobs report (preview)

<30 Days
Microsoft 365 Roadmap ID 101525
Coming soon to public preview, we are releasing a tenant-wide jobs report in Microsoft Purview eDiscovery (Premium).
When this will happen:
Rollout to public preview will begin in late June and is expected to be complete by early July.
How this will affect your organization:
Today in our eDiscovery solutions there is a set of jobs related limits. To facilitate eDiscovery administrators to better track all the jobs happening in the tenant and get visibility into the tenant-wide eDiscovery jobs in relation to these limits, we are releasing the jobs report feature to show this information.
In the jobs report, eDiscovery administrators will be able to do the following:
- View all jobs that are in progress or completed (successfully or with error) in a specified time range.
- View all jobs across eDiscovery Standard and Premium solutions.
- View how far away the tenant is from hitting job-related tenant-wide limit.
- View how far tenant is from hitting limit

Insight cards showing how far the tenant is from hitting eDiscovery jobs related limits.

Unified list showing all jobs and their status in the last 30 days.
Important notes:
- Only an eDiscovery Admin can view this tenant wide Report.
- The Jobs report will show all jobs started after the Report is rolled out.
- The report can go back up to a maximum period of 30 days.
What you need to do to prepare:
Assess if the changes will change your organization’s eDiscovery workflow. If so, update internal documentation. Provide training to all eDiscovery users in your organization and update relevant documentation if needed.
Get started with eDiscovery (Premium) in the Microsoft Purview compliance portal:
Learn more: Manage jobs in eDiscovery (Premium)
MC586551 — Microsoft Purview eDiscovery (Premium): Enhancements to Collections query builder

Rolled Out
Microsoft 365 Roadmap ID 100058
We’re rolling out enhancements to the Collections query builder in Microsoft Purview eDiscovery (Premium).
When this will happen:
Rollout began in late May and is expected to be complete by mid-June.
How this will affect your organization:
This rollout introduces updates to the eDiscovery (Premium) query builder experience to add functionality including NOT/OR conditions, grouping, and alignment between Collections and Review query building experiences. This enhancement will help build complex queries from scratch, validate them, and help to ensure correct content is being returned with the query inputs.
What you need to do to prepare:
Assess whether these changes will impact your organization’s eDiscovery workflow, then update internal documentation and provide user training as needed.
Get started with eDiscovery (Premium) in the Microsoft Purview compliance portal:
Learn more: Build search queries in eDiscovery (Premium)
MC578238 — (Updated) Microsoft Purview eDiscovery (Premium) – Enhanced support for Teams video clips

30-60 Days
Microsoft 365 Roadmap IDs 124848 and 124849
Updated June 30, 2023: We have updated the rollout timeline below. Thank you for your patience.
Coming soon to Microsoft Purview eDiscovery (Premium), we’re rolling out enhanced support for Teams video clips.
When this will happen:
Preview: This feature is rolling out to public preview now.
Standard Release: Rollout to general availability will begin in early August (previously late June) and is expected to be complete by late August (previously late July).
How this will affect your organization:
With this update, eDiscovery admins collecting Teams video clips will see the Teams video clip as a separate video recording file attached to the Teams conversation where it was shared. This will enable review and export as mp4 files to help admins better understand the content and context of the video clips.
What you need to do to prepare:
No action is needed to enable this feature update.
Get started with eDiscovery (Premium) in the Microsoft Purview compliance portal:
Learn more: eDiscovery (Premium) workflow for content in Microsoft Teams
MC572514 — (Updated) Microsoft Purview Insider Risk Management: New insider risk analytics capabilities and email notifications

<30 Days
Microsoft 365 Roadmap ID 124966, 124967, 124968, and 124969
Updated June 30, 2023: We have updated the rollout timeline below. Thank you for your patience.
Microsoft Purview Insider Risk Management will be rolling out multiple features to enhance the insider risk analytics capability and allow admins to manage email notifications.
When this will happen:
Rollout will begin in mid-July (previously mid-June) and is expected to be complete by late July (previously late June).
How this will affect your organization:
The following capabilities will soon be generally available within the Insider Risk Management solution:
- Analytics email digest: With this update, admins with appropriate permissions will receive a monthly email summarizing the latest insider risk analytics insights scanned from the environment.
- Recommended thresholds by insider risk analytics: With this update, admins can receive recommended thresholds for insider risk policies, including data leak and data theft by departing employee policies, by leveraging the insights from insider risk analytics. By using these recommended thresholds, admins can improve the effectiveness of your policies and generate an optimal number of alerts.
- Sequence and anomaly detection in insider risk analytics: With this update, insider risk analytics now includes sequence and anomaly detection indicators, providing more comprehensive and effective insights.
- Admin email notifications: Admins can control the types of emails they receive, including a daily notification for newly generated high-severity alerts, or weekly emails summarizing policies with unresolved warnings.
What you need to do to prepare:
No action is needed to enable these features if you have insider risk analytics enabled. Admins with the right permissions can enable insider risk analytics at Insider risk settings > Analytics.
Once this update is rolled out, admins can manage email notifications through the “Admin notifications” section of Insider risk settings, see recommended thresholds in the policy wizard, and see the new insights in insider risk analytics.
Microsoft Purview Insider Risk Management correlates various signals to identify potential malicious or inadvertent insider risks, such as IP theft, data leakage, and security violations. Insider Risk Management enables customers to create policies based on their own internal policies, governance, and organizational requirements. Built with privacy by design, users are pseudonymized by default, and role-based access controls and audit logs are in place to help ensure user-level privacy.
Get started with Insider Risk Management in the Microsoft Purview compliance portal:
Learn more: Insider risk analytics technical documentation
MC560728 — (Updated) Microsoft Purview compliance portal: General availability of new Insider Risk Management capabilities

>60 Days
Microsoft 365 Roadmap IDs: 83966, 93259, 98160, 115492, 115494, 117601, 117602, 117603, 117604, 117607, 117608, 124772, 124775, 124857, 124860, 124861, 124862, 124863, 124864
Updated June 30, 2023: We have updated the rollout timeline below. Thank you for your patience.
Coming soon to general availability, Microsoft Purview Insider Risk Management will be rolling out multiple features including an enhanced alert experience, cumulative exfiltration anomaly detection, sequence detection enhancement, new insider risk indicators, trainable classifier support, and new noise management capabilities.
When this will happen:
Rollout will begin in late July (previously early June) and is expected to be complete by early September (previously late July).
How this will affect your organization:
The following capabilities will soon be generally available within the Insider Risk Management solution:
Enhanced alert triage experience introduces various improvements to the alert review experience to accelerate time to action, including the ability to further drill into detected sequences within activity explorer, add new alert filtering capabilities, and explore the user activity timeline view with a richer alert history.
Policy customization from alert review experience allows admins to customize an Insider Risk Management policy and adjust policy thresholds from within the alert review experience instead of going through the policy configuration wizard, so customization decisions can be made in the context of alert review activities.
Cumulative exfiltration anomaly detection helps identify data exfiltration risks when a user’s exfiltration activities across all egress channels over the past 30 days exceed organization or peer group norms. A risk score is assigned if the user’s cumulative exfiltration activity is unusual compared with others within the same organization or with the same role.
Sequence detection in Insider Risk Management has a few updates:
- Sequence detection can recognize both allowed and unallowed domains, configured by admins with appropriate permissions. Sequences that involve allowed domains will be excluded from being scored, and sequences that involve unallowed domains will receive higher risk scores.
- Sequence detection can be used as a policy trigger. For example, if admins define a sequence such as downloading from a Microsoft 365 location, obfuscating, exfiltrating, then deleting, users who perform the sequence of activities will match the policy and the alert will show up in Insider Risk Management.
- Allows admins to select sequences in data leak and data theft policies without the requirement to select underlying individual indicators. This will allow admins to create more targeted policies with improved alert signals.
New insider risk indicators:
- Increased set of first party indicators will be available in Insider Risk Management, including user activities in Endpoint (Windows 10), Microsoft Teams, Azure Active Directory, SharePoint Online, and Microsoft Defender for Cloud Apps.
- Label downgrading insights can detect users downgrading sensitivity labels on files or SharePoint sites.
- Physical access indicators and connector will allow admins to define priority physical assets. With priority physical assets enabled and the physical badging data connector configured, Insider Risk Management can correlate signals from an organization’s physical control and access systems with other user activities to help make more informed response decisions for alerts.
Trainable classifiers will be supported in Insider Risk Management to recognize various content types specific to your organization.
Noise management capabilities:
- File path exclusions allow admins to configure file path exclusions, so activities around files with specific file paths won’t generate alerts.
- Sensitive information type exclusions allow admins to define sensitive information type exclusions, so files that contain certain sensitive information types won’t generate alerts.
- File type exclusions will extend to email attachments to help reduce noisy signals.
- System noise generated by a single user activity will be de-deduplicated, reducing noise in alerts without losing risk context.
- Site URL and keyword exclusions allow admins to configure SharePoint site URL and keyword exclusions, so activities involving these sites or file names and email subject lines containing certain keywords won’t generate alerts.
Bulk import and export of domains allows admins to upload or download a CSV file of unallowed, allowed, and third-party domains in insider risk settings to fine-tune the detection of activities involving certain domains.
Integration with Communication Compliance: admins with the right permissions can use a Communication Compliance event to configure insider risk policies. This feature helps customers gain more context and identify potentially higher-risk activities that may result in a data security incident such as exfiltration of sensitive information.
What you need to do to prepare:
- To enable cumulative exfiltration activities detection and new insider risk indicators, admins can visit Insider risk settings > policy indicators to choose those new indicators.
- To configure allowed and unallowed domains and all types of exclusions, admins can visit Insider risk settings > intelligent detections.
- To configure physical access indicators, admins will need to set up a connector in the compliance portal to import physical badging data.
- To leverage new indicators and integration with Communication Compliance, admins with the right permissions can visit Policies page to create a new policy or add indicators to existing policies.
- No action is needed to enable other features.
Microsoft Purview Insider Risk Management correlates various signals to identify potential malicious or inadvertent insider risks, such as IP theft, data leakage, and security violations. Insider Risk Management enables customers to create policies based on their own internal policies, governance, and organizational requirements. Built with privacy by design, users are pseudonymized by default, and role-based access controls and audit logs are in place to help ensure user-level privacy.
Get started with Insider Risk Management in the Microsoft Purview compliance portal:
Learn more: Learn about insider risk management
MC552329 — (Updated) Microsoft Purview eDiscovery (Standard) to eDiscovery (Premium) case upgrade tool (preview)

<30 Days
Microsoft 365 Roadmap ID 109542
Updated June 30, 2023: We have updated the rollout timeline below. Thank you for your patience.
Coming soon to public preview, we are releasing a tool to allow eDiscovery administrators to upgrade their existing eDiscovery (Standard) case to eDiscovery (Premium) to unify cases into a single platform.
When this will happen:
Rollout will begin in early July (previously mid-May) and is expected to be complete by late July (previously late May).
How this will affect your organization:
With this tool, an eDiscovery administrator will be able to select a particular case from eDiscovery (Standard) cases list to move to eDiscovery (Premium).
All upgraded cases will have their existing search and hold retained. This upgrade is architected to change the case type and not perform any actual migration of the hold policies. This means no hold is removed and no new hold is re-created in the process. This ensures no data is lost or erased in the migration process.
Note: The case upgrade can be triggered by an eDiscovery Administrator only.

Choosing to upgrade a case from eDiscovery (Standard) to eDiscovery (Premium)
What you need to do to prepare:
Assess if the changes will change your organization’s eDiscovery workflow. If so, update internal documentation and provide training to all eDiscovery users in your organization as needed.
The upgrade is not reversible so please ensure you test this process with a few test cases before proceeding with a mass upgrade.
You can access the eDiscovery (Premium) solution in the Microsoft Purview compliance portal:
Learn more: Microsoft Purview eDiscovery solutions
MC551014 — (Updated) Microsoft Purview eDiscovery (Premium): Review Set – Advanced filters

<30 Days
Microsoft 365 Roadmap ID 124796
Updated June 20, 2023: We have updated the rollout timeline below. Thank you for your patience.
We are excited to introduce several usability enhancements for filtering items in review sets within the eDiscovery (Premium) solution in the Microsoft Purview compliance portal.
When this will happen:
Rollout will begin in late June (previously mid-June) and is expected to be complete by late July (previously mid-July).
How this will affect your organization:
With the new advanced filters feature, admins can do the following:
- quickly search for filter conditions
- create complex filters using either “AND” or “OR” conditions
- easily iterate your queries with undo and redo buttons
- manage saved filters (edit name, delete) without having to navigate to another panel
- use “Is empty/Is not empty” conditions for each filter
What you need to do to prepare:
No action is needed to enable these updates. Once the rollout is complete, you can take advantage of the new grouping options and configurations in your eDiscovery (Premium) review sets. Distribute the relevant documentation to your organization’s eDiscovery admins and managers for a better understanding of the new enhancements.
Get started with eDiscovery (Premium) in the Microsoft Purview compliance portal:
Learn more: Query the content in a review set
MC515536 — (Updated) Microsoft Purview | Data Lifecycle Management and Records Management – Microsoft Graph APIs for extensibility

<30 Days
Microsoft 365 Roadmap ID 88276
Updated June 27, 2023: We have updated the rollout timeline below. Thank you for your patience.
As a part of our extensibility vision and first release to Microsoft Graph, we are introducing three new APIs for retention labels, events, and event types in the Microsoft Graph beta environment. These APIs will enable you to customize and extend on what we have built in the product so far.
These APIs can be used by compliance admins and developers to manage retention labels in Data Lifecycle and Records Management solutions.
When this will happen:
Rollout will begin in late March (previously late February) and is expected to be complete by mid-July (previously late June).
How this will affect your organization:
If your organization needs to automate any operation related to retention labels or events, we recommend you achieve this by using the new Graph APIs instead of using PowerShell cmdlets. With Graph, we use REST APIs that support better security, extensibility, and app authentication features.
The three APIs are available under the security node and the endpoints to access them are as follows:
Entity name
|
Endpoints
|
Solution
|
Labels
|
security/labels/retentionLabels
|
Data Lifecycle, Records Management
|
Events
|
security/triggers/retentionEvents
|
Records Management
|
Event types
|
security/triggerTypes/retentionEventTypes
|
Records Management
|
What you need to do to prepare:
Permissions
Currently, these APIs are supported through delegated permissions only, which are managed through the Graph interface. We are introducing two new permissions which you will need to access these APIs:
- recordsmanagement.read.all
- recordsmanagement.readwrite.all
Licensing
Access to Data Lifecycle Management and Records Management features varies based on your Microsoft 365 license level. See Microsoft 365 guidance for security & compliance – Service Descriptions for licensing requirement details.
Get started with Data Lifecycle Management and Records Management in the Microsoft Purview compliance portal:
Learn more:
MC499443 — Microsoft Purview Data Loss Prevention: Upcoming migration of policy sync engine for Exchange, SharePoint, and OneDrive

Rolled Out
Updated June 12, 2023: We have updated the content below to show as intended. Thank you for your feedback.
We’re making changes to the Microsoft Purview Data Loss Prevention (DLP) Policy Synchronization API as part of an infrastructure upgrade.
Starting May 2023, we will replace and retire the legacy “Policy Sync Version V1” for DLP that applies to Exchange Online, SharePoint, and OneDrive for Business workloads and migrate all DLP policies from the previous “Policy Sync Version V1” to an upgraded “Policy Sync Version V2”.
When this will happen:
Rollout has completed.
How this will affect your organization:
The DLP “Policy Sync Version V2” is a more secure and flexible solution that will enable you to access the latest and upcoming features across the entire Microsoft Purview Information Protection solution. This will be a back-end infrastructure upgrade activity that will be carried out by Microsoft.
Once this change is implemented, admins will see the following changes,
- “Last Modified Timestamp” column as the DLP policies* will be updated per the timestamp when Microsoft will be performing the migration. Changes will be visible in both PowerShell and the Microsoft Purview compliance portal (UX).
- In the Audit Events and Alerts pipeline, a DLP Policy update event performed by a Microsoft Service Account.
*Indicates applicable DLP policies that are scoped to workloads – Exchange Online, SharePoint, OneDrive
What you need to do to prepare:
No action is needed to prepare for this change.
Get started with Information Protection and Data Loss Prevention in the Microsoft Purview compliance portal.
Learn more:
MC382822 — (Updated) Insider Risk Management: General availability of security policy violations templates

TBD
Microsoft 365 Roadmap IDs 83961, 83962, and 83963
Updated June 30, 2023: We have made the decision not to proceed with this rollout as scheduled. We will provide an updated timeline via Message center. Thank you for your patience.
Currently available in public preview (MC289678), we’re releasing additional features for Insider Risk Management that will help detect possible security violations by users including priority and departing users. These features will help enable your organization to detect security violations performed on devices onboarded to your organization using Microsoft Defender for Endpoint alerts.
Microsoft Defender
MC567494 — Microsoft Defender for Identity: Classic portal automatic redirection

Rolled Out
Updated June 7, 2023: We have updated the message to show as intended. Thank you for your patience.
Beginning on June 30, 2023, access to Microsoft Defender for Identity legacy portal at portal.atp.azure.com will be unavailable. Any request will be automatically redirected to Microsoft 365 Defender portal at security.microsoft.com. All new and existing tenants will be automatically redirected to the M365 Defender portal, and the option to opt-out will no longer be available.
When this will happen:
June 30, 2023
How this will affect your organization:
Once the forced redirection takes place, any requests to the standalone Defender for Identity portal (portal.atp.azure.com) will be redirected to Microsoft 365 Defender (securtiy.microsoft.com) along with any direct links to its functionality.
Organizations cannot manually opt-out and disable the setting.
What you need to do to prepare:
Ensure your security teams are familiar with Defender for Identity’s features and settings as they are represented in Microsoft 365 Defender. If your security teams need help, please direct them to the updated documentation available here.
MC549533 — (Updated) Microsoft Defender for Office 365: Priority Account User tags filtering in the URL protection report

<30 Days
Microsoft 365 Roadmap ID 124852
Updated June 20, 2023: We have updated the rollout timeline below. Thank you for your patience.
We are adding a new filter to the URL protection report that will allow security admins to easily filter for Users who are in the Priority Account tag of their organization.
When this will happen:
Standard: we will begin roll out by mid-June (previously early May) and be complete by late June (previously mid-May).
Government: we will begin roll out by late June (previously mid–May) and be complete by early July (previously late May).
How this will affect your organization:
This capability will be extremely valuable in helping security teams prioritize focus on critical individuals within the organization while reviewing the URL threat details in the report.

What you need to do to prepare:
You may consider updating your training and documentation as appropriate.
MC543389 — (Updated) Activity policy – filter by file name

Rolled Out
Updated June 8, 2023: We have updated the information below for clarification.
We will be retiring the ability to filter by ‘select specific file name’ from Microsoft Defender for Cloud Apps; ‘select specific folder will still be available and will not be retired.
When this will happen:
We will begin rolling out this change in mid-May.
What you need to do to prepare:
You are receiving this message because our reporting indicates you may have activity policy using the filter ‘select specific file name’. You can continue using the ‘select folder name’.
Users will no longer be able to use ‘select specific file name’ in activity policy, when this change is implemented.
What you can do to prepare:
You may consider updating your training and documentation as appropriate.
Identity
MC611686 — Introducing Voice One Time Password (OTP)

30-60 Days
Voice calls have proved to be the least secure authentication method; there are far better ways of performing multifactor authentication (MFA), including Microsoft Authenticator (which offers both MFA and Passwordless options), or more secure phishing-resistant methods like Windows Hello for Business and FIDO2 security keys. Although we have encouraged everyone to move away from traditional MFA methods (such as SMS and voice), we understand that some of you are dependent on these methods in order to use MFA. To address this need, we are making an improved version of our voice call method available – introducing “voice one-time password (OTP)”. This method will be combined with the SMS authentication method and as such have two delivery methods (SMS and voice OTP) to allow for delivery method optimization.
When this will happen:
Starting August 2023
How this affects your organization:
Users in your organization who rely on SMS will have this new optimized channel.
What you can do to prepare:
We encourage you to keep recommending users to use the Microsoft Authenticator app to get an even better user experience.
MC584364 — Changes to the Registration campaign feature in Azure AD

<30 Days
Publicly switched telephone networks (PSTN) such as SMS and voice authentication are the weakest forms of MFA. To help your users move away from them we are introducing changes to the Microsoft managed state of the Registration campaign feature in Azure Active Directory.
When this will happen:
July 10, 2023
How this affects your organization:
Starting July 10th, 2023, users in your organization that are relying on SMS and voice for MFA will be prompted to use the Microsoft Authenticator app. They can skip this prompt for a maximum of 3 times, after which registration of the app will be required.
What you can do to prepare:
We urge you to motivate your users to stop using SMS and voice for MFA. However, if some of your users need more time you can exempt them for now. Sign in as Global Administrator or Authentication Policy Administrator and go to Azure AD > Security > Authentication methods > Registration campaign and exclude these users.
MC565271 — (Updated) System preferred MFA method is Generally Available

30-60 Days
Updated June 30, 2023: We have updated the rollout timeline below. Thank you for your patience.
In today’s landscape, organizations and users utilize various authentication methods with varying levels of security. Unfortunately, users often select less secure MFA methods, even when more secure options are available. This may be due to convenience, lack of awareness, or technical limitations.
To encourage the use of the strongest available method, we are introducing system-preferred authentication for MFA. This system prompts users to sign in with the most secure method they’ve registered and the one that’s enabled by admin policy. This transition from choosing a default method to always using the most secure method will promote better security practices. If users can’t use the prompted method, they can choose an alternative MFA method.
When this will happen:
We will begin rolling out in early July (previously late June) and expect to complete by early August (previously late July).
How this will affect your organization:
Microsoft managed will be rolled out as enabled. Admins will have the control to disable the feature.
Admins can enable the feature via the admin UX in the Azure Portal or GraphAPI. For example, if a user named “John Doe” registered both SMS and Microsoft Authenticator and used SMS as the default option to sign in, the system-preferred method (Authenticator) will be presented to the user once the feature is enabled.
We launched this with Microsoft-managed set to disabled. As mentioned above, we will be setting “Microsoft-managed” to enabled from the first week of July 2023. While we highly encourage you to adopt this feature for your entire tenant, should you need to you can either scope the feature for a segment of your user population or disable it if necessary. The feature will ultimately be set to Microsoft-managed (enabled) for all tenants, with no option to disable it.
Deploying this feature with the rollout controls is highly encouraged to enhance security and ensure users always use the most secure authentication method first. The feature is now available from your tenant.
What you need to do to prepare:
We strongly recommend that organizations enable this feature for all their users to improve their security posture.
MC468492 — (Updated) Authenticator number matching to be enabled for all Microsoft Authenticator users

Rolled Out
Updated June 8, 2023: Number matching is now deployed and enabled for all users of the Microsoft Authenticator app!
Additionally, due a change in the Microsoft Authenticator Authentication method policy, the feature configuration of Application Context and Location Context in tenants may have been impacted. End users were not impacted by this change, but if you made an update to these settings before 5/17 to set them to “disabled”, please review your policy. If the policy has been reset to “default” and you’d like to explicitly set the state to be “disabled”, you can leverage the UX or MS Graph API to do so. Note: Tenants who have the policy set to “enabled” were not affected by the change.
Microsoft Authenticator app’s number matching feature has been Generally Available since Nov 2022! If you have not already leveraged the rollout controls (via Azure Portal Admin UX and MSGraph APIs) to smoothly deploy number matching for users of Microsoft Authenticator push notifications, we highly encourage you to do so. We had previously announced that we will remove the admin controls and enforce the number match experience tenant-wide for all users of Microsoft Authenticator push notifications starting February 27, 2023. After listening to customers, we will extend the availability of the rollout controls for a few more weeks. Organizations can continue to use the existing rollout controls until May 8, 2023, to deploy number matching in their organizations. Microsoft services will start enforcing the number matching experience for all users of Microsoft Authenticator push notifications after May 8th, 2023. We will also remove the rollout controls for number matching after that date.
Please note that we have changed the expected behavior for NPS extension to be even more admin friendly. NPS versions 1.2.2216.1+ will be released once Microsoft starts to enable number matching for all Authenticator users. These NPS versions will automatically prefer OTP based sign-ins over traditional push notifications with the Authenticator app. An admin can choose to disable this behavior and fallback to traditional push notifications with Approve/Deny by setting the registry key OVERRIDE_NUMBER_MATCHING_WITH_OTP Value = FALSE. Previous NPS extension versions will not automatically switch Authenticator push notification authentications to OTP based authentications. Please refer to the NPS extension section of the number match documentation for further information.
When this will happen:
Beginning in May 2023.
How this affects your organization:
To prevent accidental approvals, admins can require users to enter a number displayed on the sign-in screen when approving an MFA request in the Microsoft Authenticator app. This feature is critical to protecting against MFA fatigue attacks which are on the rise.
Another way to reduce accidental approvals is to show users additional context in Authenticator notifications. Admins can now selectively choose to enable the following:
- Application context: Show users which application they are signing into.
- Geographic location context: Show users their sign-in location based on the IP address of the device they are signing into.
Number match behavior in different scenarios after May 2023:
- Authentication flows will require users to do number match when using the Microsoft Authenticator app. If the user is using a version of the Authenticator app that doesn’t support number match, their authentication will fail. Please make sure upgrade to the latest version of Microsoft Authenticator (App Store and Google Play Store) to use it for sign-in.
- Self Service Password Reset (SSPR) and combined registration flows will also require number match when users are using the Microsoft Authenticator app.
- ADFS adapter will require number matching on versions of Windows Server that support number matching. On earlier versions, users will continue to see the “Approve/Deny” experience and won’t see number matching till you upgrade.
Windows Server 2022 October 26, 2021—KB5006745 (OS Build 20348.320)
Windows Server 2019 October 19, 2021—KB5006744 (OS Build 17763.2268)
Windows Server 2016 October 12, 2021—KB5006669 (OS Build 14393.4704)
- NPS extension versions beginning 1.2.2131.2 will require users to do number matching after May 2023. Because the NPS extension can’t show a number, the user will be asked to enter a One-Time Passcode (OTP). The user must have an OTP authentication method (e.g. Microsoft Authenticator app, software tokens etc.) registered to see this behavior. If the user doesn’t have an OTP method registered, they’ll continue to get the Approve/Deny experience. You can create a registry key that overrides this behavior and prompts users with Approve/Deny. More information can be found in the number matching documentation.
- Apple Watch – Apple Watch will remain unsupported for number matching. We recommend you uninstall the Microsoft Authenticator Apple Watch app because you have to approve notifications on your phone.
What you can do to prepare:
If customers don’t enable number match for all Microsoft Authenticator push notifications prior to May 8, 2023, users may experience inconsistent sign-ins while the services are rolling out this change. To ensure consistent behavior for all users, we highly recommend you enable number match for Microsoft Authenticator push notifications in advance.
Learn more at:
MC448012 — (Updated) Reminder: Upgrade your applications to use Microsoft Authentication Library

Rolled Out
Updated June 20, 2023: We have updated the timeline for this change to ensure that organizations have enough time to make changes accordingly. Additionally, we have provided additional documentation. Thank you for your patience.
As previously communicated in MC219493 (July ’20), you need to upgrade your applications to use Microsoft Authentication Library (MSAL). We’re no longer adding new features to Azure Active Directory Authentication Library (ADAL) and starting June 30, 2023 (previously June 1, 2023) we will retire ADAL and will no longer provide any technical support or security updates. Instead, we recommend you use MSAL, which is where we will continue to invest. MSAL makes it easy for you to build applications that authenticate users and acquire tokens to access resources.
Note: This retirement was originally scheduled to complete June 30th, 2022 and we have extended the timeline to provide customers with time to make the necessary changes.
Key Points:
- Major: Retirement
- Timing: June 30, 2023 (previously June 1, 2023)
- Action: review and assess
How this affects your organization:
You are receiving this message because our reporting indicates one or more of your applications are using ADAL. Applications using ADAL on existing OS versions will continue to work after June 30, 2023 (previously June 1, 2023) but will not receive any technical support or security updates.
How to prepare for this change:
To update your applications to use Microsoft Authentication Library review our Migrate applications to Microsoft Authentication Library (MSAL) guide.
To learn more, review the Update your applications to use Microsoft Authentication Library and Microsoft Graph API and ADAL End of Support Announcement.
Exchange Online / Microsoft Defender for Office
MC617073 — Reminder: Disabling Remote PowerShell Protocol in Exchange Online for WW

Rolled Out
RPS retirement was planned for June ‘23 as announced in MC488586 (December ’22) and we will turn off the Remote PowerShell (RPS) protocol in your Exchange Online tenant any day now.
As you might already be aware, we made some recent changes to improve the security of your tenant. We announced in December 2022 that we would be retiring RPS in Exchange Online. In April 2023, we disabled RPS for all new tenants and in May 2023, we disabled RPS for tenants who were not using it. In June 2023, we began disabling RPS for tenants that are using it.
If we have not received any extension requests [check below for how you can apply for an extension] from your tenant, we will select your tenant in scope for turning off RPS. In a few days from now, we will disable the RPS protocol for your tenant. Once disabled, any user or application using RPS will be unable to connect to Exchange Online. If you have not migrated to the REST-based V3 module, we highly recommend you move to V3 and remove any RPS dependencies. Please note that if you have already asked for an extension, please ignore this message. Please be aware that this extension is only till September ’23.
What If You Were Not Ready for This Change?
In March, we announced that if you need additional time, you can use our self-service tool and request an extension. This extension will allow you to use RPS till September 30th ’23. If you need to re-enable RPS, you can do so once, following the steps outlined in the announcement link above. Once the additional time has elapsed, RPS will be permanently disabled in your tenant.
What else can I do to prepare for this change?
We recommend you switch to the new REST-based v3 PowerShell module.
If you are using New-PSSession to establish an RPS connection:
- Install the latest released Exchange Online Management v3 module from here.
- Use Connect-ExchangeOnline instead of New-PSSession to establish a connection.
If you have installed any module earlier than v3:
- Uninstall previous versions of ExchangeOnlineManagement module by running “Uninstall-Module ExchangeOnlineManagement” from an elevated (admin) PowerShell command prompt.
- Install the latest released Exchange Online Management v3 module from here.
- Discontinue the use of -UseRPSSession parameter (if you are using it).
If you have questions/concerns about RPS protocol deprecation in Exchange Online, please leave comments here or email us at RPSdeprecation@service.microsoft.com.
Exchange Online Manageability Team
MC617062 — Introducing Schedule Send on Outlook for Android

30-60 Days
Microsoft 365 Roadmap ID 98927
The new Schedule send feature on Outlook for Android allows you to write an email now and send later. To choose when to send, select ‘…’ when writing an email.
Please note that Schedule send is already available on Outlook for iOS.
When will this happen:
We will begin rolling out in early July 2023 and expect to be complete by early August 2023.
How will this affect your organization:
If users select the … menu while writing an email, they will now be able to select the option to “Schedule send”. Once a user has scheduled the sending of an email, the email will show up in their Drafts folder until it is sent.
MC590144 — Microsoft Purview Information Protection moving to AES256-CBC mode for encryption of email and Office files.

>60 Days
Microsoft 365 Roadmap ID 117576
Microsoft Purview Information Protection will begin to use Advanced Encryption Standard (AES) with 256-bit key length in Cipher Block Chaining mode (AES256-CBC) by default for encryption of Office documents and emails. If your organization is part of any of the four groups listed in this post, you must take action to update or opt out of this change.
You can read about this on our Tech Community blog post and learn more in our documentation.
When this will happen:
We will begin rolling out late August 2023 and expect to complete by late September 2023.
How this will affect your organization:
Today, Microsoft Purview Information Protection uses AES128 in electronic codebook mode (AES128-ECB) for protecting Office files and emails. Starting in late August 2023, we will begin to roll out changes to the default, moving to AES256-CBC for files and emails.
This change to the default encryption algorithm will roll out to:
- Microsoft 365 Apps on Current Channel and Monthly-Enterprise Channel.
- SharePoint Online
- Exchange Online and Office 365 Message Encryption
- Azure Information Protection Classify and Protect 2.17 and later
- Azure Information Protection PowerShell Module 2.17 and later
- Microsoft Purview Information Protection Scanner 2.17 and later
When complete, each of these services will generate encrypted files and emails using AES256-CBC. Consumption of AES256-CBC protected files and emails is fully supported across all supported Office clients, and AIP 2.16 or later.
Any applications integrated with Microsoft Information Protection SDK 1.13 or later will support consumption of AES256-CBC protected content.
What you need to do to prepare:
The four impacted groups are organizations:
- Using Microsoft 365 Apps with Exchange Server, or Exchange Server in Hybrid mode.
- With custom line-of-business (LOB) or third-party applications capable of decrypting protected Office files.
- Using Office Perpetual versions like Office 2019, Office 2019, and Office 2021/LTSC.
- Using the Azure Information Protection Viewer, PowerShell, or Scanner.
Members of these groups must act prior to late August 2023. Failure to opt out of the AES256-CBC change or to install the Exchange Server patch will result in Exchange Server failing to decrypt protected emails for delivery to mobile devices, Outlook for Mac, and both Exchange Server eDiscovery and journaling. For full details, please review the Microsoft Tech Community Blog post: https://aka.ms/Purview/CBCBlog
Organizations using Microsoft 365 Apps with Microsoft 365 Services will transition over to protection and consumption of Office documents in CBC mode with no admin intervention.
MC588322 — Retirement of Get-ATPTotalTrafficReport

>60 Days
We will be retiring the feature the Get-ATPTotalTrafficReport cmdlet from Microsoft Defender for Office 365 beginning September 1st, 2023. Instead we recommend the utilization of the Threat protection status report cmdlet, which is where we will continue to invest
Key Points:
Timing: September 1st, 2023
Action: transition from the Get-ATPTotalTrafficReport cmdlet to the Threat protection status report cmdlet (Get-MailTrafficATPReport | Get-MailDetailATPReport)
How this will affect your organization:
You are receiving this message because our reporting indicates your organization may be using the Get-ATPTotalTrafficReport report. Moving forward we recommend using the Threat protection status report cmdlet.
What you need to do to prepare:
Instead of using Get-ATPTotalTrafficReport, we recommend using the Threat protection status report cmdlet. You may consider updating your training and documentation as appropriate.
Additionally, Admins can also use the Get-Mailflowstatusreport along side the Mailflow status report.
MC579609 — S/MIME sensitivity label support natively on Outlook for Windows

<30 Days
Outlook desktop will support S/MIME (Secure/Multipurpose Internet Mail Extensions) sign and encryption as sensitivity label outcome. Customer admins could use set-label advanced setting to define the label to have S/MIME sign or encryption or both, and emails with those labels applied will enforce S/MIME sign and encrypt accordingly, and also it will support content marking of the label.
When this will happen:
Standard Release: We will begin rolling out in mid-July and expect to complete by late July.
How this will affect your organization:
If you have defined S/MIME email labels for your organization, you will see that S/MIME label also available in Outlook on the web to apply. If you do not have any S/MIME labels today, then it will not impact your organization.
What you need to do to prepare:
If you would like to start using S/MIME labels, please refer the admin instructions how to enable S/MIME labels via set-Label cmdlets advanced setting.
MC577356 — (Updated) Microsoft Defender for Office 365: Handling Malicious Intra-Organizational Messages

Rolled Out
Updated June 20, 2023: The rollout for handling intra-organizational messages that contain a malicious URL in Microsoft Defender for Office 365 is complete.
We are updating the handling of intra-organizational messages that contain a malicious URL in Microsoft Defender for Office 365.
When this will happen:
Rollout will begin in early June and is expected to be complete by mid-June.
How this will affect your organization:
Admins will have at least 30 days to opt out of how intra-organizational malicious messages are handled within the anti-spam policy. Admins will also have the opportunity to define handle intra-organizational messages containing malicious or spam-based URLs are handled in their tenant.
Once this rollout is completed, Admins will be able to define how they want to handle malicious or spam-based URLs detected in intra-organizational messages. The initial default behavior will be to take no action on these messages, but the detection will be recorded as it is today. After the opt-out period no less than 30 days, the default behavior will be to quarantine messages that contain high confidence phishing URLs.
If you want to opt-out or opt-in early you can adjust your preferences within the anti-spam policy, more information can be found in Configure spam filter policies. If you do nothing, the policy will default to act on messages containing high confidence phishing URLs once the opt out period ends.
What you need to do to prepare:
You don’t need to do anything, however, if you don’t want to act on intra-organizational messages, you can opt-out by changing the Anti-spam setting to NONE. If you prefer to opt-in to the new behavior now, you can select High Confidence Phishing or one of the other options from the drop down.
MC567498 — (Updated) Outlook on the Web supported browser updates.

>60 Days
Updated June 9, 2023: We have updated the content below to show as intended.
This initial communication is to notify customers that starting in Fall 2023 (September 2023), users using unsupported browsers will be redirected to the light version of Outlook on the web. This will align with the experience with other Microsoft 365 web applications (MC518729 February ’23).
When this will happen:
We’ll be gradually rolling this out to Targeted Release customers in early Fall (September), and the roll out will be completed for Standard release by the end of Fall 2023 (November 2023).
How this will affect your organization:
Once this change rolls out, users in your organization using legacy browsers will be redirected to the light version of Outlook on the web, which only has basic email functions (Learn more about the light version of Outlook).
What you need to do to prepare:
Please check the supported browsers versions and upgrade your organization users’ browsers to make sure they can utilize the full set of features from Outlook on the web.
MC556159 — (Updated) Message List Selection UI updates for Outlook on the Web and New Outlook for Windows

<30 Days
Microsoft 365 Roadmap ID 125905
Updated June 20, 2023: We have updated the rollout timeline below. Thank you for your patience.
In order to save space on the message list in Outlook, we are making an UI update: From “selection circles on the left side of each row” to “Select mode that you have to get into before checkboxes appear“, using a button in the top-right corner of the Message List. Users may have to acclimate themselves to the new Selection user experience.
In addition, mouse+keyboard multi-selection where users hold down Ctrl or Shift will continue to work as before.
When this will happen:
We will begin rolling out in mid-May 2023 and expect to complete rollout by early July 2023 (previously early June).
How this will affect your organization:
This will affect users who do not have “Sender Images” enabled in the Message List. If you have “Sender Images” turned on, hovering over the images will still show the checkboxes, even if you did not get yourself into “Select Mode“. To review if you have “Send image” enabled, go to Settings > Mail > Layout and scroll to “Sender image“.
What you need to do to prepare:
There is nothing to prepare for this change.
MC552788 — (Updated) Outlook: Mandatory labeling pre-compose for iOS

Rolled Out
Microsoft 365 Roadmap ID 109544
Updated June 13, 2023: We have updated the rollout timeline below. Thank you for your patience.
We have listened customer feedback on Outlook mobile needing to meet the mission of “On the Go” and for organizations to have mandatory labeling enabled without default labeling and would like to have the label selection first before going to compose the email. When the users click “Send”, the email could just be sent without any forgotten labeling pop ups. Outlook mobile will introduce a new MDM setting to allow admins to enable this louder mandatory configuration for Outlook mobile clients (iOS and Android) specifically. We will enable Android first in early Q1 of 2023, and iOS will release in Q2 of 2023.
This release will include supporting the new sensitivity bar below the subject line as well as support label colors.
When this will happen:
Outlook iOS Standard Release: We will begin rolling out early May and expect to complete by late June (previously early June).
How this will affect your organization:
- If your organization has a prompter mandatory label experience pre-compose, make sure you enable mandatory label for specific users, and then set Intune MDM setting “com.microsoft.outlook.Mail.LouderMandatoryLabelEnabled” to be “true”, then the applied users will see the select label page first before drafting the email when the user start new email.
- If your organization has set Label policy -AdvancedSettings @{HideBarByDefault=”False”}, on Outlook mobile you will see the label selection now is below the subject line. If you do not set that value or set it to be True, Sensitivity label will still bel under compose.
- Outlook Android will also support label colors if admin configured so.
What you need to do to prepare:
If you do not want the prompt mandatory UX or the new sensitivity bar, you do not need configure any setting for it. The default new UX will be off.
MC550035 — (Updated) Microsoft Defender for Office 365: Enabling malware filter bypass for SecOps Mailboxes

>60 Days
Microsoft 365 Roadmap ID 124818
Updated June 20, 2023: We have updated the rollout timeline below. Thank you for your patience.
We are adding the ability for security admins and security operations (SecOps) teams to triage messages with malware verdicts for their own review and analysis. This update enables malware filter bypass on messages delivered to configured SecOps mailboxes in the advanced delivery policy.
When this will happen:
We will begin rolling out in early August (previously mid-June) and complete by early September (previously late June).
How this will affect your organization:
Security admins can now review messages with malware verdicts delivered to configured SecOps mailboxes in the advanced delivery policy. With this update, messages with malware verdicts will be delivered for any existing or newly configured mailboxes.
What you need to do to prepare:
Please review configured SecOps mailboxes in the advanced delivery policy to add or remove any mailboxes. No additional actions are required to enable this update.
Learn more about how to the configure advanced delivery policy: Configure the delivery of third-party phishing simulations to users and unfiltered messages to SecOps mailboxes – Office 365 | Microsoft Learn
MC545904 — (Updated) Web links in Outlook for Windows to open side-by-side with email in Microsoft Edge; Teams experience to follow

>60 Days
Updated June 20, 2023: We have updated the rollout timeline below. Thank you for your patience.
To help increase productivity while working online, web links from Azure Active Directory (AAD) accounts and Microsoft (MSA) accounts in the Outlook for Windows app will open in Microsoft Edge in a single view showing the opened link side-by-side with the email it came from. The web link will open in Microsoft Edge as a new tab, and the email will open next to it in the Edge sidebar, so users can easily reference the opened link and the email side-by-side without switching back and forth between apps.
Note: Web links from all accounts in the Outlook for Windows app will open in Microsoft Edge with this change, but the side-by-side experience will not be available for non-AAD or non-MSA accounts at this time.
Note: This change does not affect the default browser setting in Windows.
In the future, a similar experience will arrive in Teams, with web links from chats opening side-by-side with those chats in Microsoft Edge. The policy described below will manage the change across both apps and the chosen policy option will apply to both apps.
When will this affect your organization:
- Timing:
- Outlook for Windows:
- Current Channel: No sooner than 30 days after the original date of this communication
- Monthly Enterprise Channel (MEC): No sooner than July 2023
- Semi-Annual Enterprise Channel
- Preview: No sooner than September 2023
- General Availability: No sooner than January 2024
- Teams: This change will happen at a future date and will be preceded by a separate communication notifying you of its timeline.
- Action:
How this will affect your organization:
Web links from emails in the Outlook for Windows app will open side-by-side with the email in Microsoft Edge so users can easily reference the link and email without switching back and forth between apps. The email will open in the Outlook app in the Edge sidebar. Links will open in Microsoft Edge even if it is not the system default browser in Windows.
- Only links set to open via a web browser are affected. Links that are set to open in a client app or within Outlook itself will continue to do so.
- User experiences will vary by policy configuration; please see the next section.
- Web links from all accounts in the Outlook for Windows app will open in Microsoft Edge, but the side-by-side experience is not available for non-AAD or non-MSA accounts at this time.
Teams will not receive the change at this time.
What you need to do to prepare:
To manage this change, you will need to configure the Choose which browser opens web links policy within 30-days of this communication. You will be able to configure this policy at any point.
The Choose which browser opens web links policy is available today using the Cloud Policy service for Microsoft 365 (formerly known as the Office Cloud Policy Service). The policy will also be available in the upcoming release of the Administrative Templates for Microsoft 365 Apps (scheduled for release on April 21, 2023).
- To open web links from the Outlook for Windows app using the system default browser (current default behavior): Enable the policy and select “System default browser” from the policy options.
- Users will not be able to disable or change this setting.
- To open web links from the Outlook for Windows app using Microsoft Edge (future default behavior): Enable the policy and select “Microsoft Edge” from the policy options.
- Users will not be able to disable or change this setting.
- Users will receive a notification of this change on the first occurrence.
- To allow users to manage the change: Disable the policy or leave the policy unconfigured. Please note that the future default behavior for web links will be to open in Microsoft Edge.
- Users will see a notification informing them of this change on the first occurrence. This notification provides users with the option to learn more about the change, accept it, or to manage the change. An example of the user notification experience is provided below.
- The user’s selection will also apply to the experience in Teams once it arrives.
- Users may manage this setting at any time in the Outlook for Windows app via File > Options > Advanced > Link Handling. When the experience in Teams arrives, users will also be able to manage this setting within the Teams app.
Update: If your organization uses a Microsoft 365 for business plan, your users will need to manage this change individually. They can either click “Manage my settings” in the Edge notification banner when the experience first opens, or they can manage the change through the Outlook settings menu: File > Options > Advanced > Link Handling.
Note: This policy manages the change in the Outlook for Windows app and will also manage the change in Teams when it arrives–however you choose to configure the policy will apply to both applications.
Additional Information
We always value feedback and questions from our customers. Please feel free to submit either feedback or questions via Message Center.
MC542834 — (Updated) Enhancements in Threat Explorer by Microsoft Defender for Office 365

Rolled Out
Updated June 7, 2023: We have updated the rollout timeline below. Thank you for your patience.
With the recent Threat Explorer V3 rolled out changes in user experience, we have also added 15 new filters in threat explorer filters section. The filters have been grouped into different categories: Basic, Advanced, URLs, Files, and Authentication.
- Basic filters are comprised of basic criteria, such as, subject, sender, and recipient.
- Advanced filters include more complex criteria such as NetworkMessadeID, Sender IP, and Attachment SHA256.
- URL filters focus on URLs or domains associated with threats or attacks.
- File filters relate to attachments like file name and type that may be linked to a threat.
- Authentication filters can identify DMARC, DKIM, SPF authentication results.
When this will happen:
Public Preview: We will begin rolling out in mid-April and expect to complete rollout by mid-June (previously late May).
How this will affect your organization:
Apart from filters, the new enhancements also include customizable exports and end-user clicks data in Threat Explorer.
Newly added filters are:

Customizable exports:
The Threat Explorer export feature permits users to export supplementary data beyond what is visible on the data grid. With the latest export feature, users can now choose to export only the relevant data that meets their needs or is pertinent to their analysis or investigation, thus avoiding the hassle of sorting through irrelevant data. The new feature includes a set of basic fields that offer essential email metadata as pre-selected options, and users can add more fields or modify the existing selection based on their specific requirements. It will be available across all tabs in Threat Explorer, including All Email, Malware, Phish, Campaign, Content Malware and URL Clicks.
End user clicks data in Threat Explorer:
The new URL clicks tab in Threat Explorer allows analysts to see end-user clicks across Email, Teams, and Office apps in a single location. The new tab also features the export functionality allowing security analysts to download the result set into a csv file for further analysis if required.
This new tab provides security analysts with a guided tool for investigating and analyzing potentially malicious URLs that have been clicked by users within an organization with the Top clicks and Top targeted users tabs. The Top clicks tab displays the URLs that have been clicked the most by users within the organization, how many have been blocked and how many have been allowed if they are clean or as per the user settings. The “Top targeted users” tab displays the users who have clicked on the most URLs within the organization. This information will help the security analysts identify potential high-risk users who may be more susceptible to phishing or other types of attacks.
URL clicks tab will help in identify potential threats and vulnerabilities, enabling security teams to take proactive measures to protect the systems data and the end users from malicious attacks. By analyzing this information, security analysts can identify potential phishing attempts or other malicious activity that may be targeting users within the organization. This can help security teams take proactive measures to protect their systems and users from these threats.
What you need to do to prepare:
There is no action required from you at this time.
MC522572 — (Updated) Microsoft Defender for Office 365: Introducing the new Post-delivery Activities Report

Rolled Out
Microsoft 365 Roadmap ID 117516
Updated June 8, 2023: We have updated the rollout timeline below. Thank you for your patience.
The new Post-delivery activities report will provide you with information on all things Zero Hour Auto-Purge (ZAP). From the report, you can view messages that were initially delivered but were later moved due to a threat.
When this will happen:
Standard Release: We will begin rolling this out in early March and expect to complete rollout by late June (previously late May).
How this will affect your organization:
The new report will display all the ZAP events that occurred in your organization. If the verdict assigned to a message has been changed, the new report will display this updated data, making it easier to investigate the messages.
You can find the Post-delivery activities report under Email & collaboration reports.
What you need to do to prepare:
You may want to consider updating your training and documentation as appropriate.
You can review the following resources to learn more:
MC519232 — (Updated) Attack Simulation and Training- Update to predicted compromise rate metric for tenant payloads

<30 Days
Updated June 13, 2023: We have updated the rollout timeline below. Thank you for your patience.
Attack Simulation Training under Microsoft Defender for Office is an intelligent phish risk reduction tool that measures behavior change and automates the deployment of an integrated security awareness training program across an organization. One of the most crucial elements in running a phishing simulation is the right selection of payload, to drive the right user behavior.
A core metric that can be used towards payload efficacy is predicted compromise rate (PCR) that predicts the percentage of people who will be compromised by this simulation (users compromised / total number of users who receive the simulation).
As part of this update, we are introducing an intelligent machine learning driven mechanism to predict a more accurate potential compromise rate if the payload was used within a simulation.
As part of this change, there will be 2 updates:
- Updates to the PCR values for global payloads available within Content library -> Global payloads:
- Introduction of an on-demand PCR calculation experience:
As part of the payload authoring experience, you can create your payload content and use the PCR machine learning model to determine the efficacy of your payload. This will be an addition to the existing experience and does not impact existing payload authoring experience.
When this will happen:
We plan to do a staggered rollout in following phases:
- Updates to global payloads will start to roll out from 3rd week of February, and are expected to complete by mid-April – Complete
- The on-demand PCR calculation for English language payloads will start to roll out from 1st week of March, and is expected to complete by end-April – Complete
- The on-demand PCR calculation for non-English language payloads will start to roll out from 2nd week of April, and is expected to complete by late July (previously late June)
How this will affect your organization:
As part of this update, you will see minor changes in the PCR value for payloads. You will also see a mechanism to calculate PCR values as part of your payload authoring experience. There are no changes to your simulation, training workflows or content library.
There is no impact to the end users within your organizations, and only updates the experience for admins with access to Attack Simulation and Training experience.
MC488586 — (Updated) Announcing Retirement of Remote PowerShell (RPS) protocol in Exchange Online PowerShell

<30 Days
Updated June 13, 2023: We have updated the rollout timeline below. Thank you for your patience.
You might already be aware that we made REST-based Exchange Online PowerShell v3 module generally available in September 2022 (read more here: Exchange Online PowerShell V3 Module General Availability). We will now be retiring RPS protocol from the beginning of June 2023. Instead, we recommend the utilization of the v3 module, which is where we will continue to invest our development resources.
When this will happen:
We’ll be gradually rolling this out to customers in early June 2023, and the roll out will be completed by late July (previously late June).
How this will affect your organization:
You are receiving this message because our reporting indicates your organization may be using this RPS through New-PSSession or through Exchange Online PS v1 and v2 modules.
The users will no longer be able to use RPS protocol, when this change is implemented.
What you need to do to prepare:
If you are using RPS to establish an Exchange Online connection, you will not be able to do so after July 1, 2023. If you use the following, then you are using RPS:
- Connection using New-PSSession
- Exchange Online PowerShell v1 and v2 modules
- Any newer version of Exchange Online PowerShell module with the -UseRPSSession parameter
To switch to the v3 module and use REST cmdlets, take the following steps:
If you are using New-PSSession to establish an RPS connection:
- Install the latest Exchange Online Management v3 module from here: ExchangeOnlineManagement 3.0.0.
- Use Connect-ExchangeOnline instead of New-PSSession to establish connection.
If you have installed any module earlier than v3:
- Uninstall previous versions of ExchangeOnlineManagement module by running “Uninstall-Module ExchangeOnlineManagement” from an elevated (admin) PowerShell command prompt.
- Install the latest Exchange Online Management v3 module from here: ExchangeOnlineManagement 3.0.0.
- Discontinue the use of -UseRPSSession parameter (if you are using it.)
We are excited about providing you with a more secure and performant environment, and we remain committed to our journey to empower you with the most modern features and tools. If you have questions/concerns, please leave comments here or email us directly at RPSdeprecation@service.microsoft.com
MC455516 — (Updated) Automatic migration of legacy Office 365 Message Encryption to Microsoft Purview Message Encryption

>60 Days
Updated June 30, 2023: After retirement, any encrypted mail sent to shared mailbox protected with Microsoft Purview Message Encryption will have a link that can open the mail in Outlook on the web. This provides an equivalent flow to open messages protected using Office 365 Message Encryption.
As a reminder, the following PowerShell cmdlet parameter will be retired in New/Set-Transport rule cmdlet:
-ApplyOME
-RemoveOME
Note: If you use the Exchange Admin Center to create/modify a mail flow rule, the action will fail with a message to indicate the above functions have been retired.
Microsoft Purview Message Encryption will replace and retire the legacy Office 365 Message Encryption (OME) in the Exchange admin center. If you don’t do anything, Microsoft will process all mail flow rules that currently applies OME protection to Microsoft Purview Message Encryption protection. With this change, recipients will receive a much more customizable notification mail.
Retirement of OMEv1 is coming in 2 phases
- on June 30th OMEv1 mail flow rules become read-only or delete-only. No new rules or rule modifications will be allowed. These rules will be encrypt/decrypt with OMEv1
- One Dec 31 the OME v1 mail flow rules will be fully retired. All the OMEv1 rules will be automatcially process as OMEv2
For customers who need an exception to do OMEv1 mail flow rule updates between June 30th and Dec 31st, open a support ticket to request the exception.
Finally, we recommend all customers that use OMEv1 to receive email into a shared mailbox we highly recommend requesting the exception. We are targeting to release additional changes in Q3CY23 that will improve the shared mailbox experience.
How this will affect your organization:
Microsoft Purview Message Encryption is a more secure and flexible solution to provide encrypted mail to anyone inside or outside your organization, with an enhanced user experience for recipients. For example, with OME, all recipients receive an HTML attachment to open an encrypted mail. This has been greatly improved with Outlook clients for Microsoft 365 users who can now view the message inline. Non-Microsoft 365 users will instead receive a linked-based experience to open the mail. Additionally, supported attachments are also encrypted on download to protect sensitive data at rest.
The behavioral differences and different types of recipients are described in the following table.
|
Currently OME mail flows
|
Deprecated OME mail flows
|
Mail body branding
|
“Office 365 Message Encryption”
|
“Microsoft Purview Message Encryption”
|
Internal M365 recipients experience
|
Any client will contain an html attachment, open the attachment to open mail in OME portal.
|
Supported Outlook client with inline experience with a message.rpmsg. Any unsupported client will show notification mail with URL link to open mail in Outlook on the Web. (This is also true for users on Exchange on-premises mailbox.”
|
External M365 recipients experience
|
Any client will contain an html attachment, open the attachment to open mail in OME portal.
|
Any client will show notification mail with URL link to open mail in Microsoft Purview encrypted message portal; there is no attachment in mail. Mail flow rules can be modified to provide same behavior as internal recipients above.**
|
(External) Non-M365 recipients experience
|
Any client will contain an html attachment, open the attachment to open mail in OME portal.
After mail is opened in the portal, mail and attachment can be viewed. All attachments are downloaded without encryption
|
Any client will show notification mail with URL link to open mail in Microsoft Purview encrypted message portal; there is no attachment in mail. After mail is opened in the portal, mail and attachment can be viewed. Office documents are downloaded with encryption if no changes are made by admins.*
|
*The encrypted attachments provide extra security by protecting the stored file at rest. Applications that can open Office documents may not be compatible with RMS protected Office documents. Admins can provide the same behavior as OME by enabling a global configuration to download Encrypt-only attachments without encryption: Set-IrmConfiguration – DecryptAttachmentForEncryptOnly $true
**By modifying existing the mail flow rules to apply Purview Message Encryption protection, external M365 recipients will receive encrypted mail containing a message.rpmsg attachment and supported Outlook clients can provide show the mail content directly in the application.
What you need to do to prepare:
If you want to compare the behavior before the deprecation, you can modify and test the changes with your mail flow rules by following the steps outlined in this documentation: Define mail flow rules to use Microsoft Purview Message Encryption
Learn more: How Microsoft Purview Message Encryption works
Microsoft 365
MC617069 — Stream (Classic) Retirement and Migration Tool for GCC Customers

>365 Days
This message is associated with Microsoft 365 Roadmap ID 144573
Stream (Classic) will retire for GCC customers on July 30, 2024. The successor service Stream (on SharePoint) is currently available for all customers. See the Stream (Classic) retirement timeline for important dates in the retirement process.
A critical step to begin adopting Stream (on SharePoint) is to migrate video content to it. The Stream migration tool will become available for GCC customers on July 30, 2023. The tool has been designed to help admins move content from Stream (Classic) to Stream (on SharePoint) as there is no auto-migration within Stream (Classic). Content that is not migrated by July 30, 2024, will be deleted and will not be recoverable. Admins can access the tool by logging on to the Stream Admin Center and then navigating to Stream Migration > Migration tool.
When this will happen:
We will begin rolling out the migration tool to GCC customers on July 20, 2023, and expect to complete rollout by July 30, 2023.
How this will affect your organization:
As part of the Stream (Classic) retirement process we are introducing two default date settings which admins can delay using the Stream (Classic) admin center.
How to delay the change that will block users from uploading to Stream (Classic):
- Beginning October 30, 2023 GCC users will be blocked from uploading content to Stream (Classic) unless you take action to delay this change. You can delay this change to as late as January 30, 2024, after which videos will start saving to Stream (on SharePoint) by default. You can access the setting by navigating to the Stream (Classic) Admin center > Stream Migration > Settings. Under “Save videos to Stream (on SharePoint)” change the “Scheduled for” to your desired date. For more information, please visit this page.
- After the “scheduled for” date, users who attempt to upload to Stream (Classic) will see only the option to upload to Stream (on SharePoint). Users who click on this option will be redirected to the Stream start page (Stream.Office.com) where they can upload to Stream (on SharePoint).
How to delay the change that will block users from accessing Stream (Classic):
- Beginning March 30, 2024, users will no longer be able to access or use Stream (Classic) unless you take action to delay this change. You can delay this change until July 30, 2024, after which your users will not be able to access Stream (Classic). You can access this setting by navigating to the Stream (Classic) Admin center > Stream Migration > Settings. Under “Disable Stream (Classic) for users” change the “Scheduled for” date to your desired date.
- The date you enter in the “Scheduled for” box will be the date that end users lose access to Stream (Classic). Note: Admins will retain access Stream (Classic) and the migration tool until Stream (Classic) end of life or July 30, 2024. For more information, please visit this page.
What you need to do to prepare:
We recommend that you consider taking these actions:
- Begin planning your video content migration. While Stream (Classic) will be available for GCC customers until July 30,2024, we plan to retire some functionality sooner than that date.
- View the Stream (Classic) retirement timeline for GCC customers to see the important dates in the retirement process.
- Delay default service retirement date settings if needed.
- Start the migration planning by analyzing your Stream (Classic) videos via the inventory report.
- See the migration tool release notes for updates on when new features will be added and when bugs will be fixed. This migration tool information applies to both GCC and non-GCC customers.
See the documentation below to familiarize yourself with the migration process:
MC617059 — Introducing New Feature in Project Online

30-60 Days
In 2019, we introduced Project for the Web, a versatile project service designed to streamline project management and collaboration. Since then, we have been continuously improving and expanding the capabilities of this product. We are excited to share that we have recently added several new features that will further enhance your project management experience. To encourage users to explore Project for the Web, we have added a few promotional elements within Project Online, enabling users to access the service using their existing project licenses.
When this will happen:
Standard Release: We will begin rolling out early July 2023 and expect to complete by early August.
How this will affect your organization:
End users of your organization using project online will see banners promoting project for the web. No other functionality will be affected.
We understand that some SharePoint site admins may prefer not to display promotional elements related to Project for the Web to their users. To address this, we have provided an option for admins to disable these elements. Simply uncheck the “Turn on exploration” setting located by clicking the settings icon (gear icon) and then choosing PWA settings > Additional Server settings > Project for the web Discovery on or before July 24th. This will ensure that your users will not be prompted to try Project for the Web. You may turn this On/Off at any time you prefer.
Please be aware that if the Project for the Web service is already disabled for your tenant, this new feature will have no impact on your existing setup. You can continue using Project Online as you have been doing without any interruptions.
What you need to do to prepare:
You need not do anything for this change. We have provided an option for admins to disable these elements. Simply uncheck the “Turn on exploration” setting located in Settings > Additional Server settings > Project for the web Discovery on or before June 30th. This will ensure that your users will not be prompted to try Project for the Web.
MC609884 — Microsoft Graph Connectors in GCCH

30-60 Days
Microsoft Search indexes all your Microsoft 365 data to make it searchable for users. With Microsoft Graph connectors, your organization can index third-party data so that it appears in Microsoft Search results. This feature expands the types of content sources that are searchable in your Microsoft 365 productivity apps and the broader Microsoft ecosystem. The third-party data can be hosted on-premises or in the public or private clouds. To ensure you have access to this capability, our engineering team will conduct a service plan backfill.
When this will happen:
Rollout of the Graph Connectors Search with Index service plan will begin in late July and is expected to be complete by late August.
How this will affect your organization:
As a tenant administrator, you can navigate to Search & intelligence in Microsoft 365 admin center and configure connections to third party data sources you want to index using Microsoft Graph Connectors. Once indexed, you can create verticals and result types to customize Search experience in Microsoft Search surfaces like Microsoft Bing, Office.com and SharePoint Online. After that, end users in your organization can try searching for the enabled third-party content from their devices.
Licenses being updated with this service plan backfill:
- Microsoft 365 GCC G5
- E5 Graph Connector
- Topics Graph Connector
What you need to do to prepare:
MC604883 — Important features soon enabled for your tenant to support health and security

30-60 Days
Starting in July, you will be one step closer to modernizing your update management and improving your security posture with a servicing profile. Both Inventory and Apps health within the Apps admin center will be enabled. Inventory gives you insights on devices that are behind on updates and are more likely to have increased security vulnerabilities. Apps health insights give you visibility into issues your end users might be running into.
Upcoming Changes:
To provide you with the option to use a servicing profile in the future, the Inventory and Apps health features will be enabled. Use these features to explore the following:
- Update currency insights (what devices are out of support)
- Add-ins that your users have installed in your environment
- Version spread (fewer is better)
- App performance and reliability
- App currency and advisories
- …and much more!
Learn about these insights at Inventory in the Microsoft 365 Apps admin center and Apps health in Microsoft 365 Apps admin center or through video here.
When this will happen:
We will begin rolling this out beginning in late July and expect to complete by early August.
How this will affect your organization:
While these new insights require no changes to your current Microsoft 365 Apps configuration, it equips you with the prerequisites to leverage the Microsoft 365 Apps admin center to its fullest potential and stay secure.
It is critical for all companies, large and small, to maximize their protection against cyber threats. One required step to achieving this is to ensure your devices have the latest updates for Microsoft 365 Apps at the earliest. That is why we continuously work with IT admins like you to help streamline Microsoft 365 Apps update management with automation while still maintaining complete control. Automation delivers consistent and predictable updates of Microsoft 365 Apps for all your users. You can enable this automation and customize it via our servicing profile experience in Microsoft 365 Apps admin center.
What you can do to prepare:
You can use the following resources to learn more:
Videos:
Articles:
MC590113 — Microsoft Purview compliance portal: Auditing for Microsoft Project, Planner and Microsoft To Do

Rolled Out
Microsoft 365 Roadmap ID 124916
To provide customers with further support to investigate incidents, suspicious activity and/or malicious changes within their organization, auditing of user and app activities for Microsoft Project, Microsoft Planner and Microsoft To Do will be available in the Microsoft Purview compliance portal as well as in all tenants and regions where Project, Planner and To Do are supported. Auditing* captures events such as plan and task creation, plan and task read, plan and task modifications, and more. For full details of activities captured, see:
*NOTE: The audit events for Project, Planner and To Do require a paid Project Plan 1 license (or higher) in addition to relevant Microsoft 365 license that includes entitlements to Audit (Premium).
Planner, Project and To Do events can be searched from:

When this will happen:
Standard Release: This is currently rolling out and expected to complete by late June.
How this will affect your organization:
Identify data risks and manage regulatory compliance requirements while using Project, Planner, and To Do with audit log retention and access to crucial events that help determine scope of compromise.
What you need to do to prepare:
Auditing is turned on by default and to ensure your organization has turned on auditing, see Turn auditing on or off – Microsoft Purview (compliance) | Microsoft Learn.
MC586564 — Present a Local File From PowerPoint app to PowerPoint Live in Teams

<30 Days
Microsoft 365 Roadmap ID 117477
The “Present in Teams” button in the PowerPoint app has been extended to the PowerPoint files that are not stored in Microsoft 365 Clouds.
You can now use the “Present in Teams” button in the PowerPoint for Window app to present via PowerPoint Live in your Teams meetings, even if your file is not stored in Microsoft 365 Clouds. This is a new PowerPoint Live entry point for those files, in addition to the “Browse my computer” button in Teams Share tray. Clicking the “Present in Teams” button first leads you to the Save As dialog to store the file to the Microsoft 365 Cloud. Once the file is saved, we’ll automatically trigger PowerPoint Live to present your file in your current Teams meeting.
This update is only available currently to the PowerPoint app for Windows and is not available in the Mac app yet.
When this will happen:
Standard Release: We will begin rollout in early July in Current Channel and expect the rollout to be complete by late July.
All other channels will see this feature once they catch up on the update.
How this will affect your organization:
The user in your organization can use the “Present in Teams” button in PowerPoint, even when they are working on a file that is not stored in Microsoft 365 clouds, to present the deck to the current Teams meeting. After selecting Present in Teams, the user will be asked to save the file to Microsoft Cloud before being able to present the file in Teams.


What you need to do to prepare:
There is no action required from you at this time. Please inform your users about this extension.
MC560724 — (Updated) Text Predictions for OneNote on Windows

30-60 Days
Microsoft 365 Roadmap ID 124909
Updated June 27, 2023: We have updated the rollout timeline below. Thank you for your patience.
When this update rolls out, users will see text predictions when writing documents in English in OneNote on Windows. When they see the suggested text, users can accept with the tab or right arrow key or simply keep typing to ignore.
When this will happen:
We will begin rolling out in mid-July (previously late June) and expect to complete rollout by mid-August (previously late July).
How this will affect your organization:
Text predictions are ON by default and users can disable them as needed. To disable in OneNote on Windows, go to File -> Option -> Advanced -> Editing and switch off Show text predictions while typing.
Disabling this feature in OneNote will not affect other Microsoft apps, such as Word or Outlook.
What you need to do to prepare:
Text predictions is considered a Microsoft 365 connected experience. This feature can be managed through admin policy.
You may want to notify your users about this new capability and update your training and documentation as appropriate.
For more information, please visit this page.
MC555190 — (Updated) Microsoft To Do Web app Available for GCCH and DoD customers

30-60 Days
Microsoft 365 Roadmap ID 124891
Updated June 13, 2023: We have provided additional information below. Thank you for your patience.
Microsoft To Do Web app will be released for GCCH and DoD customers. Please note that Microsoft To Do will be replacing the legacy tasks module in Outlook for Web.
When this will happen:
We will begin rollout in early June and aim to be completely rolled out by late June. The toggle for switching between legacy tasks and To Do experience will be available in Outlook Web app until mid-August 2023.
How this will affect your organization:
If applicable, users will get a toggle to transition back to the legacy tasks experience. This toggle will only be available for one month, post which To Do Web will be the only tasks experience in Outlook for Web.
Users can leverage the following URLs to utilize To Do Web:
What you need to do to prepare:
You may want to update your internal documentation. Please note, shared lists outside of your organization will not be possible. At the same time, users will not receive shared list notifications.
MC477852 — (Updated) Modern Commenting Experience Coming to Whiteboard

Rolled Out
Microsoft 365 Roadmap ID: 98083
Updated June 20, 2023: We have updated the content below for accuracy. Thank you for your patience.
With comments you can share your thoughts, celebrate with your teammates, or just have a conversation in Microsoft Whiteboard.
When this will happen:
Rollout will begin in late April (previously late January) and is expected to be complete by mid-June (previously late May).
How this will affect your organization:
Your users would have the following experiences:
- The ability to add comments on a whiteboard to aid in discussion with board participants.
Note: The commenting experience initially will not be supported for the Android and IOS apps. We eventually plan to bring this experience to mobile as well.
What you need to do to prepare:
There is no action required at this time. Continue checking the Microsoft Whiteboard Blog and support pages on details about upcoming features and how best to use them.
MC452253 — (Updated) Announcing the New Look of Office for the Web

>60 Days
Microsoft 365 Roadmap ID 87307
Updated June 20, 2023: We have updated the rollout timeline below. Thank you for your patience.
We are excited to announce a new look in Office for the Web. We’ve changed the visuals to give you a clean modern look to help you focus, but nothing has moved. We will start flighting at this date.
When this will happen:
Standard Release: We will begin rolling out early August (previously early May) and expect to complete rollout by early October (previously late June).
How this will affect your organization:
People will notice the look and feel changes and might have questions if commands moved. We have not moved location of commands nor changed any icons. Functionality and how you use things will not be affected.
What you need to do to prepare:
There is no action required from you at this time. We recommend sending this link to your organization for more information and updating any relevant training materials as necessary.
Microsoft 365 IP and URL Endpoint Updates
|
Documentation – Office 365 IP Address and URL web service
June 29, 2023 – GCC
June 29, 2023 – GCC High
June 29, 2023 – DOD
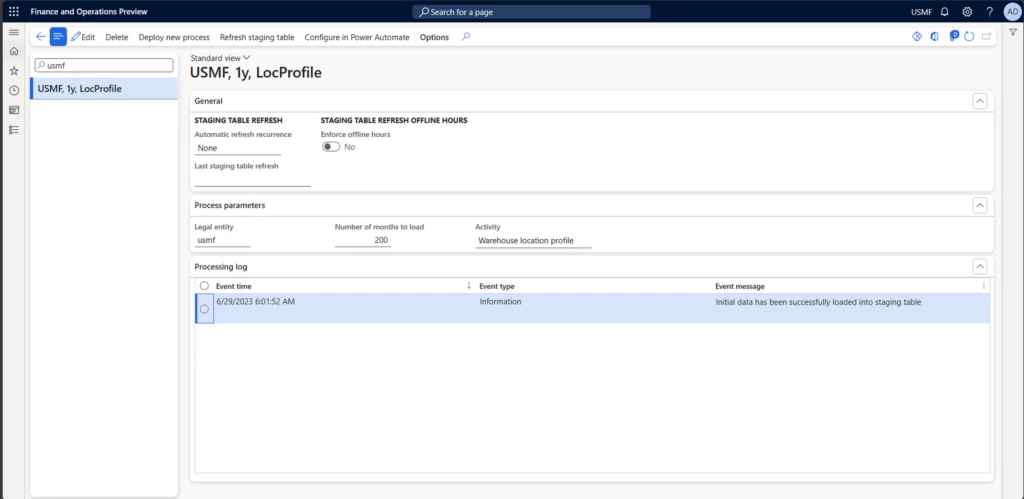
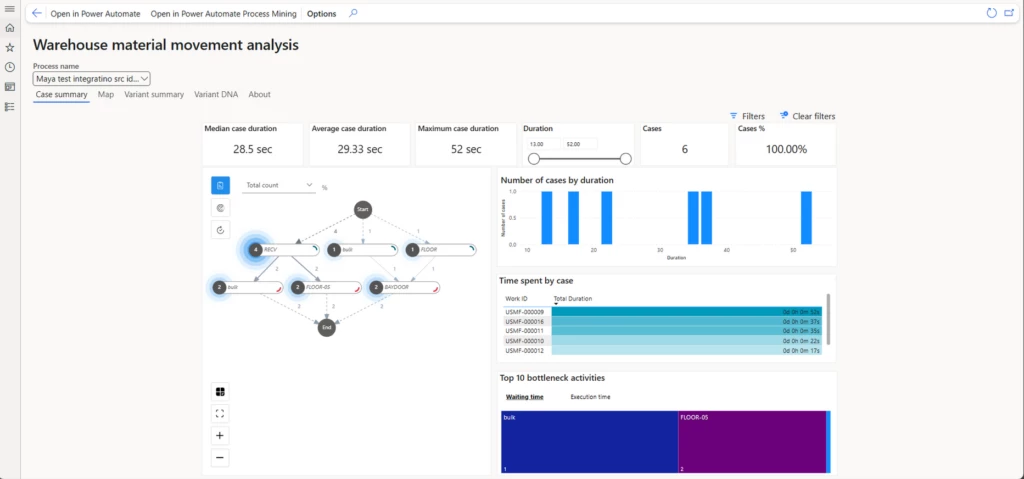
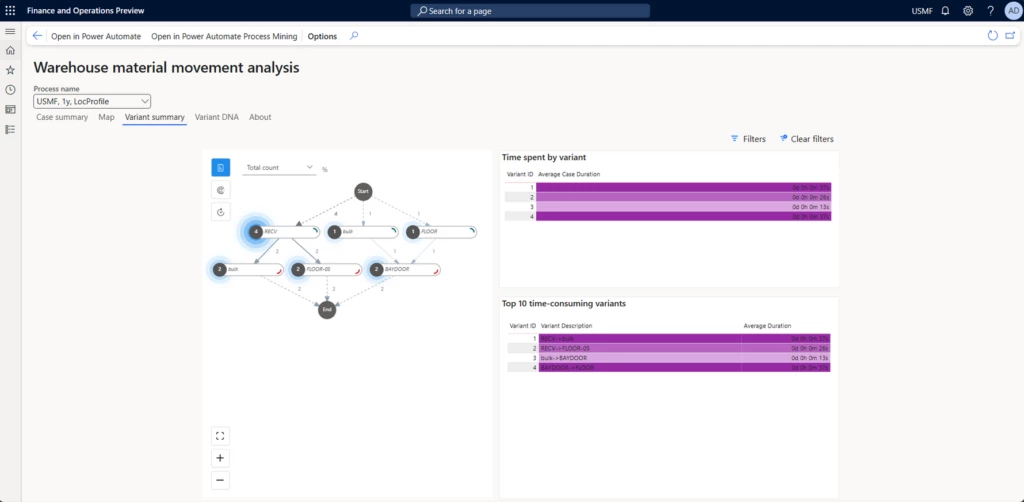
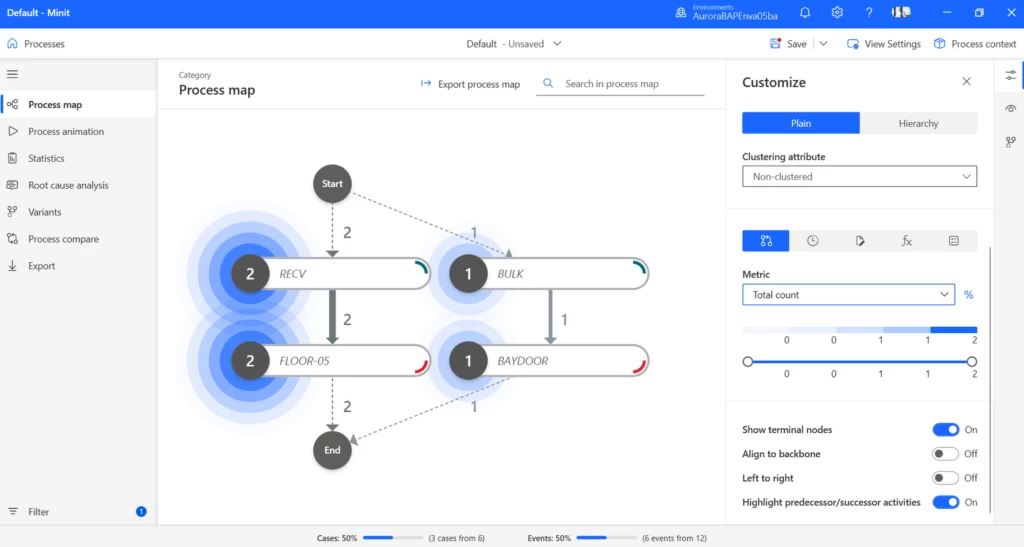
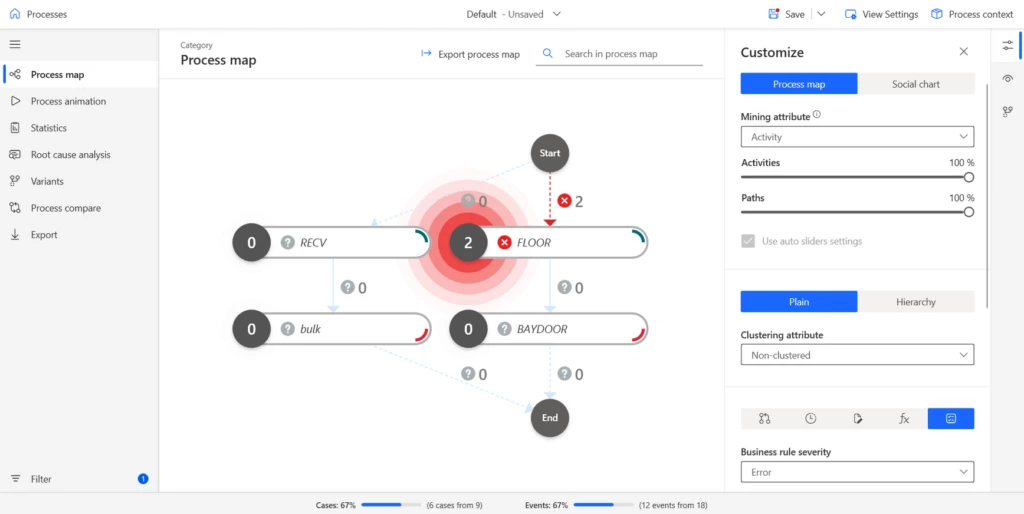
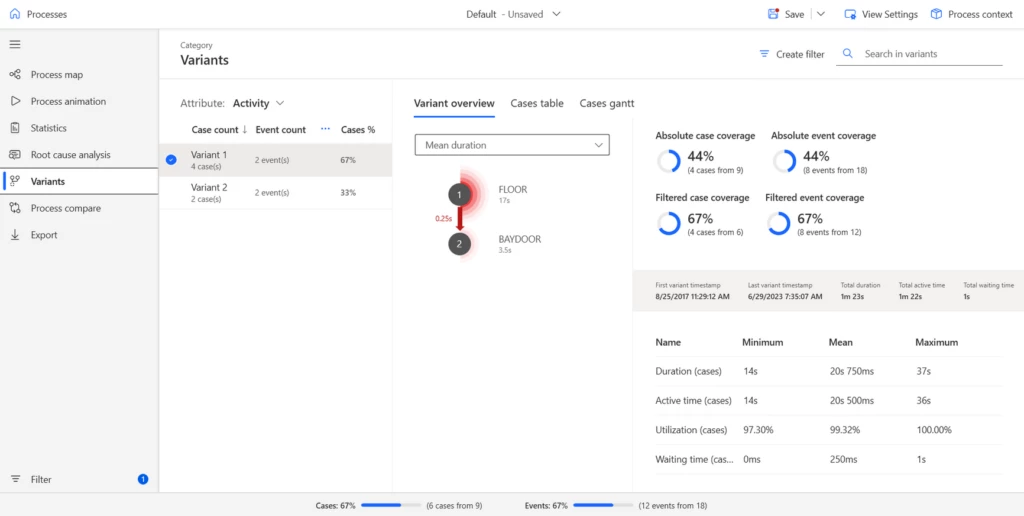
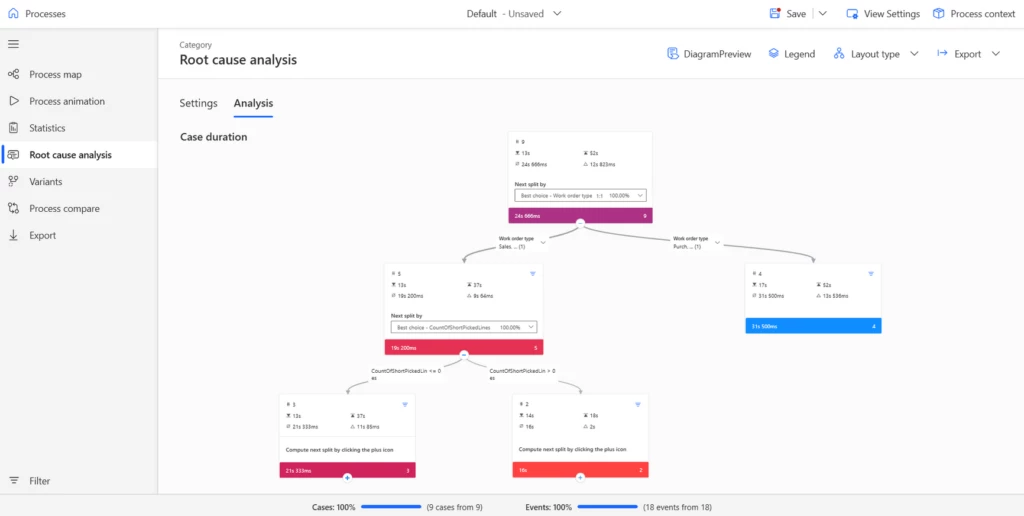
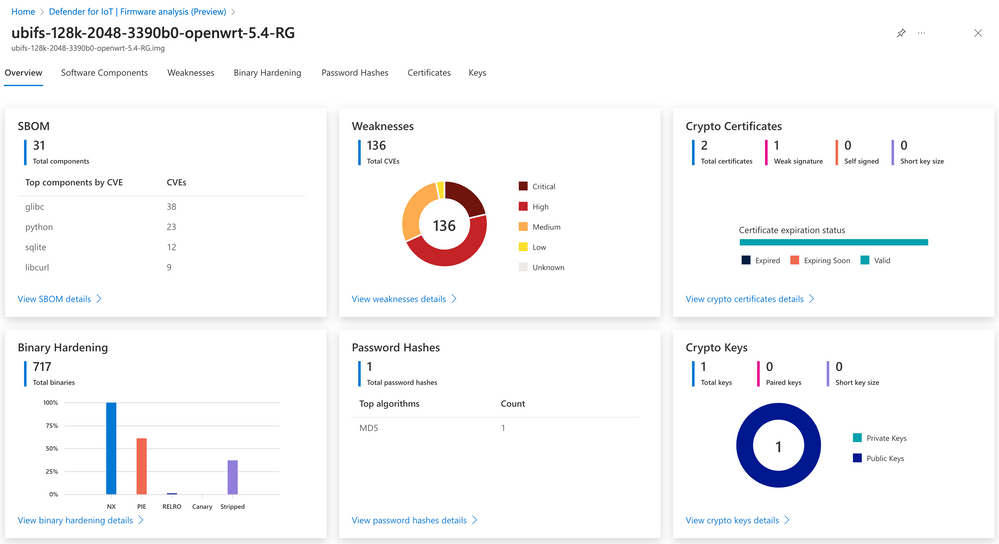


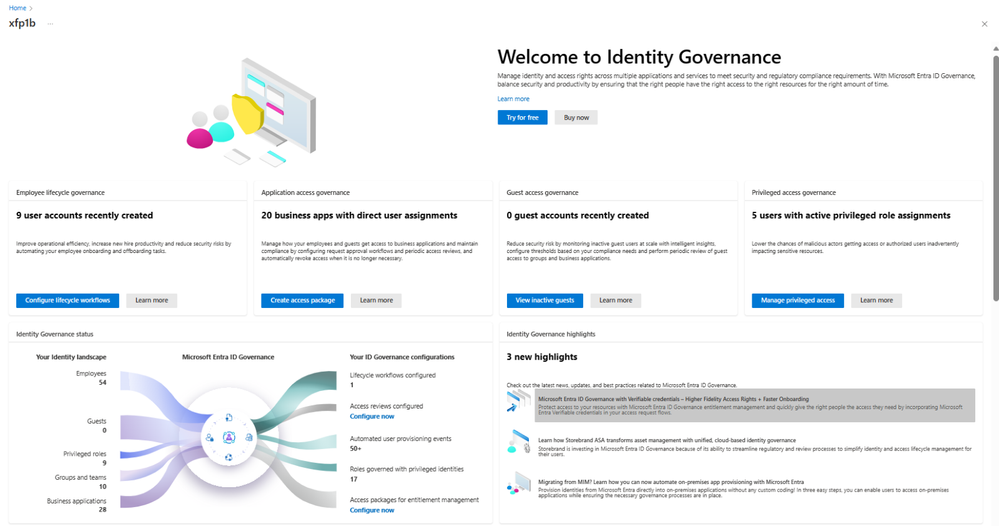

.png")

Recent Comments