This article is contributed. See the original author and article here.
As a seller, you know you need to focus on building relationships with your customers and getting the details you need to close the deal. The challenge is that like most sellers, you spend less than 30% of your time selling.[1] Most of your day goes to searching for information and administrative duties like composing emails and keeping your CRM system up to date. You need more from your technology—and we delivered. In February, we introduced the world’s first AI copilot in CRM with the launch of Microsoft Dynamics 365 Copilot. And today, we’re announcing Microsoft Sales Copilot, a role-based copilot designed to improve sales productivity by empowering sellers with the data and insights they need, when and where they’re needed, allowing them to focus on what they do best—selling.
Sales Copilot brings new capabilities to Microsoft Outlook, Teams, and Dynamics 365 Sales, helping sellers to increase their productivity and personalize every customer interaction. And it works out of the box—not just with Dynamics 365 Sales, but with Salesforce, too.
The following Sales Copilot capabilities are now available for preview[2]:
AI-generated lead and opportunity summaries to streamline your sales process and close deals faster
A customer meeting preparation summary view that includes auto-generated summaries of previous meetings, recent notes, highlights of issues and concerns, and CRM information
Real-time tips and suggested answers during Teams meetings, prompted by the customer’s mention of a competitor or brand
Customer email summary and follow-up, with contextual replies and actions based on Outlook emails and CRM data
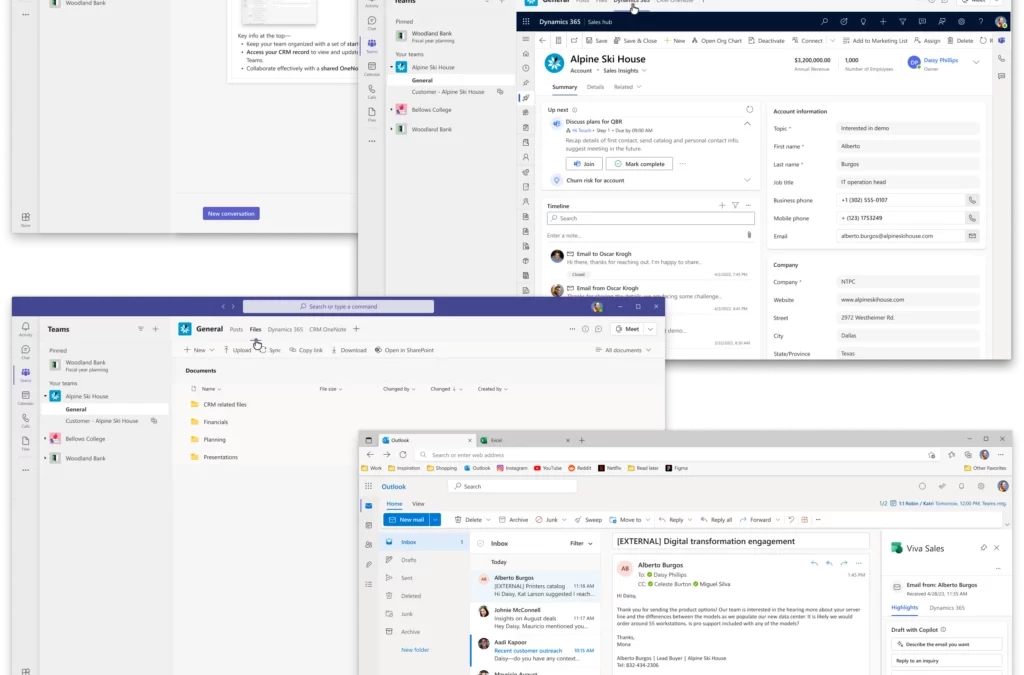
Additionally, we recently announced the general availability of collaboration spaces in Sales Copilot. Collaboration spaces in Teams can easily be created from Sales Copilot in Outlook to help sellers stay better connected with their customers and colleagues.
Watch this brief video to learn how Microsoft Sales Copilot can help you improve your sales productivity:
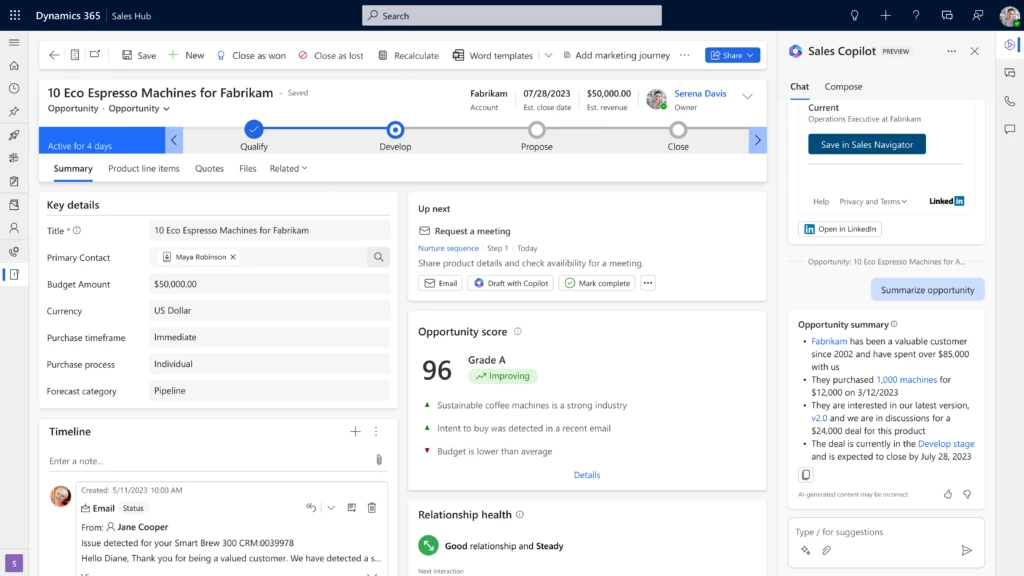
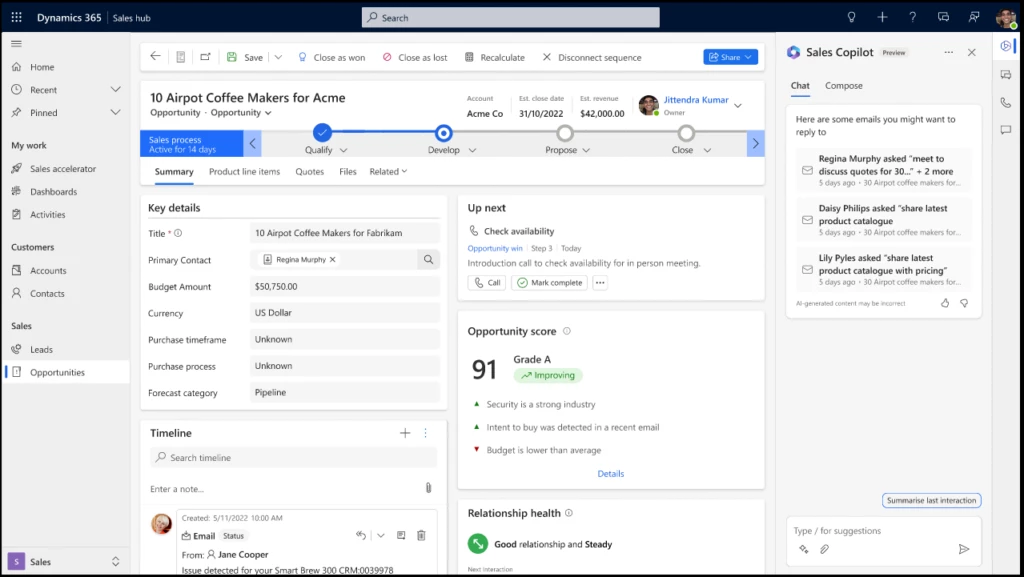
Sales Copilot uses generative AI to quickly summarize leads and opportunities for you. An opportunity summary is a concise overview of the status, progress, and potential of a prospective sale or deal. A “catch up” section highlights key updates since the last visit. An opportunity summary is also available in Outlook, where sellers can view a brief background of the opportunity and the latest activities.
Opportunity summary in Dynamics 365 Sales
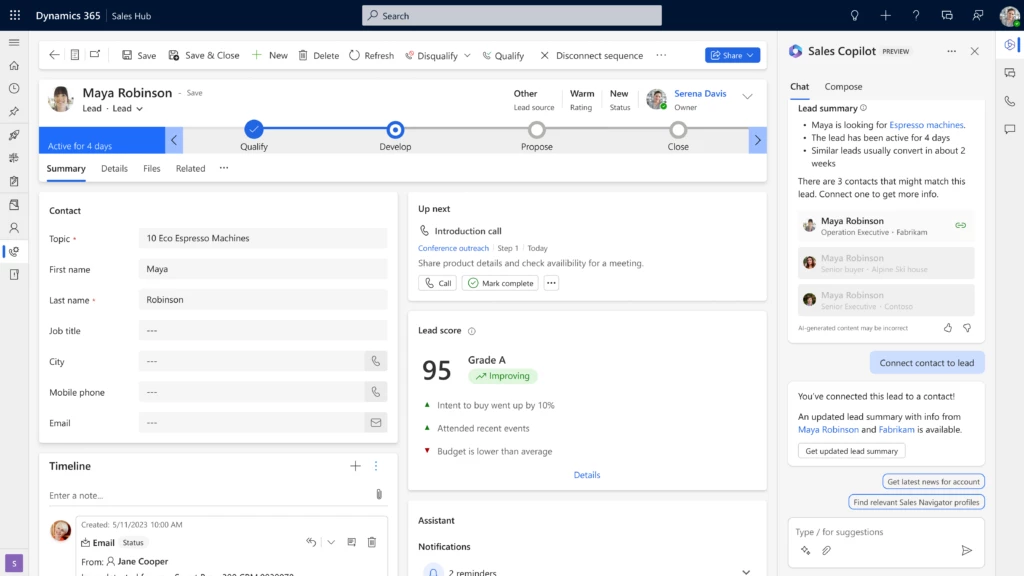
Similarly, a lead summary gives sellers an overview that seamlessly combines data from multiple sources, such as CRM information, contact profiles from LinkedIn[3], and the latest news from Bing to expedite the lead qualification process.
Lead summary in Dynamics 365 Sales
Meeting preparation and summaries
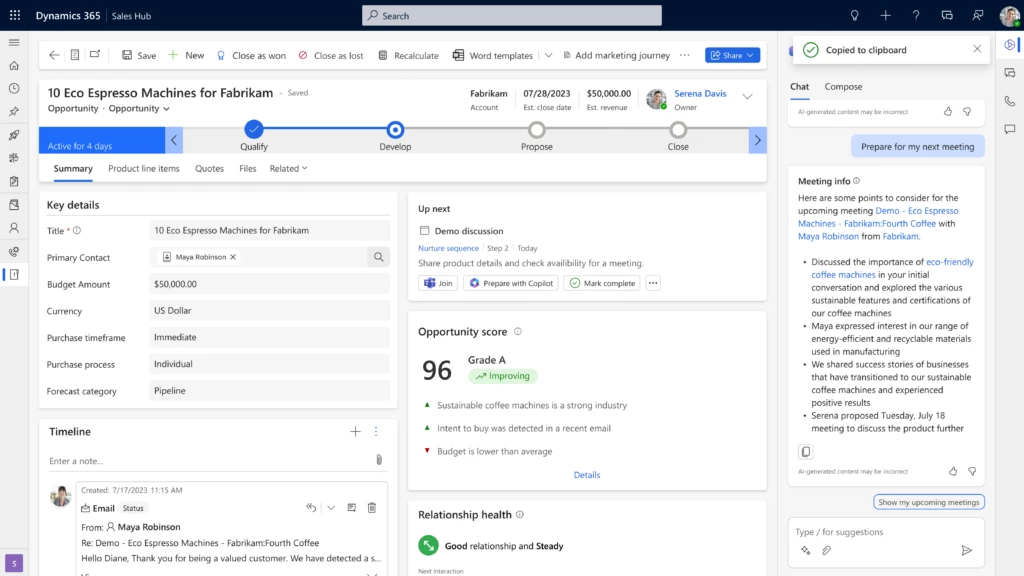
Being prepared for customer meetings is vital for sales productivity. It facilitates informed decision-making and fosters productive discussions, ultimately yielding improved sales outcomes. Sales Copilot detects meetings coming up in the next 24 hours and offers a summary of recent email exchanges and the last three seller notes to help you prepare.
Meeting preparation in Dynamics 365 Sales
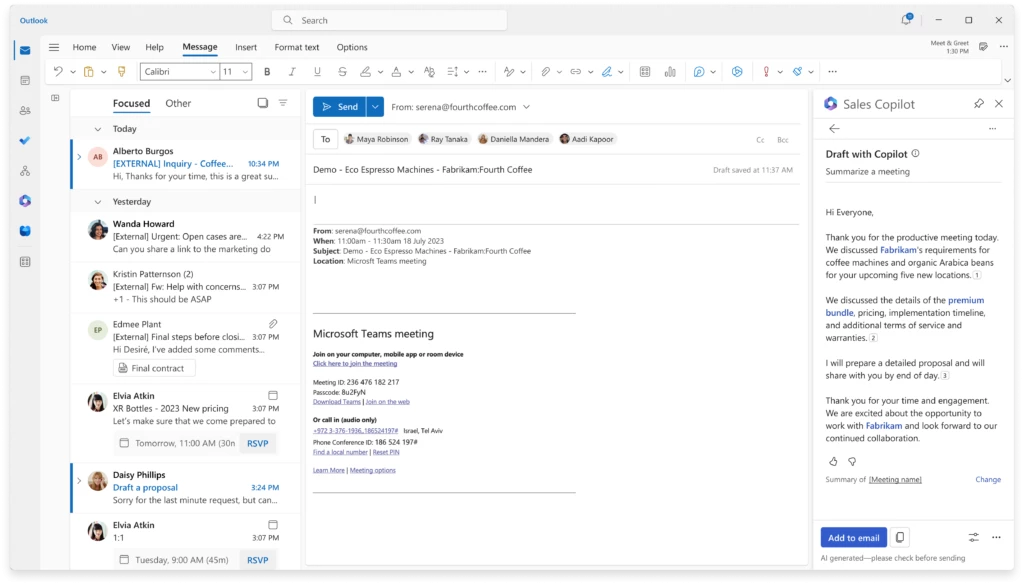
After the meeting, Sales Copilot in both Outlook and Dynamics 365 Sales generates a professional and friendly meeting summary email, making follow-up as easy as clicking a button.
Meeting summary in Outlook email
Real-time tips in Teams meetings
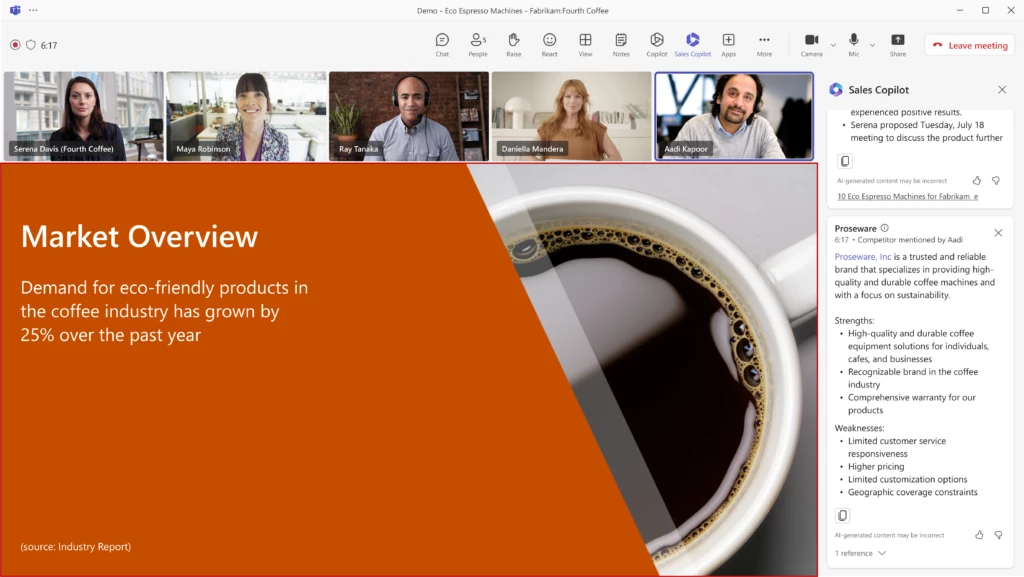
In Teams, sellers receive real-time coaching tips (currently in private preview) during meetings right in the Sales Copilot Teams panel, to help them respond to customer inquiries and competitor or brand mentions. It’s easier to overcome objections and demonstrate that you’re knowledgeable and prepared when the information you need is right in front of you.
Competitor mentioned tip during Teams meeting
Summary, follow-up, and contextual emails
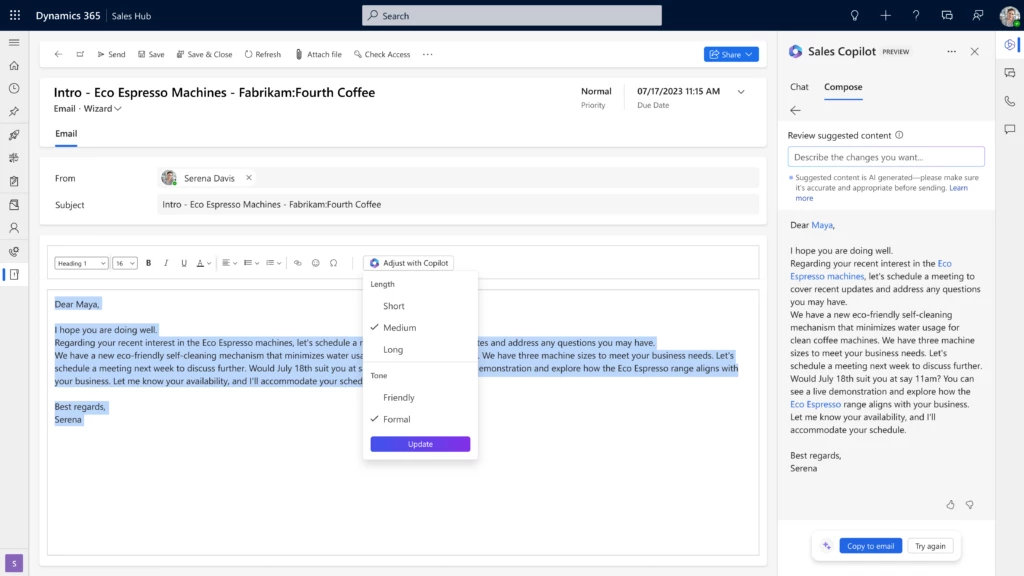
Sales Copilot lets you spend less time composing email. Select a pre-defined category or enter your own text, and Sales Copilot suggests content with specific prompts and actions informed by Outlook and CRM data, helping sellers quickly follow up, reply to inquiries, and move deals forward. Adjust the tone and length of the message to better resonate with your customers, fostering stronger connections. You can further customize the suggested content before you send it.
Contextual email reply in Dynamics 365 Sales
Sales Copilot is equally invaluable on the receiving end, summarizing lengthy email threads when you respond to incoming messages and enabling you to save the summary to your CRM with one click. By condensing complex discussions, it streamlines the communication process and ensures comprehension. It also helps to keep you on track by identifying action items and key customer requests in your incoming emails that you might have missed. It continuously monitors your inbox so you don’t have to.
Contextual email follow-up in Dynamics 365 Sales
Collaboration spaces
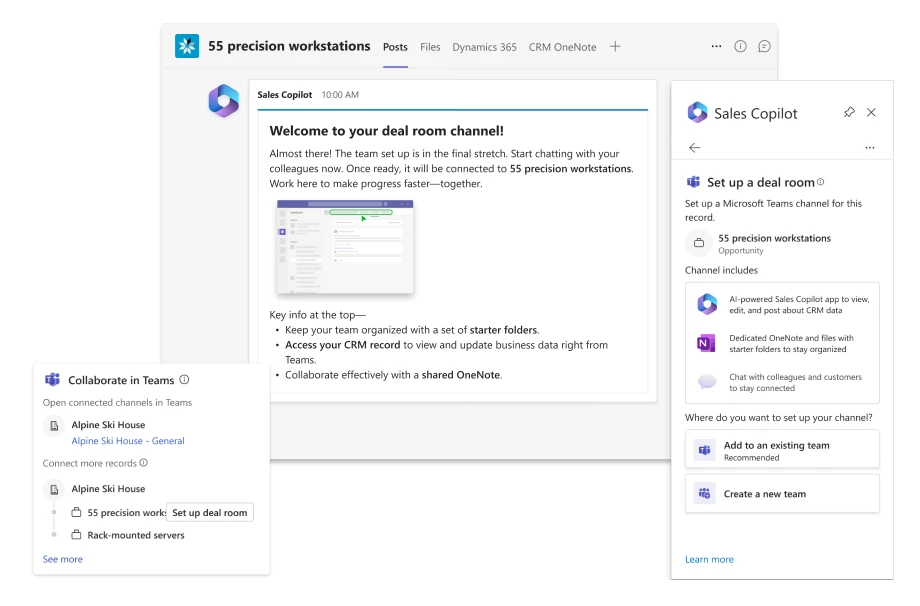
Sellers can easily work with colleagues and customers in collaboration spaces—predefined Teams channels with pinned apps designed for collaboration. Collaboration spaces link to your CRM system and are accessible from Teams, the Sales Copilot app in Outlook, and Dynamics 365 Sales. Learn more about collaboration spaces.
Collaboration space in Teams
Responsible AI
Microsoft is committed to investing in features that reduce or eliminate unsafe output from generative AI capabilities in products like Sales Copilot.
Sales Copilot inherits your organization’s security, compliance, and privacy policies and enforces two-factor authentication, making Sales Copilot a tool you can trust.
Because we know that data leakage is a concern for our customers, as it is for us, the language models that underlie Sales Copilot aren’t trained on and don’t learn from your company’s business, tenant, or individual data. Sales Copilot is part of the Azure ecosystem and employs the same safeguards, compliance boundaries, and enterprise-grade security.
Microsoft copilot AI adheres to our commitment to responsible AI. Engineering teams at Microsoft are continuously working to address issues such as misinformation and disinformation, content blocking, data safety, and promotion of harmful content, guided always by our responsible AI principles.
Users have access to specific guidance that helps to reinforce the responsible use of generative AI content. For instance, we provide guidance and prompts through informational elements that instruct the user:
How to responsibly use suggested content and actions, including prompts
How to review and edit responses as needed
How to manually check facts, data, and text for accuracy
Sales Copilot also cites public sources wherever relevant, so the user can easily find the web content it references.
More innovations to transform the customer experience
In addition to Sales Copilot, we’re announcing copilot innovations across Dynamics 365 to empower organizations to deliver exceptional experiences throughout their customer journeys.
We’re adding copilot capabilities to the newly unified Dynamics 365 Customer Insights and continuing our innovations in real-time marketing. Along with the copilot capabilities that are in public preview (Content Ideas, Query Assist, and Dialogue with Data), soon you’ll be able to use natural language to orchestrate customer journeys as well as style emails, forms, and event registration pages to match your brand guidelines.
Dynamics 365 Commerce Copilot can craft compelling, persuasive, and engaging content for product listings for online commerce, with an aim to drive discoverability and conversion. It allows merchandisers to optimize for search engines while tailoring the content for their customers, brand, and voice.
Next steps
Try Microsoft Sales Copilot today to see how it can improve your sales productivity by enabling sellers to engage with customers more effectively and close more deals faster.
This article is contributed. See the original author and article here.
Microsoft partners like Connecting Software and Varonis deliver transact-capable offers, which allow you to purchase directly from Azure Marketplace. Learn about these offers below:
CB Dynamics 365 to SharePoint Permissions Replicator: This solution from Connecting Software secures your Microsoft Dynamics 365 CRM documents stored in SharePoint. It covers full security roles, logic support, business unit hierarchy, sharing, cascading behavior, position-based hierarchy, and more.
CB Exchange Server Sync: CB Exchange Server Sync from Connecting Software synchronizes and migrates data between different servers, domains, and versions of Microsoft Exchange and Outlook. It’s ideal for large companies that need to manage shared resources across separate business units.
CB Seamless Attachment Extractor for Dynamics 365: Documents and attachments that harm CRM performance and undermine its functionality often take up most of the space used. Save valuable Microsoft Dynamics 365 database space by automatically moving attachments to alternative storage.
Varonis: Find, Monitor, and Protect Sensitive Data: Varonis is a data security platform that protects data with low-touch, accurate security outcomes by classifying more data, revoking permissions, enforcing policies, and triggering alerts for the Varonis incident response team to review on your behalf.
This article is contributed. See the original author and article here.
Recently, I encountered an intriguing scenario where our customer needed to dynamically create views based on multiple tables, allowing them to efficiently filter and aggregate data. The challenge arose when dealing with varying amounts of data, which required careful consideration for performance optimization. Through this article, I would like to share my insights and present a stored procedure that offers additional options to address this dynamic view creation requirement effectively.
Script Overview: The “SearchAndView” stored procedure accepts several input parameters that define the behavior and structure of the dynamic view to be created. Let’s take a closer look at each parameter and its significance:
1. @SearchField: This parameter specifies the field on which the search operation will be performed within the tables. If provided, the dynamic view will only include rows that match the given criteria.
2. @SearchText: This parameter holds the search text that will be matched against the @SearchField. It complements the search functionality and allows for targeted data retrieval.
3. @TableList: This parameter contains a comma-separated list of tables from which data will be retrieved and combined in the dynamic view. By specifying the desired tables, users can tailor the view to their specific needs.
4. @TableSchema: This parameter defines the schema under which the tables reside. It ensures the correct retrieval of table data within the specified schema context.
5. @ViewSchema: This parameter represents the schema under which the dynamic view will be created. If the schema doesn’t exist, the script dynamically creates it to accommodate the view.
6. @ViewName: This parameter defines the name of the dynamic view. It should be unique within the specified @ViewSchema and serves as an identifier for accessing the combined data.
7. @FieldList: An optional parameter, @FieldList, allows users to specify a list of fields they want to include in the dynamic view. If not provided, all fields from the tables will be included by default.
8. @TopCount: Another optional parameter, @TopCount, determines the maximum number of rows to include in the dynamic view. By setting this value, users can control the amount of data returned and improve query performance.
9. @AddUniqueField: This binary parameter, when set to 1, adds an additional column called “UniqueField” to each row of the dynamic view. The value of this field is generated using the NEWID() function and ensures uniqueness within the view’s result set.
Script Execution:
The “SearchAndView” stored procedure follows a structured workflow to create the dynamic view. Here’s an overview of the execution steps:
1. Parameter Validation: The script first validates the input parameters, ensuring that essential values like @TableSchema, @ViewSchema, @ViewName, and @TableList are provided. If any required parameter is missing, an error is raised, and the procedure is terminated.
2. Schema Creation: The script checks if the specified @ViewSchema exists. If not, it dynamically creates the schema using the CREATE SCHEMA statement. This step ensures that the view is created within the desired schema context.
3. View Existence Check: Before creating the dynamic view, the script verifies if a view with the same @ViewName already exists within the specified @ViewSchema. If found, the existing view is dropped to avoid conflicts during view creation.
4. Dynamic View Creation: The script constructs the CREATE VIEW statement using the specified @ViewSchema, @ViewName, and other parameters. It then iterates over the tables provided in @TableList, generating SELECT statements for each table. The statements include the necessary JOIN or UNION ALL operations to combine data from multiple tables.
5. Optional Functionality: If @FieldList is provided, it is included in the SELECT statement to specify the desired fields in the dynamic view. If @TopCount is specified, a TOP clause is added to limit the number of rows returned. If @AddUniqueField is set to 1, the NEWID() function is used to generate a unique identifier column, which is included in each row of the dynamic view.
6. Dynamic SQL Execution: The constructed SQL statement is executed using sp_executesql to create the dynamic view within the specified @ViewSchema and @ViewName.
7. Error Handling: The script includes error handling logic within a TRY…CATCH block. If any error occurs during view schema creation, dropping the existing view, or creating the dynamic view, an error message is raised, providing details about the encountered error.
CREATE PROCEDURE SearchAndView (
    @SearchField VARCHAR(100),
    @SearchText VARCHAR(100),
    @TableList VARCHAR(MAX),
    @TableSchema VARCHAR(100),
    @ViewSchema VARCHAR(100),
    @ViewName VARCHAR(100),
    @FieldList VARCHAR(MAX) = NULL,
    @TopCount INT = NULL,
    @AddUniqueField BIT = 0
)
AS
BEGIN
    -- Check if TableSchema is empty
    IF @TableSchema IS NULL OR LTRIM(RTRIM(@TableSchema)) = ''
    BEGIN
        RAISERROR('Error: TableSchema is required.', 16, 1)
        RETURN;
    END

    -- Check if ViewSchema is empty
    IF @ViewSchema IS NULL OR LTRIM(RTRIM(@ViewSchema)) = ''
    BEGIN
        RAISERROR('Error: ViewSchema is required.', 16, 1)
        RETURN;
    END

    -- Check if ViewName is empty
    IF @ViewName IS NULL OR LTRIM(RTRIM(@ViewName)) = ''
    BEGIN
        RAISERROR('Error: ViewName is required.', 16, 1)
        RETURN;
    END

    -- Check if TableList is empty
    IF @TableList IS NULL OR LTRIM(RTRIM(@TableList)) = ''
    BEGIN
        RAISERROR('Error: TableList is required.', 16, 1)
        RETURN;
    END

    DECLARE @SQLStatement NVARCHAR(MAX)
    DECLARE @ErrorMessage NVARCHAR(4000)

    -- Check if the view schema exists, if not, create it
    IF NOT EXISTS (SELECT * FROM sys.schemas WHERE name = @ViewSchema)
    BEGIN
        SET @SQLStatement = 'CREATE SCHEMA ' + QUOTENAME(@ViewSchema)

        BEGIN TRY
            EXEC sp_executesql @SQLStatement
        END TRY
        BEGIN CATCH
            -- Handle any errors that occurred during execution
            SET @ErrorMessage = ERROR_MESSAGE()
            RAISERROR('Error occurred while creating the view schema. Error message: %s', 16, 1, @ErrorMessage)
            RETURN
        END CATCH
    END

    -- Check if the view already exists and drop it if necessary
    IF EXISTS (SELECT * FROM sys.views WHERE name = @ViewName AND SCHEMA_NAME(schema_id) = @ViewSchema)
    BEGIN
        SET @SQLStatement = 'DROP VIEW ' + QUOTENAME(@ViewSchema) + '.' + QUOTENAME(@ViewName)

        BEGIN TRY
            EXEC sp_executesql @SQLStatement
        END TRY
        BEGIN CATCH
            -- Handle any errors that occurred during execution
            SET @ErrorMessage = ERROR_MESSAGE()
            RAISERROR('Error occurred while dropping the existing view. Error message: %s', 16, 1, @ErrorMessage)
            RETURN
        END CATCH
    END

    -- Create the view
    SET @SQLStatement = 'CREATE VIEW ' + QUOTENAME(@ViewSchema) + '.' + QUOTENAME(@ViewName) + ' AS '

    -- Split the table list into separate table names
    DECLARE @Tables TABLE (RowNumber INT IDENTITY(1,1), TableName VARCHAR(100))
    INSERT INTO @Tables (TableName)
    SELECT value FROM STRING_SPLIT(@TableList, ',')

    -- Check if FieldList is empty, if so, assign default value '*'
    IF @FieldList IS NULL OR LTRIM(RTRIM(@FieldList)) = ''
        SET @FieldList = '*'

    -- Generate the SELECT statement for each table
    DECLARE @Counter INT = 1
    DECLARE @NumTables INT = (SELECT COUNT(*) FROM @Tables)
    WHILE @Counter <= @NumTables
    BEGIN
        SET @SQLStatement += 'SELECT '

        IF @TopCount IS NOT NULL
        BEGIN
            SET @SQLStatement += 'TOP(' + CAST(@TopCount AS NVARCHAR(10)) + ') '
        END

        IF @AddUniqueField = 1
        BEGIN
            SET @SQLStatement += 'NEWID() AS UniqueField, ' + @FieldList
        END
        ELSE
        BEGIN
            SET @SQLStatement += @FieldList
        END

        SET @SQLStatement += ' FROM ' + QUOTENAME(@TableSchema) + '.' + QUOTENAME((SELECT TableName FROM @Tables WHERE RowNumber = @Counter))

        IF @SearchField  '' AND @SearchText  ''
        BEGIN
            SET @SQLStatement += ' WHERE ' + QUOTENAME(@SearchField) + ' = ''' + @SearchText + ''''
        END

        IF @Counter < @NumTables
            SET @SQLStatement += ' UNION ALL '

        SET @Counter += 1
    END

    -- Execute the dynamic SQL statement
    BEGIN TRY
        EXEC sp_executesql @SQLStatement
    END TRY
    BEGIN CATCH
        -- Handle any errors that occurred during execution
        SET @ErrorMessage = ERROR_MESSAGE()
        RAISERROR('Error occurred while creating the view. Error message: %s', 16, 1, @ErrorMessage)
    END CATCH
END
How to call the stored procedure
BEGIN TRY
    EXEC SearchAndView 'name', 'John',  'Table1,Table2,Table3','dbo','MyView', 'MyView','Age,Name',Null,1
END TRY
BEGIN CATCH
    -- Handle any errors that occurred during execution
    PRINT 'Error occurred while executing the stored procedure.'
    PRINT 'Error message: ' + ERROR_MESSAGE()
END CATCH

WITH cte(AgeMax, Number)
as
(
select MAX(AGE) as AgeMax,COUNT(*) as Number from [MyView].[MyView]
)
select AgeMax, Number from cte
Tables and data example
-- Create EnglishNames table
CREATE TABLE EnglishNames (
    Name varchar(100)
);

-- Insert English names into EnglishNames table
INSERT INTO EnglishNames (Name)
VALUES
    ('John'), ('William'), ('James'), ('Charles'), ('George'),
    ('Thomas'), ('Joseph'), ('Robert'), ('Michael'), ('David'),
    ('Richard'), ('Daniel'), ('Paul'), ('Mark'), ('Donald'),
    ('Edward'), ('Steven'), ('Brian'), ('Kevin'), ('Jason'),
    ('Jeffrey'), ('Scott'), ('Kenneth'), ('Anthony'), ('Eric'),
    ('Stephen'), ('Timothy'), ('Patrick'), ('Gregory'), ('Matthew'),
    ('Andrew'), ('Christopher'), ('Jonathan'), ('Ronald'), ('Dennis'),
    ('Jerry'), ('Gary'), ('Frank'), ('Raymond'), ('Peter'),
    ('Samuel'), ('Charles'), ('Henry'), ('Larry'), ('Jose'),
    ('Albert'), ('Arthur'), ('Ryan'), ('Carl'), ('Roger'),
    ('Benjamin'), ('Wayne'), ('Billy'), ('Walter'), ('Harry'),
    ('Howard'), ('Philip'), ('Stephen'), ('Vincent'), ('Jeremy'),
    ('Ralph'), ('Sean'), ('Johnny'), ('Bobby'), ('Louis'),
    ('Eugene'), ('Randy'), ('Russell'), ('Gerald'), ('Russell'),
    ('Keith'), ('Philip'), ('Franklin'), ('Alan'), ('Willie'),
    ('Roy'), ('Jesse'), ('Frederick'), ('Dustin'), ('Victor'),
    ('Glenn'), ('Alfred'), ('Leonard'), ('Melvin'), ('Lee'),
    ('Eddie'), ('Reginald'), ('Bill'), ('Wayne'), ('Martin'),
    ('Craig'), ('Dale'), ('Randall'), ('Bradley'), ('Jesus'),
    ('Leroy'), ('Curtis'), ('Warren'), ('Clarence'), ('Jerome'),
    ('Lewis'), ('Don'), ('Nathan'), ('Calvin'), ('Keith');

-- Create Table1
CREATE TABLE Table1 (
    Name varchar(100),
    Age int
);

-- Insert random data into Table1 using English names
DECLARE @Counter INT = 1;

WHILE @Counter <= 10000
BEGIN
    INSERT INTO Table1 (Name, Age)
    SELECT
        Name,
        ABS(CHECKSUM(NEWID())) % 100 + 1 -- Random age between 1 and 100
    FROM
        EnglishNames
    ORDER BY NEWID();

    SET @Counter += 1;
END;

-- Create Table2
CREATE TABLE Table2 (
    Name varchar(100),
    Age int
);

-- Insert random data into Table2 using English names
SET @Counter = 1;

WHILE @Counter <= 10000
BEGIN
    INSERT INTO Table2 (Name, Age)
    SELECT
        Name,
        ABS(CHECKSUM(NEWID())) % 100 + 1 -- Random age between 1 and 100
    FROM
        EnglishNames
    ORDER BY NEWID();

    SET @Counter += 1;
END;

-- Create Table3
CREATE TABLE Table3 (
    Name varchar(100),
    Age int
);

-- Insert random data into Table3 using English names
SET @Counter = 1;

WHILE @Counter <= 10000
BEGIN
    INSERT INTO Table3 (Name, Age)
    SELECT
        Name,
        ABS(CHECKSUM(NEWID())) % 100 + 1 -- Random age between 1 and 100
    FROM
        EnglishNames
    ORDER BY NEWID();

    SET @Counter += 1;
END;
This article is contributed. See the original author and article here.
Last month, I presented at Women in Tech Global Conference on the topic. During the conference and afterwards, I received a lot of queries on:
Do I as a Technologist have a role to play in ‘Sustainability’?
What is Technology’s role in Sustainability?
How is Technology getting influenced by ‘Sustainability’?
In this blog, I am answering these frequently asked questions.
We often relate to Sustainability as an initiative or agenda through which carbon footprint of any product is shared and some organizations share their commitment to reduce the same.
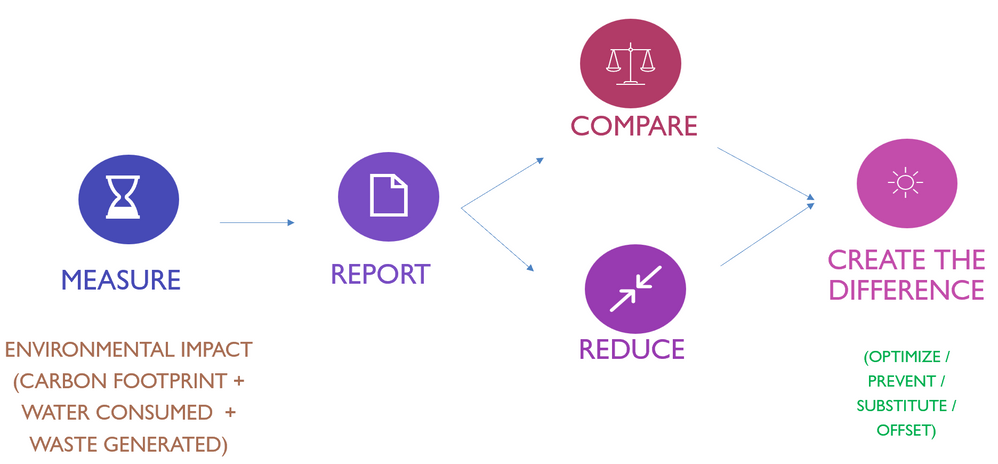
Here is the high-level summary of the journey any enterprise or business function needs to take to become sustainable. It starts with measuring the current environmental impact of the business, which enables monitoring and leads to corrective action and thereby creating a difference by minimizing environmental impact.
What is ‘Environmental Impact’? Carbon emissions, Waste generation, water consumption and land use are key impacts to ‘Environment’ that any industrialization process brings along, digital technology included.
To make this relatable, and understand how sustainability can be factored into every business process, let’s wear a hat of Garments industry Customer.
Just imagine, you come across a great deal (in terms of price):
Your deciding factors primarily will be:
Value of Product
Price, you pay for it (in terms of money)
Now what if some additional information is provided:
With this additional information, the decision of purchase will add an entirely new dimension, to consider the ‘Environmental Impact’ of this purchase decision. It will add additional factors:
Is the ‘Environmental Impact’ of this product worth the value?
What are the alternative options?
How can I maximize the usage of this product to minimize the ‘Environmental Impact’?
This transparency will lead the Garment manufacturers to explore the best available options across their whole business process from sourcing through manufacturing, distribution, and operations to ensure minimal environmental impact, there by staying competitive. This leads to prioritization for Sustainability at each stage of business enabled by technology.
To summarize, if we start measuring and sharing the environmental impact of every business, this will lead to consciousness and drive towards minimizing the impact.
These insights will lead to efficiencies across the product lifecycle leveraging the overall ecosystem. Each participant in this ecosystem has a role here in terms of sustainability, be it producer, operator, or consumer.
On the same lines, as a technologist we need to know:
What is the environmental impact of the business application we are supporting / leveraging?
How is this impact compared to other products available in the market?
How can you optimize the usage of these products, thereby minimizing the ‘Environmental Impact’?
So, whether you are a technology consumer or producer, we all have a role to play to ensure environmental impact is taken into account at every decision point.
We all have a role to play and responsibility here.
Who can leverage these solutions and resources?
Any technology customer needs to beconscious about the environmental impact their business is generating, thereby making a conscious decision during every stage of their business, be it procurement, operations, customer support or even disposition.
As of now this is heavily prioritized by the regional and industry-based compliance and competitive landscape, but it is not far that every business decision will be made with awareness and consideration of impact and responsibility towards the environment.
All these products and offerings enabling Sustainability awareness and transparency are at initial stages right now but are developing on rapid pace owing to the growing awareness and demand of having this transparency in addition to the Dollar price.
This article is contributed. See the original author and article here.
We are excited to announce the public preview of new alerts for IT admins managing Cloud PCs in Intune to better inform them about Cloud PCs in a grace period. This capability is available for Windows 365 Enterprise customers today!
We heard you. You want to receive proactive alerts on Cloud PCs so you can easily take appropriate actions based on this information. This can help reduce risk in situations where an IT admin may not be fully aware of Windows 365 provisioning controls and, therefore, make changes to user licensing or group membership that inadvertently trigger the grace period. Then you need this capability to extend to automated scripts, ensuring comprehensive coverage and proactive notification.
With this Windows 365 IT admin alerts, an email is delivered whenever a Cloud PC enters the grace period state. This provides admins with greater awareness of their environment so they can take appropriate actions and acts as a preventive measure against unintended Cloud PC deprovisioning.
Windows 365 IT admin alerts offer the following features:
Admins can establish and customize system-based alerts for Cloud PCs in the grace period based on their preferences.
IT admins can define alert rules by selecting from the available options, setting thresholds, specifying frequency, and choosing notification channels for receiving alerts.
IT admins are able to assess their environment and take informed decisions to either reprovision or end the grace period for specific Cloud PCs as needed.
Enabling the functionality to generate alerts when a Cloud PC enters the grace period is a critical, precautionary measure. It acts as a safety net in scenarios such as Cloud PC license expiration or inadvertent changes made by IT admins to groups, resulting in a Cloud PC being set to deprovision within seven days.
Why is this important? Windows 365 Enterprise users are granted a seven-day grace period to continue using a Cloud PC once it enters that state. After the grace period elapses, the user is logged off, loses access to the Cloud PC, and the Cloud PC undergoes deprovisioning. Deprovisioning is a significant and irreversible action. By proactively notifying IT admins, unnecessary deprovisioning of Cloud PCs can be mitigated.
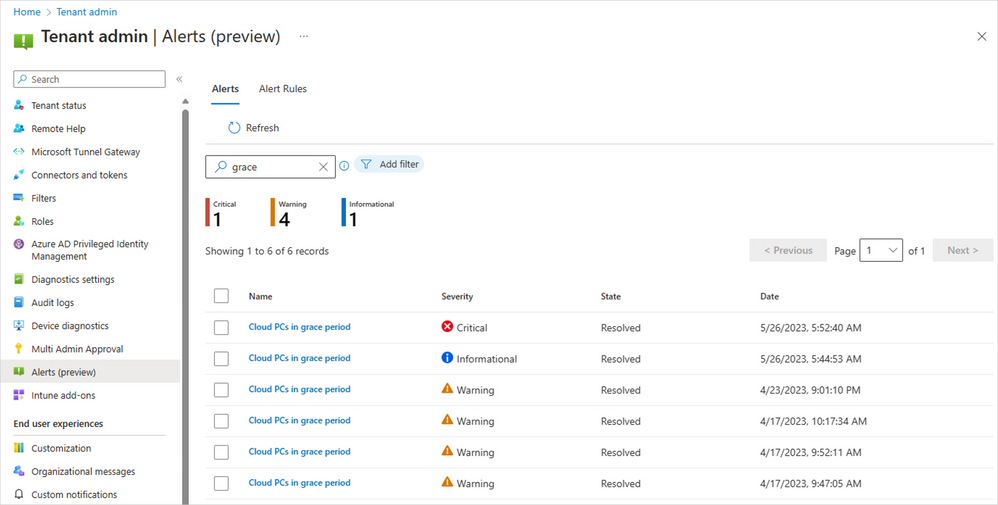
The Alerts (preview) in Microsoft Intune
In the Microsoft Intune admin center, under Tenant admin, you can review the alert history and monitor the status of a Cloud PC alert event, including details such as severity, state, and date.
Screenshot of Tenant admin in Alerts (preview) menu
Easy-to-understand alert insights
The event summary page provides a more detailed overview of the specific alert event that needs attention. This enables you to promptly investigate issues related to Cloud PCs in the grace period and gain a comprehensive understanding of the impact.
Screenshot of Alerts (preview) menu with a red highlight on the reports “Show all Cloud PCs in grace period”
When you select Show all Cloud PCs in grace, you are redirected to the corresponding alert event page, as displayed below. This page offers additional information about the alert event, enabling you to take appropriate actions to resolve the issue.
Screenshot of All Cloud PCs tab under the Windows 365 menu with a red highlight over the status of devices in grace period
If you select In grace period for a particular Cloud PC, a fly-out will appear, providing details about the impact of Cloud PCs in the grace period. You can then choose to either Reprovision Cloud PC or End the grace period.
Screenshot of CPC-SB pop up menu showing the option to “reprovision Cloud PC” or “end grace period”
Managing alert rules and email notifications
With this new capability, you have the flexibility to customize and enable or disable the alert rules, including conditions, settings, and notifications, depending on their specific requirement.
Additionally, you have the flexibility to configure your preferred notification methods for events by choosing options such as portal pop-up and email. We also provide support for email localization, allowing you to customize the language in which you prefer to receive alert notifications.
Screenshot of Alerts (preview) under the Alert Rules tab showing the optional notification methods
Screenshot of the Cloud PCs in grace period menu under the Alert rules tab showing more details on notification options
Prerequisites and what’s next
Windows 365 system-based alerts are currently available for Windows 365 Enterprise customers and only with Microsoft Intune. The account needs to have the Intune Global Admin, Intune Admin, or Windows 365 Admin roles assigned.
Enhanced IT admin alerts for Cloud PCs that are unable to connect are coming soon. You’ll also soon have the ability to proactively notify IT admins when Cloud PCs encounter issues such as unhealthy hosts, persistent connection errors, suspected infrastructure problems, or other systemic issues. These new capabilities will also provide valuable insights to assist in resolving the problem promptly.
For a demo on this new alerts capability for Cloud PCs in a grace period, now in public preview, please check out this video:
This article is contributed. See the original author and article here.
Like you, professionals around the world know that the cloud is transforming the business landscape for the better, while offering unparalleled opportunities for innovation and growth. As you look to the cloud to do more with less and to help support your organization’s goals and success, we’re confident that Azure can help you do exactly that—from saving money by migrating your apps and data to the cloud, to optimizing those cloud costs, and then reinvesting those savings to drive progress.
Knowing how critical these areas are, our mission is for Azure to be the world’s computer, so you can do what you do best—innovate, create, and differentiate your business. We also know that you need to focus on strategy and decision-making rather than on navigating the technical complexities of the cloud, even while you explore Azure costs and benefits, along with its ability to help solve your organization’s challenges.
So, where can you find an Azure overview?
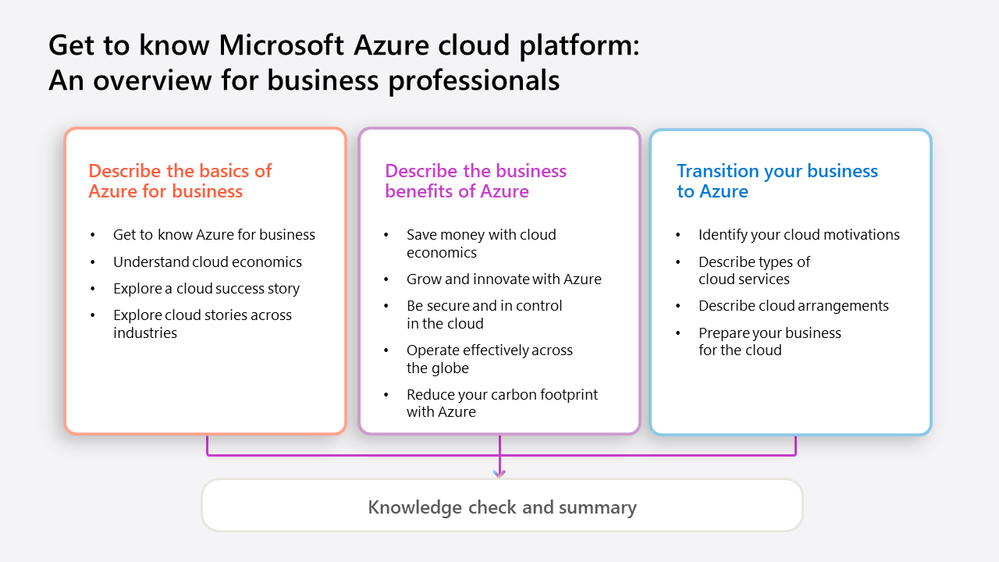
We’re happy to introduce the new Get to know Microsoft Azure cloud platform: An overview for business professionals learning path on Microsoft Learn, crafted with you and your learning goals, needs, and preferences in mind. This free practical resource is designed to bridge the gap between cloud platform knowledge and business strategy—with no technical background required. Plus, you can complete it in about90 minutes, which makes this an extremely time-efficient investment.
Created to help you quickly learn the advantages of Azure and how it can support your organization’s success, this learning path focuses on real-world examples across multiple industries. It demonstrates how cloud adoption can benefit your operations, drive cost savings, fuel growth, and more.
What can you expect to learn?
We know that business leaders want the innovation and agility that the cloud enables, but you need to learn at your own pace and on your own schedule. So we’ve distilled the essential aspects of Azure into concise modules, helping you to get the maximum value from your time. With practical insights and real-life case studies, we highlight the transformative power of cloud adoption, offering the inspiration and confidence to explore the possibilities of Azure in three modules:
Describe the basics of Azure cloud for business details what the cloud is, what Azure is, and how your business can grow and transform with Azure and cloud economics.
Describe the business benefits of Azure covers cost efficiency, innovation, agility, and security.
Transition your business to Azure examines the various decisions to anticipate as you move to the cloud. Review strategic considerations and best practices for migrating to Azure and look ahead to the Microsoft Cloud Adoption Framework.
Modules and lessons included in the “Get to know Microsoft Azure cloud platform: An overview for business professionals” learning path
What other new learning paths are available for business leaders?
Like the cloud, AI has the power to change how organizations around the world operate, compete, and build value. And AI is ushering in a transformative era of innovation, efficiency, and unprecedented possibilities. We recently announced another new free educational series on Microsoft Learn, Transform Your Business with Microsoft AI, created to help you build your AI knowledge, insights, and skills.
This curriculum, which complements the new Azure overview for business leaders, explores:
The competitive advantage and potential of AI.
How to make informed decisions about its adoption.
Examples from the Microsoft AI journey.
Guidance from Microsoft experts and other industry leaders.
When you take this 90-minute cloud journey, you gain insight into the transformative power of Azure, enhancing your cloud fluency and examining strategic decisions that can help drive your business forward. With Microsoft Azure as your trusted cloud provider, you get not only security and privacy but also a reliable business partner invested in your success. Embrace the benefits of cloud computing, explore how it can solve your challenges, and discover the potential savings it offers, with this new learning path for business leaders.
This article is contributed. See the original author and article here.
Dynamics 365 Field Service Mobile is a robust and scalable mobile application created for your frontline workers. With the capabilities of Microsoft Power Platform and Dataverse, you can customize and configure the mobile application to meet your unique business needs. In this post, we’ll explore the most important things you can do—and not do—to create the best possible experience for your frontline workers when you implement Field Service Mobile.
5 “Dos” when you implement Field Service Mobile
Do use “mobile offline“ for frontline workers
Frontline workers often perform tasks in areas with variable network connectivity. Online-only applications can experience slow performance when network connections are poor. Responses can be delayed or even fail when the network isn’t available.
Using offline-first mode with Field Service Mobile provides a consistent user experience for frontline workers regardless of network conditions. Even if the network is often available, offline mode has advantages for your organization.
The offline-enabled application stores and retrieves data from a local database on the device. App performance improves without the dependency on network calls to fetch data from the server.
When a network is available, the offline application automatically synchronizes data with the server. Without a network connection, the sync pauses until the device is back online. Frontline workers can focus on completing their tasks without worrying about network connectivity.
Frontline workers’ job progress is not delayed by long waits or networking errors in cases when they temporarily lose network access.
When configuring Field Service Mobile, you have control over the precise layout of forms and fields. It’s important to keep core user scenarios in mind when defining the layout of your forms to create a streamlined experience. Focus your customizations on making the interface intuitive and efficient. This is especially useful for new employees to help them familiarize themselves with the necessary processes and steps to complete their work.
Here are some suggestions to simplify the application:
Use fields in a logical sequence. Avoid forcing users to move between forms.
Consider performance when you lay out form fields and tabs. Fields that are off-screen are loaded on a delay to avoid impacting the user accessing data that’s visible on the screen. However, sub-grids and charts are loaded with the initial form and can have an impact on performance if they’re added to the form’s default tab.
Use Work Order Service Tasks, Services, and Products. These out-of-the-box tables help guide frontline workers to complete a work order.
Do minimize customizations
Field Service Mobile provides much of the necessary app experience out of the box, but there are times when business requirements necessitate business logic unique to your organization. When customizations are necessary, follow best practices and use common Power Platform capabilities. This enables your organization to get the latest new features and enhancements sooner. It also helps to improve supportability and lower maintenance costs.
We recommend documenting your customizations. This helps you to understand changes and set yourself up for success when making future revisions.
Do train users and use feedback for improvements
Training your users on how to use the app and any unique workflows leads to higher productivity and satisfaction. Training should include a feedback loop to assess user satisfaction and be responsive to misunderstandings or requested changes that will improve the frontline workers’ workflow.
Do take advantage of documentation and the Field Service community
A wealth of information is available in Field Service documentation and learning sites. Help is also available in the community-driven Field Service forum. Use these resources to build solid understanding of Field Service, Dynamics 365, and the Power Platform.
5 “Don’ts” when you implement Field Service Mobile
Don’t skip user acceptance testing
Assessing the end-to-end application in real-world scenarios with your organization’s customizations and data is critical to a successful rollout. This can be a challenge when introducing diverse Field Service scenarios in addition to complex online and offline capabilities.
Focus testing on the “happy path” workflow through the application. Make sure frontline workers can complete that workflow without error in various situations.
Test with the same set of devices that users will have.
Test with the same security role and data access that users will have.
Test with production-level amounts of data.
Test offline mode in variable network conditions emulating real-world usage.
Intermittent or ‘flaky’ network access: Weak or variable cellular signal or areas of high latency
Test customizations and make sure they work well on different devices with the network and in offline scenarios.
Enable a feedback loop with your tests. Listen closely to actual users who are taking part in user acceptance testing. Plan a phase to incorporate feedback, which will help users during the final rollout.
Don’t use low-performance hardware or outdated software
Mobile devices evolve quickly, and it’s best to keep up to date by using recent hardware with sufficient memory and processing power. Using modern, high-performance mobile devices increases productivity through faster access to data and better battery life. Additionally, apps on modern devices are more reliable and less prone to slowdowns or crashes.
Field Service Mobile recommends evaluating the device based on CPU benchmark scores as given in the system requirements documentation.
Don’t implement offline mode without understanding data needs
It’s highly recommended that you use offline mode with Field Service Mobile. When implementing offline mode, plan based on your scenarios and data needs for a successful experience for your users.
Include only the required data. It’s important to take a minimal amount of data offline as required for frontline workers to perform their work. Reducing data helps with the sync time, cellular data usage, device battery usage, and device storage. It’s important to understand users’ true data needs and how security roles influence data access.
Minimize the number of relationships between tables to reduce query complexity. The amount of data isn’t the only factor to consider. Complex queries with multiple joins against large tables can also have a high impact on offline sync time.
Avoid frequent schema changes. Schema changes may force the redownload of tables that had changes, resulting in longer sync times.
Be aware of server-side business logic. The offline-enabled Field Server Mobile application syncs data from the server at regular intervals. If part of a workflow depends on interaction with the server, the response may take minutes to return to the client when the network is available and not at all if the user is truly offline. It’s recommended that you move as much business logic to the client as possible to reduce wait time and dependency on the network.
Don’t design a workflow that includes switching applications or context
Try to bring as much of the Field Service workflow into the Field Service Mobile application as possible so frontline workers don’t need to switch between multiple applications. Maintaining multiple applications is time-consuming and frustrating for the user and increases organizational overhead. Use the Power Apps Component Framework (PCF) to build custom experiences, bringing in other data sources when necessary.
If alternate applications are required, try to ease the burden of context switching by using deep links to navigate between the apps.
Don’t reuse web forms on mobile devices
A benefit of working on the Power Platform is being able to reuse forms on both web and mobile. This capability can make development of your form more efficient, reduce maintenance, and provide a common user experience regardless of how the form is accessed.
However, a form intended for use on a larger-screen device may have information that’s not necessary for a technician using the mobile application. For this reason, we recommend creating mobile-specific forms in some cases to provide an optimized experience that contains only the data that’s necessary for the user.
Conclusion
Field Service Mobile is a powerful application that brings the robust capabilities of Dynamics 365 and the Power Platform into the field. Following these best practices and avoiding common mistakes will help you implement Field Service Mobile successfully.
What you can do with restricted management administrative units
With restricted management administrative units, you can now designate specific users, security groups, or devices in your Microsoft Entra ID tenant that you want to protect from modification by tenant-level administrators.
Here are some situations in which this is useful:
You want to protect sensitive user accounts, such as C-level executives, from being able to have their password or multifactor authentication settings changed by regular helpdesk administrators.
You want to ensure that certain user accounts, security groups, or devices from a specific country can only be modified by designated administrators from that country.
You have specific security groups granting access to sensitive data and you want to restrict who can modify the membership only to a small set of administrators.
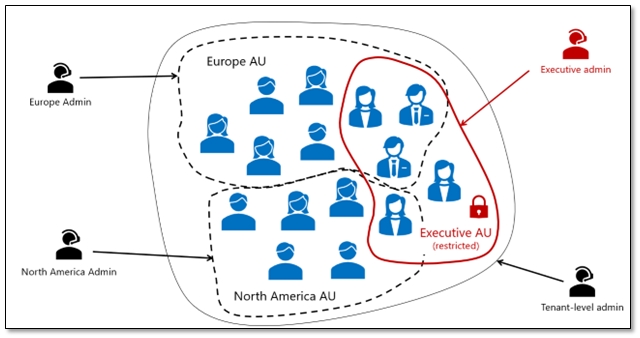
By placing your sensitive objects in a restricted management administrative unit, your tenant-level administrators will not be able to modify them. Only the administrators you explicitly assign to the scope of the administrative unit itself will be able to make changes.
Tenant-scoped and other admin unit-scoped administrators are blocked from resetting executives’ account passwords. Only the explicitly designated Executive admin can manage these accounts.
This is a much easier way to protect your sensitive objects than having to identify and scope every single role assignment in the tenant just to your non-sensitive objects.
How to use restricted management administrative units in your tenant
Here’s a quick example of how restricted management administrative units make it a breeze to secure a few sensitive user accounts in your tenant:
1. Under Roles & admins, select Admin units and click Add to create a new administrative unit.
2. Set the Restricted management administrative unit setting to “Yes” and click Next: Assign Roles
3. Add the designated administrator(s) who should be the helpdesk administrators for these sensitive accounts (these are the people who you do want to manage the accounts) and finish creating the administrative unit.
4. Now, you can go ahead and add the sensitive user accounts to the restricted management administrative unit you just created (just like you would for any other administrative unit).
That’s it! Now the sensitive user accounts can only be modified by the users you designated, regardless of how many other administrative roles may be assigned in your tenant.
To learn more details about how restricted management administrative units can help you secure sensitive resources in your tenant, check out our product documentation!
This article is contributed. See the original author and article here.
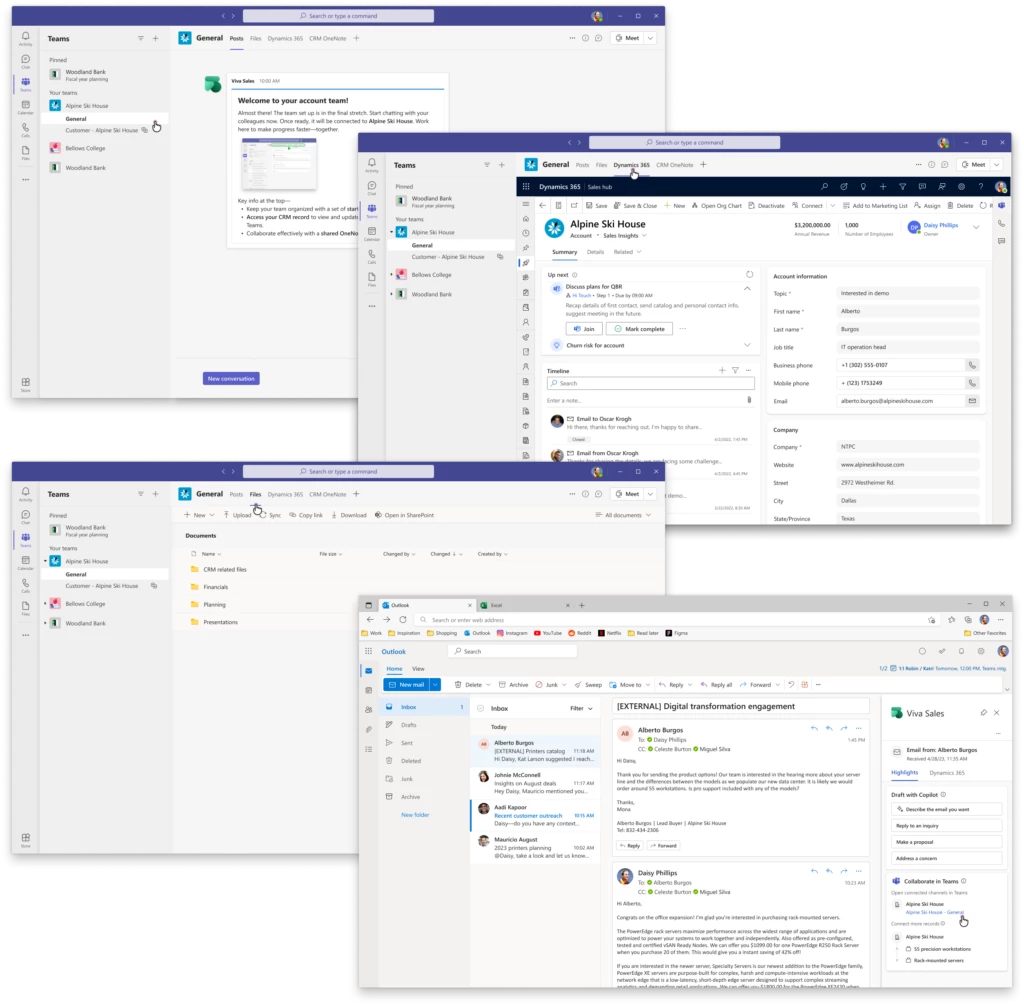
We are thrilled to announce the general availability of Collaboration spaces in Viva Sales, transforming the way sales teams collaborate. Collaboration is essential for sales success, yet many organizations struggle to stay organized and find the right digital tools to bring them together. In the pursuit of closing deals, sellers find themselves collaborating with an average of over 15 cross-functional teams within their organizations, while simultaneously serving their customers. This intricate web of interactions adds a significant layer of complexity to their already demanding work.
With Collaboration spaces, sellers now have an organized and effortlessly created space, tailored to their needs, where they can collaborate seamlessly with their colleagues and customers.
Collaboration space in Teams for an account team
Collaboration made easy with Sales templates
Sales templates in Viva Sales simplify the process of creating purpose-built Collaboration spaces in Microsoft Teams, directly linked to D365 or Salesforce accounts or opportunities. Collaboration spaces are set up with predefined channels and pinned apps, providing a ready-made environment for effective collaboration built on the secure and trustworthy framework provided by Teams.
Once set up, sales teams can conveniently access these Collaboration spaces from the Viva Sales app in Outlook or directly from the Sales app, within the context of their accounts or opportunities. This eliminates the hassle of searching for the right place to collaborate, saving valuable time for the sales team.
We are excited to offer two sales templates as part of this release:
1. Account team template: The Account team template is designed for seamless collaboration within account teams and with customers. Applied at the team level and linked to a CRM account, this template provides a comprehensive solution. It comes equipped with predefined channels and pre pinned apps, ensuring a smooth and efficient workflow for effective collaboration.
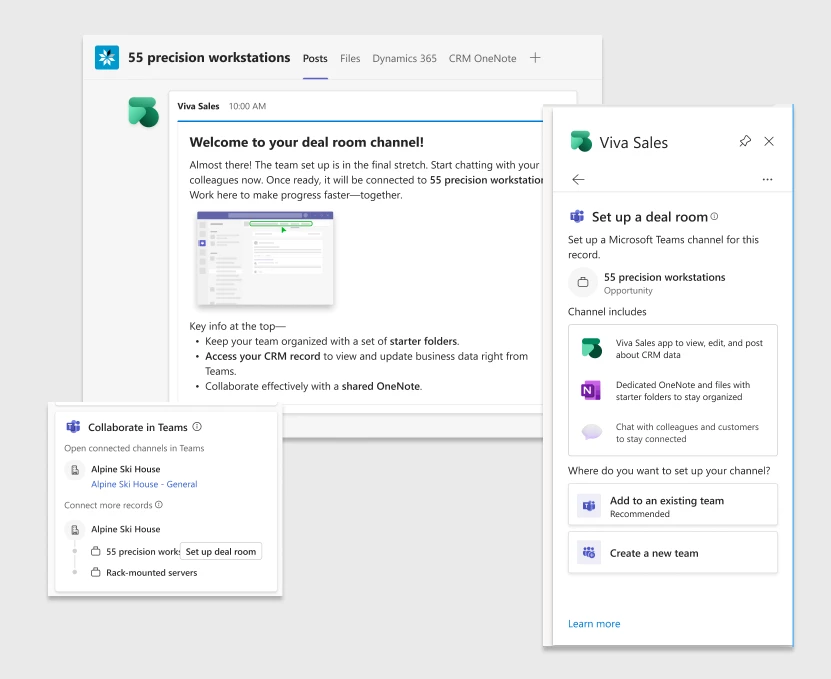
2. Deal room template: The Deal room template is tailored for focused collaboration on deal related activities. Applied at the channel level and linked to a CRM opportunity, this template provides a dedicated space for efficient teamwork. With predefined channels and pre pinned apps, it streamlines communication and enhances productivity, allowing sales teams to effectively collaborate and drive successful deal outcomes.
Deals rooms that help sellers collaborate effectively
Eliminate set-up overhead for effortless teamwork
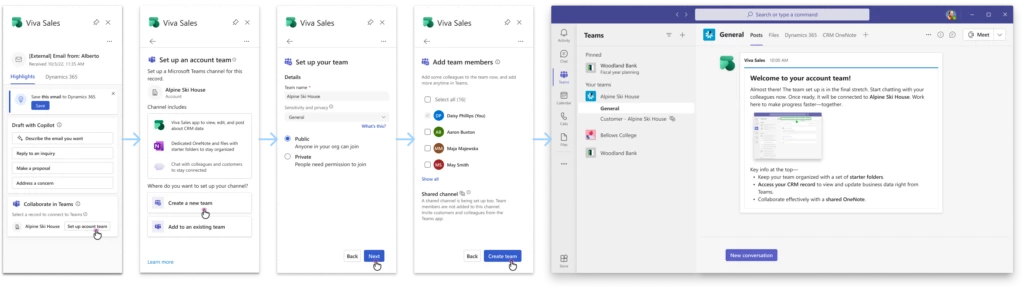
Setting up a Collaboration space is now easier than ever. With just a few clicks, sellers can create their own space for collaboration. By clicking on the ‘Set up account team’ or ‘Set up deal rooms’ button from Collaborate in Teams card in Viva Sales app within Outlook, sellers can quickly get the set up going. The process involves three simple steps: choosing a new/existing team, reviewing default team/channel names, and adding recommended team members to new teams.
Simplified setup for account teams
Convenient access within sales workflows
Once set up, sales teams can conveniently access these Collaboration spaces from the Viva Sales app in Outlook or directly from the D365 Sales app, within the context of their accounts or opportunities. This eliminates the hassle of searching for the right place to collaborate, saving valuable time for the sales team.
This article is contributed. See the original author and article here.
In the realm of database management, the BACPAC format is widely used for exporting and importing data between databases. However, we have found an interesting service request, where the recommended automatic indexes are not included in the exported data used by BACPAC.
The Scenario:
During a remote session with a customer, a comparison between the source and target databases revealed a discrepancy in the indexes. Specifically, while the source database contained three types of indexes (PK_xxx, IX_xxx, and NCI_xxx), only the manually created PK_xxx and IX_xxx indexes were visible in the target database after restoration. The absence of NCI_xxx indexes prompted an investigation into the BACPAC export process.
Unveiling the Missing Indexes:
To shed light on the issue, the .BACPAC file extension was changed to .ZIP, allowing access to the model.xml file. By analyzing the file, a search for PK_xxx and IX_xxx indexes revealed their presence, but the NCI_xxx indexes were absent. Further examination of the sys.indexes view showed a significant distinction: the column auto_created held a value of 1 for NCI_xxx indexes, indicating that they were automatically created by Azure.
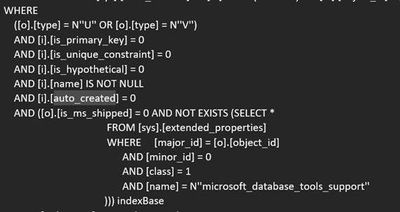
Uncovering the Export Query Condition:
A test conducted in an on-premises environment using SQL Profiler provided valuable insights. The query responsible for exporting indexes contained a condition wherein auto_created = 0, thereby excluding automatically created indexes. This finding explains the root cause of the missing NCI_xxx indexes in the BACPAC export.


Recent Comments