by Contributed | Dec 17, 2023 | Technology
This article is contributed. See the original author and article here.
Our newest round of Access bug fixes was released on November 25th, 2023. In this blog post, we highlight some of the fixed issues that our Access engineers released in the current monthly channel.
If you see a bug that impacts you, and if you are on the current monthly channel Version 2311, you should have these fixes. Make sure you are on Access Build # 16.0.17029.20068 or greater.
Bug Name
|
Issue Fixed
|
Reserved error -1001 when using a reserved word in a SQL query
|
This would only happen if the option to use “SQL Server Compatible Syntax (ANSI 92)” was enabled. In that case the use of a reserved word for a table or field name would generate this error. We will no longer generate an error if Access does not use the specific reserved word, and it will allow the word to be used as a name, without error.
|
Report in report view shows navigation controls
|
The record navigation controls that appear at the bottom of a form window that allow you to move to first/last records, etc. should never appear for a report in report view. The “Navigation Records” property is not exposed for reports, but if the “Scroll Bars” property was set from VBA while a report was open in report view, the navigation controls would incorrectly be displayed.
|
Can’t open a query directly into SQL view
|
Previously to get to SQL view, you’d have to open in query design view first, then switch to SQL view, now you can open directly into SQL view, using a context menu, or code/macro.
|
Navigation Pane does not display text correctly when collapsed
|
When the Navigation Pane is collapsed, it should read “Navigation Pane” with the text oriented counter-clockwise 90 degrees, but instead the text was being garbled.
|
When you navigate using the new Edge browser control using the Navigate method while the control is hidden, then set the Visible property to True, the control does not show the correct page
|
The control now performs the navigation when it is made visible.
|
In some cases, using an append query with a linked Dataverse table could cause Access to terminate
|
This scenario will no longer encounter an issue.
|
Applying multiple filters to a linked Dataverse table could cause Access to terminate
|
Applying a filter to a linked Dataverse table could ‘leak’ open tables, and eventually cause Access to terminate, this issue is now fixed.
|
Please continue to let us know if this is helpful and share any feedback you have!
by Contributed | Dec 16, 2023 | Technology
This article is contributed. See the original author and article here.
This week, we’ve been tackling a support case where our client encountered the following error message: ‘[HikariPool] 2023-11-29 04:13:20,491 WARN (HikariPool.java:602) %h – AppNamePool – Unusual system clock change detected, soft-evicting connections from pool.‘ I’d like to share with you the troubleshooting steps we undertook to diagnose this error message.
The first step is to understand when this message occurs in the HikariCP code. To do this, I checked various versions of HikariCP and found that in version 2.4.0 this error message appears in the HikariPool.java within the private class HouseKeeper in the version, for example, HikariCP/src/main/java/com/zaxxer/hikari/pool/HikariPool.java at HikariCP-2.4.0 · brettwooldridge/HikariCP (github.com),
Also, we identified a possible bug (Hikari might not recover from state “Unusual system clock change detected” · Issue #354 · brettwooldridge/HikariCP (github.com)) in this code but, basically, this error means:
- “Unusual system clock change detected, soft-evicting connections from pool.” is a warning from HikariCP. It indicates that HikariCP has detected an unusual change in the system clock and is performing a “soft eviction” of connections from the pool. This message relates to connection management and handling potential inconsistencies caused by system time changes.
- A “soft eviction” means that HikariCP immediately closes connections if they are not being used by the application or simply marks them for eviction later when the connection is returned to the pool. That is, connections in use are not interrupted but are flagged to be closed once they return to the pool. The rationale behind this is that a significant change in the system clock, either backward or forward, can impact HikariCP’s calculations related to idle time, lifetime, or various connection timeouts, potentially leading to unexpected or unstable pool behavior.
- This behavior in HikariCP is triggered when the system clock moves backward or jumps forward beyond an acceptable threshold. For instance, if the clock moves backward or jumps forward by more than a minute, HikariCP will proceed to evict connections. This mechanism serves as a precaution to handle situations where the system time is unreliable.
- It’s important to note that these unusual changes in the system clock can be caused by various factors, including NTP adjustments, power-saving modes on laptops, or even the JVM temporarily hanging. Developers need to be aware of these possibilities and how they might affect the operation of their applications, especially in production environments where a high number of database connections is critical.
In summary, HikariCP’s message is an indication that it is actively managing connections in response to unusual changes in the system time, thereby ensuring the stability and consistency of the connections in the pool. Checking new versions of HikariCP we’ve found that this code has been modified and changed the error message. brettwooldridge/HikariCP: 光 HikariCP・A solid, high-performance, JDBC connection pool at last. (github.com)
            // Detect retrograde time, allowing +128ms as per NTP spec.
            if (plusMillis(now, 128) < plusMillis(previous, housekeepingPeriodMs)) {
               logger.warn("{} - Retrograde clock change detected (housekeeper delta={}), soft-evicting connections from pool.",
                           poolName, elapsedDisplayString(previous, now));
               previous = now;
               softEvictConnections();
               return;
So, in this such situation, it is important to maintain the system clock update to advoid this type of issue that is not related with Azure SQL Database, used the latest version of HikariCP and in case of any additional questions or issue open a service request with this team.
Enjoy!

by Contributed | Dec 15, 2023 | Technology
This article is contributed. See the original author and article here.
Microsoft 365 Copilot is not only a powerful tool for creating documents, but also a smart assistant for Microsoft Teams meetings. With Copilot, you can easily prepare for your meetings, take notes, capture action items, and follow up on tasks. Here are some ways that Copilot can help you in your Teams meetings:
– Before the meeting, Copilot can scan your calendar and suggest relevant documents, insights, and questions to help you get ready. You can also ask Copilot to create an agenda and share it with the attendees.
– During the meeting, Copilot can listen to the conversation and transcribe it in real time. You can also ask Copilot to summarize the key points, highlight important information, and generate a meeting recap.
– After the meeting, Copilot can send the meeting recap to the attendees, along with the action items and due dates. You can also ask Copilot to follow up on the tasks, check the progress, and remind the assignees.
With Microsoft 365 Copilot in Teams meetings, you can save time, improve collaboration, and enhance productivity. (fyi, this preceding description… was written by Microsoft 365 Copilot)
In this Day 10 of Copilot I walk through the use of Microsoft 365 Copilot within Microsoft Teams meetings.
Resources:
Previous Days of Copilot:
Thanks for visiting – Michael Gannotti LinkedIn | Twitter


by Contributed | Dec 14, 2023 | Dynamics 365, Microsoft 365, Technology
This article is contributed. See the original author and article here.
How often do you find yourself spending too much time reading through long and complex customer cases, trying to figure out the main problem and the best solution? What amount of cases do you handle per day, and how do you ensure quality and consistency in your responses? How do you keep track of the most relevant and updated information from multiple sources and channels?
These are some of the challenges that support agents face every day, and they can affect their productivity, performance, and satisfaction. Customers expect fast and accurate answers to their questions and issues, and they don’t want to repeat themselves or wait for long periods of time. Support agents need to be able to quickly understand the context and history of each case, identify the root cause and the best action, and communicate effectively with customers and colleagues.
This is where summarization comes in. Summarization is an AI-powered feature that provides support agents case summaries to help them quickly understand the context of a case and resolve customer issues more efficiently. It uses large language models and natural language processing to analyze and condense information from various sources and formats, such as emails, chat messages, phone calls, documents, and web pages, into concise and relevant summaries. Summarization can save you time, improve your accuracy, and enhance the customer experience.
This blog post explains how summarization works, what benefits it can bring to your support team and your organization, and how you can turn it on and use it with Dynamic 365 Customer Service Copilot, the leading AI platform for customer service.
Summarization: The gateway to generative AI Innovation
Summarization stands out as an ideal first use case, primarily due to its immediate, measurable impact on efficiency and productivity. It automates the extraction of crucial details such as the case title, customer, subject, product, priority, case type, and description. The AI-generated summaries offer context and communicate the actions already undertaken to address the issue. Summarization delivers tangible benefits, showcasing the power of generative AI in a clear and demonstrable manner.
Compared to other AI use cases, the implementation of summarization is less complex. It is a straightforward starting point for organizations new to generative AI, reducing barriers to entry and integration time. The success of summarization in enhancing productivity and achieving measurable outcomes serves as a confidence-building milestone for organizations. Experiencing the transformative power of generative AI fosters trust in the technology. Additionally, it lays a robust foundation for delving into more advanced use cases.
Starting with summarization brings immediate operational improvements. It also helps organizations to embrace the broader potential of generative AI, setting the stage for future business process innovation.
By selecting the Make case summaries available to agents checkbox, administrators can bring their organization a quick win that adds immediate business value. We have invested in summarization features to allow more customization options. Admins now can customize the format of how agents view conversation summaries. They can also customize the entities and fields that are used for case summary.
Learn more
To learn more about summarization, read the documentation: Enable summarization of cases and conversations | Microsoft Learn
The post Begin your copilot journey with summarization appeared first on Microsoft Dynamics 365 Blog.
Brought to you by Dr. Ware, Microsoft Office 365 Silver Partner, Charleston SC.
by Contributed | Dec 14, 2023 | Technology
This article is contributed. See the original author and article here.
Today, we announced that Copilot for Microsoft 365 will be available to purchase for faculty and staff with Microsoft 365 A3 and A5 licenses beginning January 1, 2024. Also, starting in early February 2024, Microsoft Copilot (formerly Bing Chat Enterprise) will be available for all faculty users and Higher Education students who are 18 years or older.
Copilot for Microsoft 365 available for Education faculty and staff
Beginning on January 1, 2024, Copilot for Microsoft 365 will be generally available for Microsoft 365 A3 and A5 faculty for $30 per user per month with a 300-seat minimum per tenant. Copilot for Microsoft 365 combines the power of large language models (LLMs) with your organization’s data – all in the flow of work – to turn your words into one of the most powerful productivity tools on the planet. We’re excited to bring generative AI to educational institution faculty and staff, benefitting their impactful work across research, communications, marketing, data analysis, fundraising, and management.
Copilot inherits your organization’s security, compliance, and privacy policies set up in Microsoft 365. To learn more about Copilot for Microsoft 365, you can review documentation including requirements, setup, and information about privacy, security, and compliance.
Educational institutions interested in purchasing Copilot for Microsoft 365 should contact their account teams.
Microsoft Copilot with commercial data protection available to faculty and higher education students
We’re also excited to announce that beginning in early February we’re expanding availability of Microsoft Copilot with commercial data protection (formerly Bing Chat Enterprise) to all faculty, staff, and higher education students age 18+ . Eligible users, when signed in with their Entra ID account, can access Microsoft Copilot with commercial data protection from copilot.microsoft.com, bing.com/chat, or through Copilot in Microsoft Edge and Copilot in Windows. Copilot with commercial data protection means that data is protected, chat data is not saved, Microsoft has no eyes-on access to it, and it is not used to train foundation models. Learn more in this article.
Get started
Our education customers can start getting ready for Copilot now. Validate your educational institution type in the Microsoft 365 admin center, and indicate student eligibility in the Microsoft Entra admin center by updating the “Age Group” and “Consent Provided” fields. For more details on what you can do to prepare for Microsoft Copilot in your Education tenant, review this blog.
To learn more about managing Copilot, including how to disable it, review this documentation. Admins will see the service plan attached to their user’s Microsoft 365 license in late January and rollout will begin in early February.
For more information, read the full announcement.

by Contributed | Dec 13, 2023 | Technology
This article is contributed. See the original author and article here.
We are excited to announce limited General Availability of Azure Defender for new Microsoft Azure Database for PostgreSQL – Flexible Server instances. This is another add-on, which, if deployed, provides another important security barrier to your Azure PostgreSQL server in addition to existing security features, we blogged about earlier.
In the following article, we will discuss how adding Azure Defender for OSS databases with your PostgreSQL Flexible server will help you secure your applications from hacking attacks.
Protection against brute force attacks
A brute force attack uses trial-and-error to guess login info, encryption keys, or find a hidden web page. Hackers work through all possible combinations hoping to guess correctly.
These attacks are done by ‘brute force’ meaning they use excessive forceful attempts to try and ‘force’ their way into your private account(s).
The “brute-force” terminology is derived from the tactic of using constant attempts or excessive “force” until the threat actor arrives at the desired result—entry into a system with the right credentials. Despite this being one of the oldest hacking methodologies, according to Verizon’s 2020 Data Breach Investigations Report, hacking, which includes brute forcing passwords, remains the primary attack vector. Over 80% of breaches caused by hacking involve brute force or the use of lost or stolen credentials.
 PostgreSQL brute force attack example
When Microsoft Defender detects a brute force attack, it triggers an alert to bring you awareness that a brute force attack took place. It also can separate simple brute force attack from brute force attack on a valid user or a successful brute force attack.
Detecting anomalous database access patterns
Databases may store extremely sensitive business information, making them a major target for attackers. Therefore, securing their data from damage or leakage is a critical issue. To manage this, enterprises typically implement several layers of protection between users and data, working at the network, host, and database levels. The data protection at database level includes the access control models to limit the permissions to of legitimate users to read, write data and encryption at times. These security models are sometimes insufficient to prevent misuse, especially insider abuse by legitimate users. When Microsoft Defender detects anomalous pattern, it fires an alert to make you aware of such activity as well.
Enabling Microsoft Defender with PostgreSQL Flexible Server
 Enabling Defender with PostgreSQL Flexible Server in Azure Portal
- From the Azure portal, navigate to Security menu in the left pane.
- Pick Microsoft Defender for Cloud
- Click Enable in the right pane.
Resources
For more information on Azure Defender and its use with Postgres Flexible Server see following:
To learn more about our Flexible Server managed service, see the Azure Database for PostgreSQL service page. We’re always eager to hear customer feedback, so please reach out to us at Ask Azure DB for PostgreSQL.
by Contributed | Dec 12, 2023 | Technology
This article is contributed. See the original author and article here.
Today, we’re excited to announce the public preview of the Arc VS Code Extension – a one-stop-shop for all your developer needs. Whether you’re just starting your journey with Arc, or you’re already in production with an Arc enabled application, our extension can help streamline your developer experience. The Arc VS Code extension is a home for Enterprise and ISV developers alike. The features built into the extension can help you accelerate development for both workloads that you’re running on the Edge, as well as services that you’re building to publish on the Azure Marketplace.
We understand that it can be time consuming to learn new technologies and develop and test your applications. To add to the challenge, building your first application will require you to ramp up and interact with multiple products as you go through the developer workflow. To simplify this experience, we’re bringing these resources to VS Code so you never have to leave your workbench. You can use the Azure Arc VS Code Extension to deploy your first Arc enabled environment, learn Arc technologies using sample applications, and deploy to an AKS cluster for testing.
A Developer Hub for Arc
By downloading the Arc Extension to your VS code, you can now complete the following tasks in-editor:
- Deploy your first Arc enabled environment by creating a single machine AKS cluster. You can use this cluster to deploy applications locally and test your Arc enabled workloads.
- Connect your AKS clusters in your development or test environments to Arc using a single click.
- Discover sample applications by using the VS Code Extension to clone the Jumpstart Agora repository, a collection of sample applications for various cloud-to-edge scenarios.
- Create your first Arc-enabled service from scratch, even a simple HelloWorld application, with the sample code provided by deploying it on an AKS cluster on your desktop. Once you’ve created your HelloWorld application, you can then begin to deploy more complex applications, including this sample application with KeyVault
What’s next for the Arc VS Code Extension
We’re currently in public preview, and we’re working hard to add more features to the VS Code Extension that will further simplify your developer workflow. We’re working on more sample applications and a more flexible and robust developer environment.
Feedback & Contributions
The Arc VS Code Extension is an open-source, MIT-licensed product! Our team is excited to collaborate with all of you and intends for the Arc VS Code Extension to be community-driven. We welcome contributions as well as feedback. Our team encourages you to file issues, open pull requests, contribute to discussions, and more via our GitHub repository.
by Contributed | Dec 11, 2023 | Technology
This article is contributed. See the original author and article here.
Enhancing frontline manager productivity remains a critical priority for countless organizations and Microsoft. We are excited to introduce a range of new Shifts features to further empower our frontline heroes through seamless evolution that aligns perfectly with your ever-changing needs, all thanks to your invaluable feedback. Let’s unwrap some of the highlights.
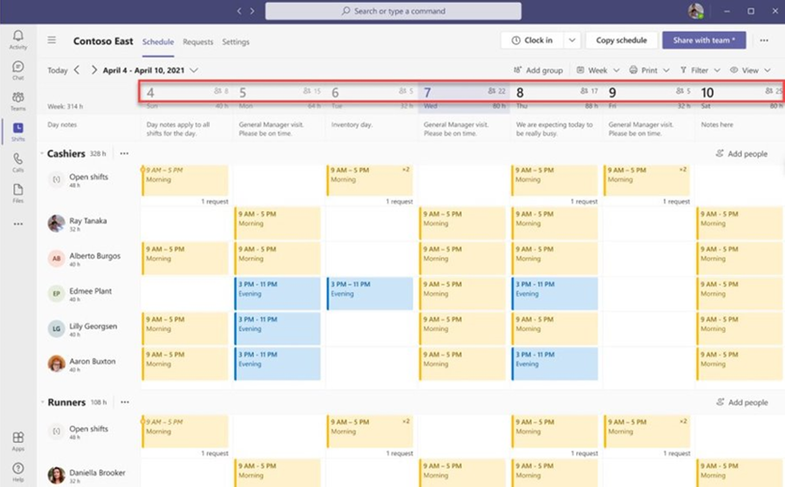
1. People Count Display on Shifts Calendar
Frontline managers (FLM) can now make informed staffing decisions with the introduction of the people count displayed on the Shifts calendar. This feature provides a clear view of staffing levels, ensuring that the right workforce is scheduled for the day, week, or month. Managers can now see the scheduled people count at both the team, and schedule group levels.

2. Core UX Improvements
We’ve streamlined the user experience with some core improvements:
1) Full Name Display: Team members’ full names are now visible in the team schedule. This helps managers quickly identify staff members by their full names, even when names are lengthy, by toggling profile pictures on/off.

2) Saving Last Used Filter: We understand that frontline managers and workers use various filters to customize their Shifts view. Our latest feature automatically saves the last used filter, so when users relaunch the Shifts app, their preferred view from the last session is readily available.
3) Shifts notes in Day view: Day view shows the shift notes inline, which helps managers save time.
3. Manager-Controlled Settings
Frontline Managers now have additional controls on team-level settings that provide the ability to control all our Shifts marketplace and visibility capabilities.

1) Visibility controls: Frontline managers can control shift information visibility for their Frontline Workers (FLW).
Limited Past Views: Managers can restrict how far back FLWs can view their coworkers’ schedules, ensuring historical data privacy.
When FLM configure the past schedule view up to certain months – FLWs cannot see other’s schedules beyond the configured duration.

Generic Time Off View: FLWs can see their colleagues’ time off in a generic way, without access to specific reasons and notes.
When FLM’s disable the visibility of time off reason and notes – FLWs see a generic time off reason of other FLW’s.

Limited Shift Details: Managers can limit the level of detail available to FLWs about their coworkers’ schedules, excluding sensitive information like Shift notes, Activities, and break duration.
When FLM’s disable the visibility of shift notes, activities, break duration – FLWs cannot see the shift details of other FLWs.

2) Shifts marketplace controls: Your organization can pace the journey towards frontline self-serve capabilities through your frontline managers ability to choose which capabilities should be offered to their workers. We have added the following new controls:
Swap shift requests: Frontline managers can decide if workers can create requests to swap their shifts with other coworkers. The requests require managers’ approval before becoming effective on the Shifts calendar.
Offer shift requests: Frontline managers can decide if workers can create requests to offer their shifts to another coworker. The requests require managers’ approval before becoming effective on the Shifts calendar.
Time off requests: Frontline managers can decide if workers can create requests for time off work. The requests require managers’ approval before becoming effective on the Shifts calendar.
4. Graph API for Day Notes
Now, managers have the flexibility to add day notes using the Graph API, in addition to the Shifts app. This powerful capability allows customers to seamlessly integrate relevant day notes from third-party, or line-of-business applications, enhancing the Shifts experience.
dayNote resource type – Microsoft Graph beta | Microsoft Learn
5. Import and export time offs and open shifts into Excel
Managers using Shifts web and desktop applications are now allowed to import not only assigned shifts, but also open shifts and time offs from Excel into Shifts. Additionally, these same schedule entities will be supported when managers export a schedule in a format compatible to the import.

What’s coming next –
Setting Availability by date: Frontline workers can set their availability on specific dates in addition to their recurring availability.
These enhancements are a result of listening to your feedback, and we’re committed to continuing to improve Shifts to meet your evolving needs. We hope these new features empower your frontline teams and streamline your workforce management processes.
We value your input! Please take a moment to share your thoughts via this brief survey and include your email for any further queries. We’re eager to connect with you!
by Contributed | Dec 10, 2023 | Technology
This article is contributed. See the original author and article here.
Unlocking Value with the Power Platform
For years now, the Power Platform has been a low code tool that unlocks value across your business by accelerating application & automation development to meet business demand faster. Whether you’re a professional developer, an IT admin, business analyst, or a non-technical employee, low code empowers you to create solutions in a fast, secure, and compliant fashion. Now with the rise of AI, organizations are moving quickly to embrace AI in order to usher in a new wave of growth and value creation.
Introducing the Livestream Series: Let’s Learn Power: A Real-life AI + Power Platform Use Case
With that, I am excited to announce a 3-part livestream series which will be hosted on the Microsoft Reactor channel that focuses on bringing the Power Platform and AI together. The series is titled Let’s Learn Power: A Real-life AI + Power Platform Use Case and it explores the integration of the Power Platform with advanced AI models to create a dynamic application inspired by Kevin Scott’s Microsoft Build 2023 demo. This application makes it easy to generate a social media post promoting a new episode of your podcast. Starting from a podcast URL, we journey through speech-to-text transcription to generate a transcript of the podcast, given that transcript, we perform guest identification and guest bio retrieval, followed by social media post generation with image creation, and finally, posting to LinkedIn from Power Apps or Copilot Studio. All powered by Azure OpenAI Service and the Power Platform AND I will walk you through it all from start to finish.
As mentioned, there will be 3 episodes livestreamed on the following dates and times:
Episode 1: Laying the Foundation: Azure Open AI Service and Power Platform
Dive into the world of Azure OpenAI Service. We introduce the service, describe the models, and guide you through creating deployments. Setting the stage for seamless AI integration.
11 December 2023 | 9AM PST | 7PM SAST
Episode 2: Bridging the Gap: .NET APIs, Azure, and Custom Connectors
We take a step further from Episode 1 by creating a .NET API using the .NET Azure OpenAI SDK, creating Azure Resources with the Azure Developer CLI, deploying the API to Azure App Service and Azure API Management and Creating a Custom Connector from API Management.
12 December 2023 | 9AM PST | 7PM SAST
Episode 3: The Final Touch: Power Apps and Microsoft Copilot Studio Integration
The final episode brings it all together. We will build the Power App UI, connect to the Custom Connector, and publish the social media post to LinkedIn. As a bonus, we will also see how to implement this workflow with a Microsoft Copilot Studio custom copilot.
13 December 2023 | 9AM PST | 7PM SAST
You can register to watch all 3 livestreams here: Register Now! and can’t wait to see you there!

by Contributed | Dec 9, 2023 | Technology
This article is contributed. See the original author and article here.
Embark on a Holiday Coding Adventure with GitHub Copilot
Hello students! Are you looking for a fun and engaging way to learn new coding concepts and languages over the holiday season? If so, you might want to check out Microsoft Copilot Adventures, a series of coding challenges powered by GitHub Copilot, an AI pair programmer that assists you in writing better code.
In this article, we’ll show you how to start your adventure, choose from different levels of difficulty and topics, and use GitHub Copilot hints to help you write your code. You’ll also learn how to share your solution with others and get feedback.
Whether you’re a beginner or an expert, Microsoft Copilot Adventures will help you improve your coding skills and have fun at the same time. So, what are you waiting for? Start your adventure today!
Welcome to Coding Adventure with GitHub Copilot
We are going to introduce you to an exciting series of coding adventures that will help you learn new concepts and languages over you holiday vacation period. This adventure experience and activities is brought to you by none other than GitHub Copilot, an AI pair programmer that assists you in writing better code.
What is GitHub Copilot?
GitHub Copilot is a tool designed to assist you in writing code. It’s like having a pair programmer who’s always ready to help.Whether you’re a beginner just starting out or an experienced coder looking to learn a new language, GitHub Copilot can be a valuable companion on your coding journey
How to Start Your Adventure
To get started, you’ll need to enter the “adventure area”. This is done by creating a GitHub Codespace Don’t worry, you can use 60 hours of GitHub Codespaces for free each month and if your registered GitHub Student Education pack user you get FREE access to codespaces Alternatively, you can clone the repo and run it locally.
Choose Your Adventure
Once you’ve set up your environment, it’s time to choose your adventure. There are several adventures available, each designed to challenge your coding skills and help you learn new concepts
Beginner Adventures
Intermediate Adventures
Advanced Adventures
Start Coding
After choosing your adventure, you’ll be given a description, high-level tasks to perform, and GitHub Copilot hints to help you write your code. You can use any language you’d like.If you’re up for a challenge, try learning a new language.
Share Your Adventure
If you’d like to share your solution with others, you can publish your adventure solution to a GitHub repo. Then, visit the issues page and select ‘New Issue’. Use the following naming convention for the issue title: ‘Solution for [Name of Your Adventure]’. Replace ‘[Name of Your Adventure]’ with the adventure name you chose to solve .
Conclusion
Embarking on a Holiday coding adventure with GitHub Copilot is a fun and engaging way to learn new coding concepts and languages. So, what are you waiting for? Start your adventure today!
Happy coding!

Recent Comments