This article is contributed. See the original author and article here.
The potential for AI at work is practically endless—and understanding how your teams can accomplish more with generative AI is more important than ever. Every day, more companies are turning to AI features to help their employees work more efficiently, provide positive customer experiences faster, and stand out among competitors.
Join us on Wednesday, April 10, 2024
See what’s new at the Microsoft Business Applications Launch Event
Join Microsoft product leaders and engineers on April 10, 2024, for an in-depth look at the latest AI features and capabilities in Dynamics 365 and Microsoft Power Platform. You’ll learn how advances in AI and Microsoft Copilot can help you connect teams, processes, and data, and respond to changing business needs with greater agility—and see how organizations across several industries already take advantage of the newest AI features to streamline business processes and accelerate low-code development.
Register now to see key presentations from Microsoft leaders, including:
Business Applications Launch Event—2024 release wave 1. Charles Lamanna, Microsoft Corporate Vice President of Business Applications and Platforms, will provide opening remarks and shed light on the strategy and vision behind new Copilot and core platform capabilities in 2024 release wave 1.
Amplifying contact centers and field service operations with AI. Jeff Comstock, Corporate Vice President, Dynamics 365 Customer Service, will share how Copilot is transforming the customer service landscape, boosting efficiency, reducing training costs, and ultimately delivering exceptional experiences for agents, frontline workers, and customers.
Streamline sales and marketing with Copilot.Lori Lamkin, Corporate Vice President, Dynamics 365 Sales and Marketing, will discuss how sellers can close more deals by optimizing sales and marketing strategies and increasing productivity.
That’s just a small sample of what we’ve got planned. You’ll also hear directly from other Microsoft leaders about their vision for AI, customer service, and operations, and get timely tips on how to use these new technologies to take on your business’ toughest challenges. If you have questions about new AI features, how Copilot experiences work, or what’s new in low-code tools, take advantage of the live Q&A chat with Microsoft experts throughout the event.
Explore new AI features and capabilities for Dynamics 365
We’re excited to share the latest AI features for Dynamics 365 spanning across end-to-end customer experiences, sales, finance, supply chain, commerce, and other areas. Here are just a few of the new features in 2024 release wave 1:
Microsoft Dynamics 365 Sales features include recommended content for documents, insights from past successful deals, and summaries of account details—including customer buying behavior, recent activity, and more.
Microsoft Copilot for Sales helps teams deliver more seamless experiences within Microsoft Teams and Outlook. New features include suggested updates to customer relationship management (CRMs) systems as sellers work and suggested responses based on customer questions across platforms.
Microsoft Dynamics 365 Customer Insights empowers every organization to unify and enhance customer data, using it for insightful analysis and intelligent actions. New features now make it easier and faster to ingest and manage data, while AI enables quick insights and easier access to analytics.
Microsoft Dynamics 365 Finance includes more autonomous finance features, building intelligence, automation, and analytics around every business process. This release adds AI-powered experiences to ease setup of financial dimension defaulting.
See what AI can do for you
Microsoft customers are already doing amazing things with the new AI features in Dynamics 365, and we can’t wait to inspire you with their stories. Register now and join us to see what’s new in the 2024 release wave 1.
This article is contributed. See the original author and article here.
HLS Copilot Snacks are the perfect way to learn how to use Copilot to boost your productivity and reduce your workload.
In this snackable you will learn how to quickly take a professional journal publication in PDF format and convert it to Microsoft Word where you can use Copilot to query and summarize the contents. Then you will learn how to turn that professional journal publication and leverage Copilot to create a PowerPoint presentation in order to present its contents to colleagues and staff.
This article is contributed. See the original author and article here.
We’re thrilled to announce our first community stand-up – a live stream event tailored for users of Azure API Management and API Center. Join us for an engaging session where we’ll delve into the latest trends in the industry, product updates, and best practices.
Insights into the API industry: Our product team will share their perspectives on the latest trends in the API industry.
Azure API Management and API Center updates: Discover the latest features and updates to our services. Learn how these advancements can benefit your organization and enhance your API management practices.
Guest session – “Designing an active-active global API platform” by Stephane Eyskens: Hear from Stephane how he architected and chaos-tested a resilient API management platform.
Interactive Q&A session: Do you have a burning question about our products or are you looking to provide feedback? This is your chance! Join our live Q&A session to get answers directly from our team.
Networking opportunities: Connect with fellow API management practitioners in the chat, exchange ideas, and learn from each other’s experiences.
How to Join
Simply tune into our live stream in the Microsoft Azure Developers channel on YouTube at the scheduled date and time. You can select the “Notify me” button to receive a reminder before the event starts.
Don’t miss out on this exciting opportunity to engage with our product team and fellow API Management and API Center users. Mark your calendars and we’ll see you there!
This article is contributed. See the original author and article here.
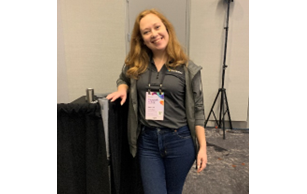
The Microsoft AI Tour in San Francisco and New York brought together developers, MVPs, and other technology enthusiasts to learn about the latest AI technologies and tools from Microsoft.
At these Microsoft AI Tour stops, MVP volunteer staffers were a driving force behind the event’s success, using their passion for technology and AI to engage with the community and share their knowledge and expertise. Fueled by their unrelenting passion for technology and AI, MVP staff were an integral part of Microsoft’s groundbreaking journey into the AI era. MVP Staffers were ravenous to learn about the latest AI technologies and tools from Microsoft, such as Microsoft Fabric and Copilot. They saw the event as an irresistible opportunity to engage with the AI community, share their knowledge, and make new connections. MVP Staffers also relished interacting with the attendees, answering technical questions, and discussing attendees’ challenges and visions for the future of AI. MVP volunteer staffers were grateful for the chance to contribute to something larger than themselves and felt valued for their tireless efforts. They were determined to make a positive impact, help the attendees learn about the responsible use of AI, and bridge the gap between complex tech and easy and engaging tools. MVPs were also inspired by hearing Satya’s visionary talk about the roadmap and commitment for AI. Data Platform MVP and San Francisco Connection Hub Volunteer Armando Lacerda stated, “As a Microsoft MVP, I had the opportunity to share the latest updates on Microsoft’s AI tools with attendees at the tour. Seeing their excitement as they discovered the potential of these user-friendly tools was priceless and made the experience worth attending.”
Leveraging their expertise and passion, MVP volunteers also proctored workshops on cutting-edge tools like Microsoft Fabric and Copilot Studio, guiding attendees through hands-on lab exercises, answering their questions, and showcasing the features and benefits of these revolutionary tools. As Business Applications MVP and New York Workshop Proctor Azure McFarlane stated “Given it was an event open to the public, there were people from all backgrounds – tech and non-tech alike – people are genuinely excited about how they can gain more AI skills to use in daily life. It feels great to be able to help people navigate new tools.”
At the Connection Hub, MVP volunteers staffed the topic-specific booths, introducing attendees to the vast array of AI technologies and tools from Microsoft and explaining how the tools can be applied in different scenarios and sectors to transform the way we work and live. Connection Hub staffers also highlighted the wealth of online learning resources available from Microsoft, such as Microsoft Learn, and guided attendees on how to access and use these resources to gain more AI skills and knowledge, empowering them to take their first steps into the exciting world of AI.
Though overall a positive experience, MVP staffers at the Microsoft AI Tour encountered several challenges in these early tour stops. Some staffers felt that a briefing with the Microsoft Product team for Fabric and Copilot in advance of the event would have been immensely helpful in better equipping them for attendee questions. Several MVPs who proctored the workshops on Microsoft Fabric and Copilot Studio encountered difficulties in addressing the diverse queries of the attendees, who had varied backgrounds and levels of technical expertise. MVP staffers also felt that the workshops would have benefited from more proctors, and that the attendees were not clear on what the end result would be. Developer Technologies MVP and Connection Hub New York Volunteer Jose Columbie stated “One of the main challenges I faced was the diversity of the attendees’ backgrounds and levels of technical expertise. Tailoring explanations and demonstrations to suit different audiences, from AI novices to seasoned professionals proved to be difficult.”
MVP volunteers enjoyed spending time networking and connecting with others in the AI community. M365 MVP and New York Workshop Proctor Abhijeet Jadhavstated “The Microsoft AI Tour was well-planned and provided opportunities for engagement. I felt a sense of purpose in contributing to something larger and valued for their efforts. In terms of the entire event, it was very well planned and executed. There were ample opportunities provided to connect and engage with other participants.”
Despite facing some challenges, MVP staff had a positive experience and were eager to continue their journey with Microsoft into the AI era. You too can attend the upcoming Microsoft AI Tour events to discover the latest AI technologies and tools from Microsoft. Be sure to visit the event’s Microsoft Learn page , where you can participate in the Microsoft AI Tour Cloud Skills Challenge and gain more AI skills and knowledge. Take advantage of these opportunities to expand your knowledge and skills in the exciting world of AI.
This article is contributed. See the original author and article here.
For over a decade, Microsoft has embarked on a mission to bring together our sophisticated software capabilities with innovative hardware solutions. We’ve collaborated with businesses, IT professionals, end users and executives at different levels in various industries across the world to refine our portfolio and deliver powerful tools and experiences that help people be more productive.
Today, we’re introducing our latest devices, built exclusively for business, the Microsoft Surface Pro 10 and Surface Laptop 6. We designed these products from the ground up with direct input from our business customers, incorporating requested features ranging from enhanced connectivity options to advanced security and performance capabilities. These are our first AI PCs powered by the newest Intel Core Ultra processors, with a brand-new CPU and GPU, as well as an integrated neural processing unit – or NPU – for efficiently delivering AI acceleration. Engineered to work seamlessly with Copilot and Windows 11 Pro, Surface Pro 10 when paired with the new Surface Pro Keyboard and Surface Laptop 6 introduce a dedicated Copilot key1 that makes accessing generative AI experiences a click away.
To further empower our IT pros and admins, we’re also announcing updates to our Surface Management Portal, a new Surface IT Toolkit app that brings together our important IT tools, and more. Let’s take a look.
Designed with zero-trust, from chip to cloud
The new Surface Pro 10 and Surface Laptop 6 have Zero Trust security built-in from chip to cloud. As Secured-core PCs, they use the best from Windows 11 Pro and advanced hardware features to help protect the device, your identity and data. Core to our design, we use built-in capabilities across hardware, firmware, and software – deployed and managed by cloud tools like Microsoft Intune2 to enable class-leading protection while removing complexity.
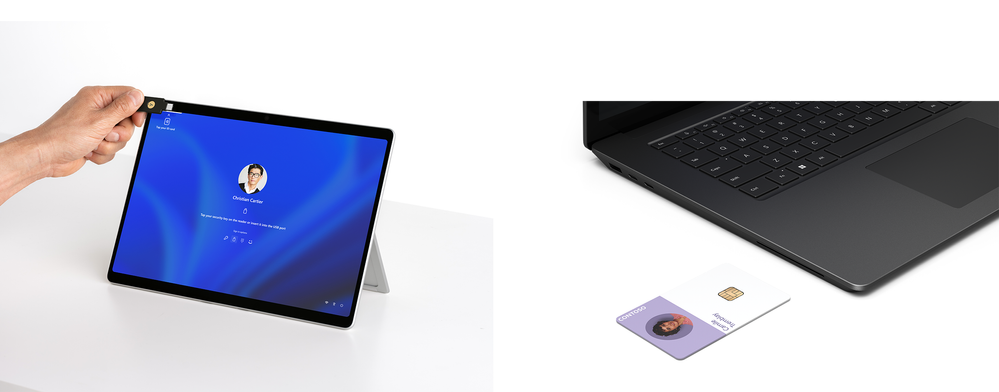
To further enhance our hardware security options, Surface Pro 10 now includes near field communication (NFC) to facilitate secure, multi-factor authentication. Additionally, select models of the Surface Laptop 6 offer optional integrated smart card readers.3 Both devices also come with Windows Hello Enhanced Sign-in Security, which adds an extra layer of protection by using specialized hardware and software to isolate and safeguard authentication data and ensure its secure transmission.
Figure 1. NFC-based authentication with NFC and optional smart card reader on Surface Laptop 6
Versatile to get work done anywhere
The new Surface Pro 10 and Surface Laptop 6 offer the flexibility to work from anywhere. Both devices come with our industry-leading 3:2 display combined with the PixelSense™ touchscreen giving more room for work to thrive with the intuitiveness of touch. Color remains vivid, indoors and out, thanks to anti-reflective technology that reduces reflection by up to 50%. Keep an eye out for a deep dive into this technology in a future blog.
Figure 2. Surface Pro 10 with anti-reflective technology
When it comes time to connect and collaborate, Surface Pro 10 features a Surface Studio Camera with a 114-degree ultrawide field of view, while the Laptop 6 comes with a 1080p Surface Studio Camera. Both devices use AI-accelerated Windows Studio Effects, like background blur and automatic framing, to help you stay front and center in your meetings.
Figure 3. Inking with Surface Slim Pen on the Surface Pro 10
High-quality Studio Mics with Voice Focus and Omnisonic® speakers elevate the audio experience along with AI-enhanced dictation in Microsoft 365 apps. Need to take notes, whiteboard an idea with a colleague, or sketch a draft of your next project? The Surface Slim Pen4 offers a natural and fluid writing experience, akin to using pen on paper.
Empower your workforce with unparalleled flexibility through 5G on the Surface Pro 10 —coming later this year.5 From coffee shop calls to on-site proposals, the Surface Pro 10 effortlessly meets your dynamic work demands.
Access to Copilot, at your fingertips
A standout upgrade in Surface Pro 10 and Surface Laptop 6 is the Copilot key, 1 which gives you quick access to Copilot in Windows, so you can work smarter, be more productive, and boost your creativity. Copilot in Windows serves as an AI assistant for everyday tasks, streamlining your workflow with personalized support, contextual assistance, insights, and suggestions. Surface lets you engage with Copilot in ways that are natural and intuitive through keyboard, pen, touch, and voice. This allows you to stay in your flow and maintain focus on the task at hand.
Figure 4. New Copilot available on Surface Laptop 6 and Surface Pro 10
Intel Core Ultra processors enable powerful performance and new AI experiences
The Surface Pro 10 and Surface Laptop 6 are among the first commercial devices to deliver the all-new Intel® Core™ Ultra processors. Unleash productivity thanks to a new architecture that delivers superior power-efficient performance for various, complex business workloads by sending the right task to the right engine at the right time. Intel Core Ultra processors are purpose-built for the next era of AI software, balancing AI workloads across CPU, GPU, and their latest Intel AI Boost NPU or neural processing unit.
These new processors deliver impressive results, with up to 1.5 times faster graphics performance and up to 21% faster multitasking on Surface Pro 10 with Intel Core Ultra 76 compared to the Surface Pro 9. Surface Laptop 6, now with an Intel Core Ultra H processor and up to 64 GB of RAM, is more powerful than the Surface Laptop 5, delivering up to 2x more graphics performance7 and the ability to run professional apps up to 40% faster.
Microsoft has collaborated with Intel to ensure that Intel Core Ultra processors deliver powerful and reliable performance and AI experiences for Surface and the Windows ecosystem. In addition to the Microsoft-developed Windows Studio Effects, this optimization and reliability provides an ideal platform for you to explore other AI tools and build your own AI-accelerated innovations.
Accessing Windows 365 Cloud PCs is now easier than ever
Another way the new Surface Pro 10 and Surface Laptop 6 can help you be more productive is by providing easy access to your Windows 365 Cloud PCs and Azure Virtual Desktop, Microsoft Dev Box, and more courtesy of the pre-installed Windows App. This enables you to use multiple accounts and easily switch between them, all in one app. Windows 365 securely streams your personalized Windows experience with access to all your apps, data, settings, and content from anywhere, on any device.
With the Windows App preinstalled on Surface Laptop 6 and Surface Pro 10, it’s easier than ever to deploy Cloud PCs to your team and easily enable Windows 365 Boot and Windows 365 Switch out of the box. Combine Windows 365 Boot with NFC on Surface Pro 10, and you can enable shared device scenarios, switching between users with a simple log-out, tap-in experience. Surface also provides optimal meeting experiences and superb offline alternatives. Read more about the latest Windows and Windows 365 announcements in this Windows Experiences Blog.
Enhancing IT administration with new and updated Surface tools for scalable management
If you are an IT professional or a business decision maker, you will appreciate the powerful management controls that Surface devices have built into Microsoft Intune, the cloud-based service that lets you manage and secure your devices, apps, and data. With Intune admin center, not only can you configure and deploy your devices, but you gain access to the Surface Management Portal.
Part of our Surface Management and Support Suite, this powerful portal provides a custom experience to manage your Surface devices at scale, with new, rich device insights views, details for warranty coverage and active support cases, a new repair and service order experience, and more. Looking to learn more about the carbon emissions of your Surface fleet? The Carbon Emissions Estimator tool included in the Surface Management Portal helps you estimate the carbon impact of your devices.
For organizations not yet utilizing Intune, the Microsoft 365 admin center offers a comparable management solution through the Surface Support Portal. Stay tuned for an upcoming blog detailing the latest updates to the Surface Management and Support Suite.
Figure 5. Updates and enhancements coming to the Surface Management Portal
To complement your cloud and traditional management needs, we’ve also developed the new Surface IT Toolkit, which provides a consolidated console for configuration and technician tools, including Device Recovery for USB-based re-imaging, UEFI configuration for hardware settings, Data Eraser for information compliance, and more.
Figure 6. All new Surface IT Toolkit
The app provides IT pros and admins with simplified, guided experiences to help you configure, update, or troubleshoot your devices. Not only does it provide a centralized location, the Surface IT Toolkit also ensures you are using the latest versions of our tools and installers. You don’t need to worry about outdated or incompatible versions, the app automatically checks for updates and downloads them for you.
We’ll provide more details in an upcoming blog when the Surface IT Toolkit is released.
New repairability experience
This generation of commercial devices marks a significant improvement in repairability.8 Visual guidelines help you easily identify how many and what type of fasteners are needed for replaceable components. By scanning available QR codes on parts inside each device, you are linked to a detailed online service guide. In combination with our tools, warranty and coverage options, these advancements in repair simplification are helping us deliver experiences essential for helping your business thrive with Surface.
Figure 7. Surface Pro 10 (left) and Surface Laptop 6 are more repairable
Microsoft Adaptive Accessories now available for businesses
Today, we’re also announcing the coming availability of the Microsoft Adaptive Accessories to commercial customers in select markets. Highly adaptable and accessible by design, explore these easy-to-use accessories that let you customize your own mouse, keyboard inputs, and shortcuts in ways that work best for you. With Microsoft Adaptive Accessories, one size fits one — you — and empowers you to increase productivity and use your favorite apps more effectively. For a set up that is truly unique to you, discover a selection of additional designs that you can 3D print through Shapeways. 910 To learn more about our available accessible accessories, head to Microsoft Accessible Accessories.
Pre-order the new Surface Pro 10 and Surface Laptop 6 for business today
Surface Pro 10 and Surface Laptop 6 are built for business and optimized for Microsoft productivity experiences with quick access to your everyday AI companion, Microsoft Copilot. They’re versatile, powerful, secure, and easy to manage and service. They’re also designed to work seamlessly with Windows 365 Cloud PCs, giving you the flexibility to access your personalized Windows experience from the cloud. We will be detailing some of these announcements in upcoming blogs and technical deep dives, so be sure to subscribe.
You can pre-order Surface Pro 10 and Surface Laptop 6 in select markets today and they will start shipping to customers on April 9th. Connect with your preferred authorized Surface commercial reseller and learn more by heading to surface.com/business or head to the Microsoft Store:
1. Copilot in Windows (in preview) is available in select global markets and will be rolled out to additional markets over time. Learn more. Copilot with commercial data protection is available at no additional cost for users with an Entra ID with an enabled, eligible Microsoft 365 license. When Copilot in Windows is not enabled on the device, pressing the Copilot key will launch Windows Search. See aaka.ms/WindowsAIFeatures.
2. Requires license or subscription (sold separately) to activate and use.
3. Integrated smart card reader available only on Surface Laptop 6 in Black in one of these configurations: 15″ 5/16/512, 7/16/256, 7/16/512, 7/32/512 and only in US and Canada.
4. Sold Separately.
5. Surface Pro 10 with 5G will be available later in 2024 and not available in all areas. eSIM and 5G support are also not available in all areas; compatibility and performance depend on carrier network, plan and other factors. See carrier for details and pricing.
6. Based on 3D Mark TimeSpy benchmark measuring graphic performance compared to Surface Pro 9 (Intel).
7. Based on 3DMark TimeSpy benchmark measuring graphic performance compared to Surface Laptop 5. Measured on Surface Briggs with Intel® Core™ Ultra 7.
8. Replacement components available through Surface Commercial authorized device resellers. Components can be replaced on-site by a skilled technician following Microsoft’s Service Guide. Microsoft tools (sold separately) may also be required. Availability of replacement components and service options may vary by product, market and over time. See Surface service options – Surface | Microsoft Learn. Opening and/or repairing your device can present electric shock, fire and personal injury risks and other hazards. Use caution if undertaking do-it-yourself repairs. Unless required by law, device damage caused during repair will not be covered under Microsoft’s Hardware Warranty or protection plans.
9. 3D print services provided and warrantied exclusively by Shapeways, Inc. subject to Shapeways Sales Terms and Conditions and Warranty at: https://aka.ms/ShapewaysTermsConditions. Microsoft is not responsible for their performance or compliance with applicable regulatory, compliance, safety or any other requirements.
10. Available 3D designs from Shapeways may vary from image shown and over time. See Get Started with 3D Printing for the latest offerings.
This article is contributed. See the original author and article here.
At a digital event for commercial customers and partners, we shared an update on how we’re empowering organizations to advance in the new era of work with Microsoft Copilot, Windows, and two new Surface devices that will start to become available in April.
This article is contributed. See the original author and article here.
Buenas,
Es un placer para nosotros, Bruno y Francis Nicole, compartir con ustedes nuestras impresiones sobre el primer episodio de la serie AI + .NET LATAM que tuvimos el honor de presentar la semana pasada junto con Ivana y Pablo.
El episodio inaugural de nuestra serie se centró en cómo la inteligencia artificial (IA) está revolucionando el mundo del desarrollo en .NET. Abordamos temas cruciales y compartimos recursos valiosos que, creemos, serán de gran utilidad para los desarrolladores interesados en esta área.
Semantic Kernel con Heroes: Exploramos el repositorio de GitHub ‘understanding-semantic-kernel-with-heroes’, donde demostramos cómo utilizar los polyglot notebooks para aprender los fundamentos del Semantic Kernel.
GPT-RAG en Azure: Discutimos el proyecto ‘GPT-RAG’ de Azure, que ilustra cómo habilitar Azure OpenAI a escala empresarial de manera segura, utilizando un patrón de Generación Aumentada por Recuperación.
Formación Profesional en Azure 2024: Presentamos el programa de formación profesional de Azure para el año 2024, una oportunidad imperdible para aquellos que buscan profundizar sus conocimientos en IA y servicios en la nube.
Control de Computadoras con OptiKey: Mostramos cómo OptiKey permite el control completo de computadoras y la comunicación mediante el uso de la mirada, abriendo nuevas posibilidades para la accesibilidad.
Creación de Asistentes con Azure OpenAI Service: Ofrecimos una guía sobre cómo crear asistentes virtuales utilizando el servicio Azure OpenAI, proporcionando un camino claro para la integración de IA en aplicaciones.
AI-in-a-Box: Analizamos el notebook ‘assistant-wind_farm’ que forma parte del proyecto AI-in-a-Box, destacando cómo la IA puede optimizar la gestión y operación de parques eólicos.
Para aquellos que no pudieron asistir al evento en vivo, hemos puesto a disposición todos los recursos mencionados y la grabación del episodio en los enlaces proporcionados. Les animamos a explorarlos y a sumergirse en el fascinante mundo de la IA y .NET.
Este primer episodio ha sido solo el comienzo de un viaje apasionante. Nos llena de entusiasmo ver la participación y el interés de la comunidad, y estamos comprometidos a seguir proporcionando contenido de calidad que impulse el conocimiento y la innovación.
Les agradecemos su apoyo y esperamos verlos en los próximos episodios.
This article is contributed. See the original author and article here.
Since we first introduced Copilot to our earliest customers, we’ve been closely studying how people are using AI at work—what’s going well, where there are challenges, and what early behaviors can teach us about adopting and rolling out AI broadly. And we want to share what we’re learning with leaders who are looking to drive AI adoption with their own people.
This article is contributed. See the original author and article here.
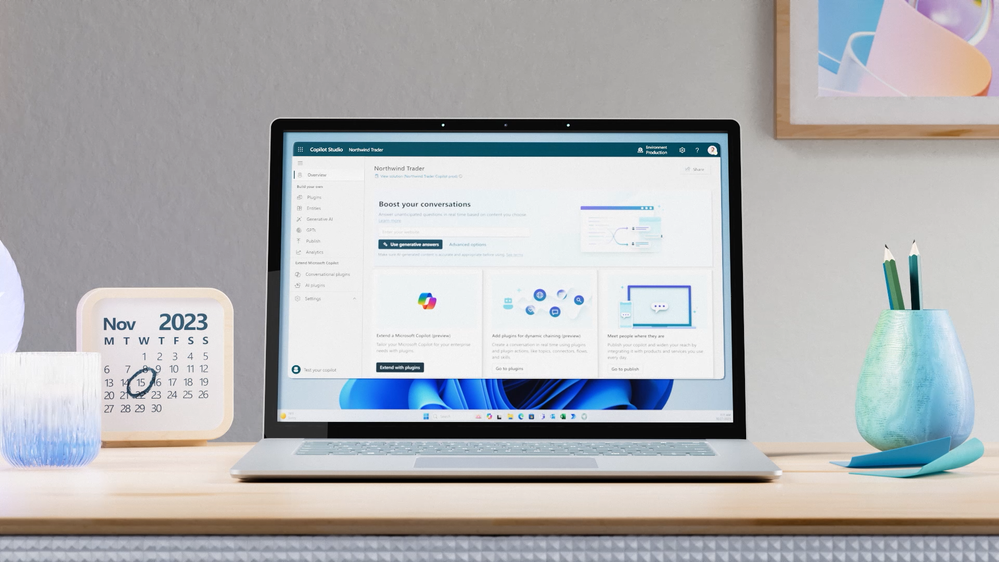
Copilot Studio app window open on the screen of a laptop on a table
Customizing Copilot for Microsoft 365 with Copilot Studio
Copilot for Microsoft 365 is your everyday AI companion that helps you create, find, and ask for information across Microsoft 365 apps. Whether you need to summarize a document, find relevant data, or generate content, Copilot can help you get things done faster and smarter. But what if you want to tailor Copilot to work the way you need, with your data, processes, and policies? That’s where Copilot Studio comes in.
Introduced in November 2023, Microsoft Copilot Studio is a low-code conversational AI platform that enables you to extend and customize Copilot for Microsoft 365 with plugins, as well as build your own copilots. Plugins are reusable building blocks that allow Copilot to access data from other systems of record, such as CRM, ERP, HRM and line-of-business apps, using 1200+ standard and premium connectors. You can also use plugins to incorporate your unique business processes into Copilot, such as expense management, HR onboarding, or IT support. And you can use plugins to control how Copilot responds to specific questions on topics like compliance, HR policies, and more.
Copilot Studio provides a visual canvas to create plugins, publish and manage them centrally, and secure them with the right access, data controls, and analytics. This is included in your Copilot for Microsoft 365 subscription and available in public preview today.
How Copilot Studio works
Let’s talk through how Copilot Studio in Copilot for Microsoft 365 works in action. Imagine you want to know how much of your team’s travel budget is left for the rest of the quarter. You ask Copilot in the chat, but it can’t answer because the data you’re looking for resides in your SAP system. With Copilot Studio, you can customize Copilot to connect to your SAP system and retrieve the information you need.
You start by launching Copilot Studio from within Copilot. You give your plugin a description, such as “providing richer details on expense questions”. You then choose the connectors you want to use, such as SAP or SharePoint (where perhaps your travel policy is stored). You can also use connectors to other data sources, such as websites, Azure services, or even OpenAI’s GPTs. You then design the logic and flow of your plugin, using conditions, variables, and actions. You can also specify how you want Copilot to generate responses, using natural language templates or expressions.
Once you’re done building your plugin, you hit publish. Copilot Studio will automatically create a metadata trigger for your plugin, so that Copilot knows when to use it. You can also manage your plugin settings, such as who can access it, what data is collected, and how it is monitored. And the best part is, you only need to build your plugin once, and it can be reused across your organization.
Now, when you go back to Copilot and ask the same question, Copilot will use your plugin to access your SAP data and give you the answer you were looking for. You can see how Copilot Studio can help you create rich and relevant experiences with Copilot, using your data and processes.
How Copilot studio will evolve in the future
Copilot Studio is a powerful tool for creating conversational plugins so you can tailor Copilot for Microsoft 365 to work the way you do, with the business data you use. While in preview, we are continuing to build Copilot Studio’s capabilities so you can enable richer and broader use cases. Over the next several months, Copilot Studio will evolve to include capabilities and features like –
Plugins that can interact with the user – for example, by posing questions or presenting options and input boxes. Today, plugins are single-turn – Meaning, they can take in a user question and either, search over content to provide an answer, or possibly call a Power Platform Connector or flow to get information.
Secure and seamless access to SharePoint and other Microsoft services, on behalf of the user. This will expand the range of scenarios Copilot Studio can support, such as accessing documents, calendars, emails, or other organization data that requires end-user credentials.
More granular admin control on which users in the organization can use, create, or edit a plugin. Currently, plugin capability is controlled by the MAC Admin in an ‘all-or-none’ fashion and an admin can enable copilot studio plugins ‘as a category’ to a limited group of individuals for trials.
Test control for plugins, so you can easily debug and validate plugins before publishing. This will also allow you to preview how your plugin will look and behave in Copilot for Microsoft 365 and make any adjustments as needed.
We are excited about the potential of Copilot Studio to create rich experiences with Copilot for Microsoft 365, using your data and processes and appreciate your ongoing feedback and suggestions as we continue to improve the experience. Stay tuned for more updates at Microsoft Build.
What else can you do with Copilot Studio?
Copilot Studio is a great way to customize Copilot for M365 to work with your data outside Microsoft 365. But that’s not all. If you’re interested in building your own custom copilot to provide generative AI experiences that Copilot for Microsoft 365 isn’t designed for, there is a separate Copilot Studio license, generally available, that allows you to build your own conversational copilots for customers or employees and publish it on any channel of your choice, such as websites, SharePoint sites, social media, and more. Organizations look to build their own copilot if they want to provide Gen AI experiences on channels not offered within Copilot for Microsoft 365 or would like to design employee and/or customer facing gen ai experiences. You can get started quickly designing a copilot with topics, plugins, automation and out of the box generative AI, allowing you to see value fast. You can even design the copilot with specific rules based dialog for greater control.
With Copilot Studio, you can create custom copilots for various scenarios, such as enhancing customer experiences, streamlining internal functions, or building innovative solutions. For example, you can create a copilot for your external website that can help customers check in-stock items, provide a quote, or book a service. Or you can create a copilot for your SharePoint site that can help employees with HR or IT requests, such as expenses or IT tickets. Or you can create a copilot that can leverage advanced AI services, such as vision, speech, or language, to create novel applications.
Copilot Studio makes it easy and fast to build your own copilots, using a low-code interface, drag-and-drop components, and pre-built templates. You can also test and debug your copilots, and publish them with a few clicks. And you can manage and monitor your copilots, using the same IT admin center as Copilot for Microsoft 365.
Get Inspired with Use Cases
If you are wondering how you can use Copilot Studio in your organization, here are some examples to get you started.
Connect Copilot to your sales data in Salesforce and ask questions like “How many deals did I close this quarter?” or “What are the top opportunities in my pipeline?”
Connect Copilot to your HR data in Workday and ask questions like “How many vacation days do I have left?” or “What is the process for requesting a leave of absence?”
Connect Copilot to your finance data in SAP and ask questions like “What is the status of my expense report?” or “How much budget do I have left for this project?”
Create custom topics for Copilot to respond to specific questions on compliance, legal, or policy matters, such as “What are the GDPR requirements for data retention?” or “What is the company’s policy on remote work?”
Orchestrate workflows with Copilot using Power Automate, such as booking a meeting, sending an email, or creating a document.
Get started with Copilot Studio today
Copilot Studio is a powerful tool that can help you make the most of Copilot for Microsoft 365, and beyond. You can use it to connect Copilot to your data outside Microsoft 365, orchestrate workflows, and tailor Copilot responses to your business needs. You can also use it to build your own copilots, for customers or employees, and publish them on any channel of your choice. Whether you want to extend or customize Copilot, Copilot Studio can help you create conversational experiences that are rich, relevant, and intelligent.
To learn more about Copilot Studio, visit aka.ms/copilotstudio. To try it for yourself, go to aka.ms/trycopilotstudio. And don’t miss our Microsoft Build session, where we’ll share more announcements and demos.
We can’t wait to see what you create with Copilot Studio!
Continue the conversation by joining us in the Copilot for Microsoft 365 Community! Want to share best practices or join community events? Become a member by “Joining” the Microsoft 365 community. For tips & tricks or to stay up to date on the latest news and announcements directly from the product teams, make sure to Follow or Subscribe to the Copilot for Microsoft 365 Blog Space!
This article is contributed. See the original author and article here.
End of support for Project Service Automation (PSA 3.x)
In April 2022, November 2022 and April 2023 release waves we announced the availability of the first, second and third and final phase of upgrade experiences from Dynamics 365 Project Service Automation to Dynamics 365 Project Operations. With the third and final phase of upgrade experiences, it is now possible to upgrade projects of any size to Project Operations. Today, we are announcing the deprecation of Dynamics 365 Project Service Automation or PSA 3.x.
As of March 31st 2025, Microsoft will no longer be supporting the PSA application. Beyond this date, there will not be any feature enhancements, updates, bug fixes or other updates to this application. Any support ticket logged on the PSA application will be closed with instructions to upgrade to Dynamics 365 Project Operations.
We strongly encourage all customers of PSA application to start planning your upgrade process as soon as possible so you can take advantage of many new Project Operations features such as:
Integration with Project for the Web with many new advanced scheduling features
Project Operations was first released in October 2020 as a comprehensive product to manage Projects from inception to close by bringing together the strengths of Dataverse, F&O and Project for the web assets. Want to learn more about Project Operations? Check this link and navigate to our detailed documentation!
Want to try Project Operations? Click here and sign up for a 30 days trial!


Recent Comments