This article is contributed. See the original author and article here.
Knowledge is the lifeblood of customer service organizations. Timely access to the most accurate and relevant knowledge articles critically influences agents’ productivity and ability to deliver exceptional customer support and boost CSAT scores.
Agents rely on the availability of an up-to-date knowledge base. Additionally, they bring a wealth of tacit insights and personal competency to troubleshoot and resolve customer cases. However, once resolved, these valuable knowledge insights remain trapped unless documented by someone—whether knowledge authors or agents. This process requires additional effort, time, and specialized writing skills. It may also be outside the agents’ core priorities, especially in high-velocity support operations.
Harvesting such tacit knowledge insights from resolved cases into mainstream knowledge articles can significantly help other agents discover and reuse them, accelerating overall knowledge sharing.
Introducing knowledge draft assist in Dynamics 365 Customer Service
We’re thrilled to announce the launch of knowledge draft assist, now in preview. This Copilot feature helps agents generate knowledge draft proposals from resolved case data.
How does it work?
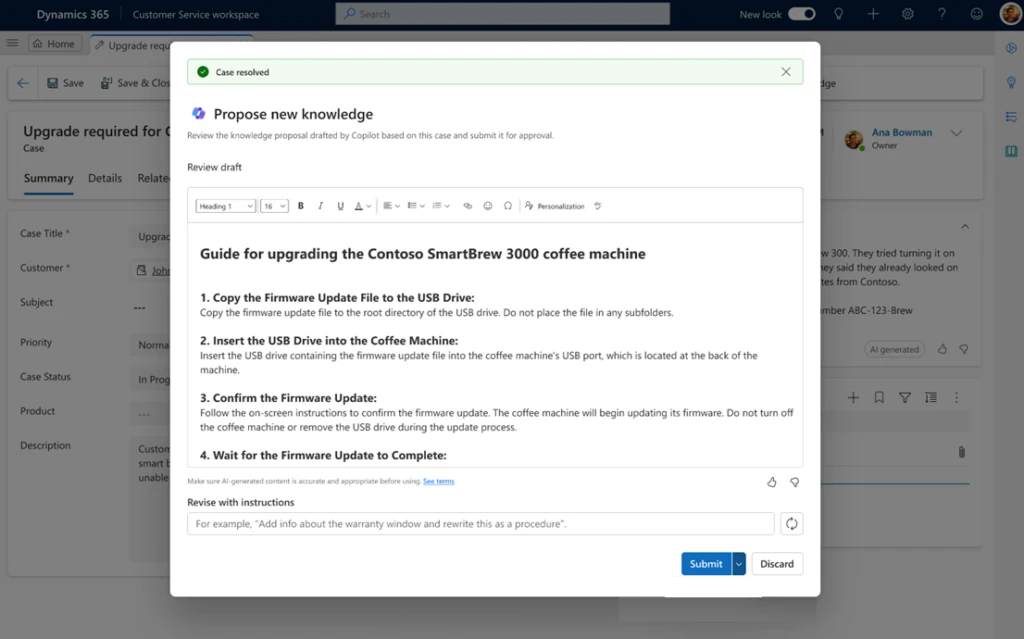
As the agent resolves a case, they can now click the Propose new knowledge using this case checkbox. This triggers Copilot to auto-generate an initial knowledge draft from a set of important case data. Copilot uses case descriptions, email exchanges, summaries, and agent notes to quickly draft a knowledge article. The agent can further revise the article using multi-turn prompts in natural language.
This auto-generated knowledge draft encompasses symptoms, root causes, troubleshooting steps, and insights. The draft adheres to industry-standard Knowledge-Centered Service (KCS) format. The agent can validate the draft and send it for further content quality and compliance checks to downstream reviewers for approval and publishing.
Next-generation AI that is ready for enterprises
Microsoft Azure OpenAI Service offers a range of privacy features, including data encryption and secure storage. It also allows users to control access to their data and provides detailed auditing and monitoring capabilities. Microsoft Dynamics 365 is built on Azure OpenAI, so enterprises can rest assured that it offers the same level of data privacy and protection.
AI solutions built responsibly
We are committed to creating responsible AI by design. Our work is guided by a core set of principles: fairness, reliability and safety, privacy and security, inclusiveness, transparency, and accountability. We are putting those principles into practice across the company to develop and deploy AI that will have a positive impact on society.
Learn more about drafting knowledge articles with Copilot
This article is contributed. See the original author and article here.
Knowledge is the lifeblood of customer service organizations. Timely access to the most accurate and relevant knowledge articles critically influences agents’ productivity and ability to deliver exceptional customer support and boost CSAT scores.
Agents rely on the availability of an up-to-date knowledge base. Additionally, they bring a wealth of tacit insights and personal competency to troubleshoot and resolve customer cases. However, once resolved, these valuable knowledge insights remain trapped unless documented by someone—whether knowledge authors or agents. This process requires additional effort, time, and specialized writing skills. It may also be outside the agents’ core priorities, especially in high-velocity support operations.
Harvesting such tacit knowledge insights from resolved cases into mainstream knowledge articles can significantly help other agents discover and reuse them, accelerating overall knowledge sharing.
Introducing knowledge draft assist in Dynamics 365 Customer Service
We’re thrilled to announce the launch of knowledge draft assist, now in preview. This Copilot feature helps agents generate knowledge draft proposals from resolved case data.
How does it work?
As the agent resolves a case, they can now click the Propose new knowledge using this case checkbox. This triggers Copilot to auto-generate an initial knowledge draft from a set of important case data. Copilot uses case descriptions, email exchanges, summaries, and agent notes to quickly draft a knowledge article. The agent can further revise the article using multi-turn prompts in natural language.
This auto-generated knowledge draft encompasses symptoms, root causes, troubleshooting steps, and insights. The draft adheres to industry-standard Knowledge-Centered Service (KCS) format. The agent can validate the draft and send it for further content quality and compliance checks to downstream reviewers for approval and publishing.
Next-generation AI that is ready for enterprises
Microsoft Azure OpenAI Service offers a range of privacy features, including data encryption and secure storage. It also allows users to control access to their data and provides detailed auditing and monitoring capabilities. Microsoft Dynamics 365 is built on Azure OpenAI, so enterprises can rest assured that it offers the same level of data privacy and protection.
AI solutions built responsibly
We are committed to creating responsible AI by design. Our work is guided by a core set of principles: fairness, reliability and safety, privacy and security, inclusiveness, transparency, and accountability. We are putting those principles into practice across the company to develop and deploy AI that will have a positive impact on society.
Learn more about drafting knowledge articles with Copilot
This article is contributed. See the original author and article here.
In the quickly changing world of AI, Microsoft Dynamics 365 Business Central is leading the way with innovations that have equipped more than 30,000 small and medium-sized businesses to succeed. Powered by next-generation AI, Microsoft Copilot in Dynamics 365 Business Central introduces new ways to streamline workflows, boost productivity, and unlock creativity. At a time when nine out of ten people want simpler ways to automate daily tasks, Copilot helps to free time so employees can focus on their most meaningful work.
Copilot in Business Central is your everyday AI companion, helping you to speed through tasks, build momentum, and improve the way work gets done. With Copilot, you can:
Get answers quickly and easily using natural language.
Spark creativity with creative content ideas.
Save time by automating tedious, repetitive tasks.
Anticipate and overcome business challenges.
Reclaim time for important work
In a small or medium-sized business, there is often a lot to do and not enough people to get it all done. Everyday activities like tracking down documents and bringing new employees up to speed can drain your valuable time. Conversational chat using Copilot in Business Central helps you answer questions quickly and easily, locate records faster, and even learn new skills—all using natural language. Save time and effort by navigating to documents without having to use traditional menus, and rapidly onboard new users with answers to questions on how, when, or why to do things.
Unlock creativity with marketing text suggestions
Copilot in Business Central helps product managers to banish writer’s block and drive sales with compelling AI-generated marketing text suggestions. Using key attributes already in Business Central like color and material, Copilot can create product descriptions in seconds tailored to your preferred tone, format, and length. Once you’ve made any adjustments, you can easily publish to Shopify or other ecommerce platforms with just a few clicks.
Simplify the sales order process
Creating or updating customer orders can be a tedious process, often requiring repetitive lookups or navigating through extensive product catalogs. To quickly add items to a sales quote or order, Copilot enables you to describe the goods or services needed, paste in relevant details from an email, or reference a previous order. Based on your prompt, Copilot then suggests line items from your product catalog. By streamlining the order taking process, Copilot frees time for sales teams to focus on building relationships and delivering exceptional customer experiences.
Automate workflows quickly and easily
Streamlining business processes is easier than ever with Copilot helping to create Microsoft Power Automate flows using natural language. Users can simply express their needs directly in Business Central, and Copilot drafts an initial automation flow for you. You can continue refining the flow in Power Automate with Copilot by your side, streamlining the process of tailoring best-practice workflows to your business.
Nine out of ten people want simpler ways to automate daily tasks so they can focus on the work that matters.1
Streamline month end with enhanced bank reconciliation
Reconciling bank transactions has traditionally been a time-consuming monthly task, especially with complex scenarios where multiple charges consolidate into a single transaction. Copilot in Business Central makes bank reconciliation easier by analyzing bank statements that you import into Business Central, matching transactions, and proposing entries for transactions that weren’t auto-matched. By comparing and interpreting transaction descriptions, amounts, dates, and patterns across fields, Copilot can help you improve the accuracy of your financial records while reducing manual effort.
Keep finances organized with e-invoice matching
Say goodbye to hours spent manually merging incoming e-invoices with outstanding purchase orders. Using rule-based matching and assistance from Copilot, you can quickly compare and map incoming e-invoices to your open orders. Save time and keep your accounts payable current, all while building positive supplier relationships with on-time payments.
Make data-driven decisions with analysis assistance
Business Central has powerful built-in capabilities to create analytical views of data, but manually constructing those views requires time and skill. Copilot simplifies analysis by transforming raw data into clear views with totals, grouping, pivots, and filters—all from simple text instructions and without ever leaving Business Central. Prompted by just a simple sentence, Copilot can identify trends and anomalies in your data, helping you make data-driven decisions that propel your business forward.
Boost customer service with inventory forecasting
Effective inventory management is crucial in a competitive business environment as it can significantly influence a company’s success and customer retention. This process involves balancing customer service with cost control. Maintaining low inventory reduces working capital, but risks missing sales due to stock shortages. Using AI, the sales and inventory forecast extension uses past sales data to forecast future demand, helping to prevent stockouts. Once a shortfall is identified, Business Central streamlines the replenishment process by generating vendor requests, helping you keep your customers happy by fulfilling their orders on time.
Reduce risk with late payment prediction
Managing receivables effectively is vital for a business’s financial wellbeing. With the late payment prediction extension, you can reduce outstanding receivables and refine your collections approach by forecasting if outstanding sales invoices are likely to be paid on time. For instance, if a payment is anticipated to be delayed, you could modify the payment terms or method for that customer. By proactively addressing potential late payments and adapting accordingly, you can minimize overdue receivables, reduce risk of non-payment, and ultimately improve your financial performance.
Improve financial stability with cash flow analysis
Powered by AI, Business Central can create a comprehensive cash flow analysis to help you monitor your company’s cash position. Cash flow is a critical indicator of a company’s solvency, and cash flow analysis is an important future-focused planning tool that helps you maintain control over your financial health and make proactive adjustments to meet your financial commitments. With insights from Business Central, you can pivot quickly to safeguard your company’s fiscal wellbeing, such as by obtaining loans to cover cash shortfalls or cutting back on credit when you have surplus cash.
Transform the way work gets done with Copilot in Business Central
Copilot gives your company an edge with AI-powered innovations that are a catalyst for unleashing human potential, fostering creativity, and driving efficiency in ways previously unimaginable. The integration of AI into everyday business processes is not just about staying ahead in a competitive market, it’s about redefining what’s possible in the workplace. With Dynamics 365 Business Central, your company is empowered to navigate today’s complex business environment with agility, precision, and a renewed focus on what truly matters.
Dynamics 365 Business Central
Work smarter, adapt faster, and perform better with Business Central.
This article is contributed. See the original author and article here.
Microsoft Places—available today in public preview—is an AI-powered app that coordinates when you’re planning to come in and where you’ll work, enables improved connections with coworkers, and optimizes the effectiveness and engagement of the workplace. Importantly, Places features are accessible across surfaces you regularly use for coordination and collaboration, like Outlook and Microsoft Teams, so flexible work coordination and connection can happen within your normal flow of work.
This article is contributed. See the original author and article here.
In the quickly changing world of AI, Microsoft Dynamics 365 Business Central is leading the way with innovations that have equipped more than 30,000 small and medium-sized businesses to succeed. Powered by next-generation AI, Microsoft Copilot in Dynamics 365 Business Central introduces new ways to streamline workflows, boost productivity, and unlock creativity. At a time when nine out of ten people want simpler ways to automate daily tasks, Copilot helps to free time so employees can focus on their most meaningful work.1
Copilot in Business Central is your everyday AI companion, helping you to speed through tasks, build momentum, and improve the way work gets done. With Copilot, you can:
Get answers quickly and easily using natural language.
Spark creativity with creative content ideas.
Save time by automating tedious, repetitive tasks.
Anticipate and overcome business challenges.
Reclaim time for important work
In a small or medium-sized business, there is often a lot to do and not enough people to get it all done. Everyday activities like tracking down documents and bringing new employees up to speed can drain your valuable time. Conversational chat using Copilot in Business Central helps you answer questions quickly and easily, locate records faster, and even learn new skills—all using natural language. Save time and effort by navigating to documents without having to use traditional menus, and rapidly onboard new users with answers to questions on how, when, or why to do things.
Unlock creativity with marketing text suggestions
Copilot in Business Central helps product managers to banish writer’s block and drive sales with compelling AI-generated marketing text suggestions. Using key attributes already in Business Central like color and material, Copilot can create product descriptions in seconds tailored to your preferred tone, format, and length. Once you’ve made any adjustments, you can easily publish to Shopify or other ecommerce platforms with just a few clicks.
Simplify the sales order process
Creating or updating customer orders can be a tedious process, often requiring repetitive lookups or navigating through extensive product catalogs. To quickly add items to a sales quote or order, Copilot enables you to describe the goods or services needed, paste in relevant details from an email, or reference a previous order. Based on your prompt, Copilot then suggests line items from your product catalog. By streamlining the order taking process, Copilot frees time for sales teams to focus on building relationships and delivering exceptional customer experiences.
Automate workflows quickly and easily
Streamlining business processes is easier than ever with Copilot helping to create Microsoft Power Automate flows using natural language. Users can simply express their needs directly in Business Central, and Copilot drafts an initial automation flow for you. You can continue refining the flow in Power Automate with Copilot by your side, streamlining the process of tailoring best-practice workflows to your business.
Nine out of ten people want simpler ways to automate daily tasks so they can focus on the work that matters.1
Streamline month end with enhanced bank reconciliation
Reconciling bank transactions has traditionally been a time-consuming monthly task, especially with complex scenarios where multiple charges consolidate into a single transaction. Copilot in Business Central makes bank reconciliation easier by analyzing bank statements that you import into Business Central, matching transactions, and proposing entries for transactions that weren’t auto-matched. By comparing and interpreting transaction descriptions, amounts, dates, and patterns across fields, Copilot can help you improve the accuracy of your financial records while reducing manual effort.
Keep finances organized with e-invoice matching
Say goodbye to hours spent manually merging incoming e-invoices with outstanding purchase orders. Using rule-based matching and assistance from Copilot, you can quickly compare and map incoming e-invoices to your open orders. Save time and keep your accounts payable current, all while building positive supplier relationships with on-time payments.
Make data-driven decisions with analysis assistance
Business Central has powerful built-in capabilities to create analytical views of data, but manually constructing those views requires time and skill. Copilot simplifies analysis by transforming raw data into clear views with totals, grouping, pivots, and filters—all from simple text instructions and without ever leaving Business Central. Prompted by just a simple sentence, Copilot can identify trends and anomalies in your data, helping you make data-driven decisions that propel your business forward.
Boost customer service with inventory forecasting
Effective inventory management is crucial in a competitive business environment as it can significantly influence a company’s success and customer retention. This process involves balancing customer service with cost control. Maintaining low inventory reduces working capital, but risks missing sales due to stock shortages. Using AI, the sales and inventory forecast extension uses past sales data to forecast future demand, helping to prevent stockouts. Once a shortfall is identified, Business Central streamlines the replenishment process by generating vendor requests, helping you keep your customers happy by fulfilling their orders on time.
Reduce risk with late payment prediction
Managing receivables effectively is vital for a business’s financial wellbeing. With the late payment prediction extension, you can reduce outstanding receivables and refine your collections approach by forecasting if outstanding sales invoices are likely to be paid on time. For instance, if a payment is anticipated to be delayed, you could modify the payment terms or method for that customer. By proactively addressing potential late payments and adapting accordingly, you can minimize overdue receivables, reduce risk of non-payment, and ultimately improve your financial performance.
Improve financial stability with cash flow analysis
Powered by AI, Business Central can create a comprehensive cash flow analysis to help you monitor your company’s cash position. Cash flow is a critical indicator of a company’s solvency, and cash flow analysis is an important future-focused planning tool that helps you maintain control over your financial health and make proactive adjustments to meet your financial commitments. With insights from Business Central, you can pivot quickly to safeguard your company’s fiscal wellbeing, such as by obtaining loans to cover cash shortfalls or cutting back on credit when you have surplus cash.
Transform the way work gets done with Copilot in Business Central
Copilot gives your company an edge with AI-powered innovations that are a catalyst for unleashing human potential, fostering creativity, and driving efficiency in ways previously unimaginable. The integration of AI into everyday business processes is not just about staying ahead in a competitive market, it’s about redefining what’s possible in the workplace. With Dynamics 365 Business Central, your company is empowered to navigate today’s complex business environment with agility, precision, and a renewed focus on what truly matters.
Dynamics 365 Business Central
Work smarter, adapt faster, and perform better with Business Central.
This article is contributed. See the original author and article here.
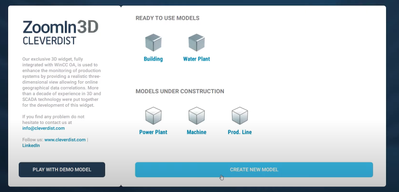
ZoomIn3D GenAI-Enabled Voice-Controlled 3D User Interface
Cleverdist have developed a system that allows users to monitor and control infrastructure through connecting to camera streams, creating triggers, and using computer vision. The system integrates artificial intelligence for operational use.
Founders Hub Benefits
What level are they?Graduated from the program.
What benefits have they been using?prototyping fast and with scale using Azure
Cleverdist is a startup that has already graduated from the Founders‘ Hub program but were able to take advantage of the benefits. They utilized essential resources like GPUs and AI tools to power their product.
ZoomIn3D Product Demo
Cleverdist has robust capabilities, including the use of multiple microphones and the integration of multimodality to interact with AI models. These features allow users to execute tasks such as repositioning cameras through natural language commands, with an intuitive and user-friendly interface. The ability to craft triggers from control system inputs, schedules, and computer vision has enabled actions such as alarm activation and report generation, streamlining operations and enhancing productivity.
Interested in taking your startup to the next level? The Microsoft for Startups Founders Hub unlocks a world of possibilities for budding entrepreneurs, offering complimentary access to advanced AI technologies via Azure. Participants can benefit from up to $150,000 in Azure credits, personalized mentorship from seasoned Microsoft professionals, and a wealth of additional resources.
This initiative is designed to be inclusive, welcoming individuals with a vision to innovate, without the prerequisite of prior funding.
This article is contributed. See the original author and article here.
Na última quarta-feira, dia 05 de Maio, dei início a um novo workshop. Dessa vez, o foco foi em ensinar como criar uma aplicação Line Of Business com OpenAI, Azure Communication Service e Microsoft Graph Toolkit. E, durante essa live exploramos muitas coisas interessantes e legais que de fato essas tecnologias podem fazer por nós!
Vamos resumir essa primeira parte do Workshop agora mesmo!
O que foi abordado durante a Live?
Durante a live, discutimos aspectos fundamentais da integração da Inteligência Artificial, Comunicação e Dados Organizacionais em Aplicações de Negócios.
A sessão foi iniciada com uma contextualização sobre a importância da tecnologia na prevenção de desastres naturais, mediante a recente castrátofe ocorrida no Rio Grande do Sul com as enchentes e como a integração da Inteligência Artificial e a Tecnologia pode ajudar a prevenir futuros desastres.
Desenvolvimento da Aplicação LOB com Azure Communication Services, Microsoft Graph/ Microsoft Graph Toolkit com OpenAI
Nessa primeira parte do workshop, que a qual será dividida em outras partes, foi abordado do que se trata a aplicação a ser aprendida e desenvolvida.
Do que se trata a aplicação? Essa aplicação é uma ferramenta básica de gerenciamento de clientes que possibilita aos usuários administrar clientes e seus dados associados.
Ele é composto por um:
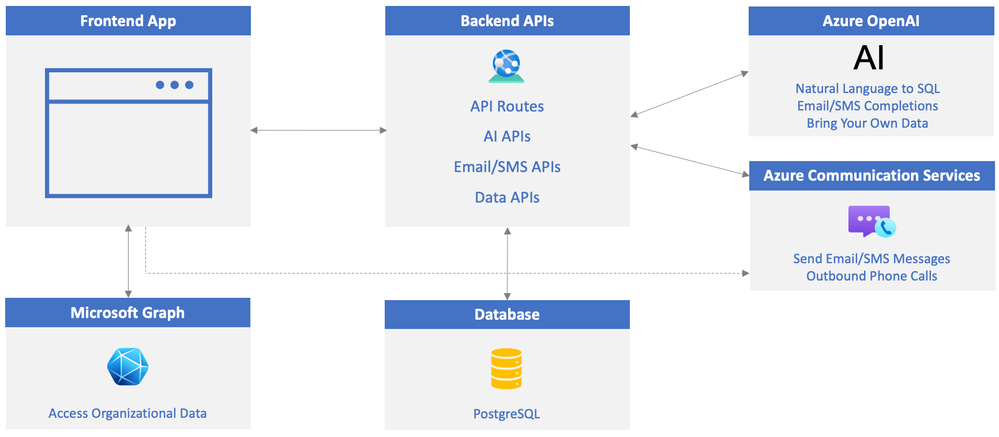
Front-End:foi desenvolvido com Angular + TypeScript
Back-End:que interage com APIs do Back-End para obter dados, acessar funcionalidades de Inteligência Artificial, enviar emails e SMS, usando justamente o Azure Communication Services. (falaremos mais sobre esse serviço no decorrer do artigo) e extraindo as informações desde um banco de dados (PostgreSQL) e também do Microsoft Graph para fins organizacionais.
Aqui está a arquitetura da aplicação:
Principais Componentes do Workshop
O projeto usa as seguintes tecnologias:
OpenAI:Utilizado para interpretar linguagem natural e executar tarefas complexas como conversão de linguagem para SQL.
Azure Communication Services:Demonstração de como incorporar funcionalidades de chamadas e mensagens dentro do aplicativo.
Microsoft Graph:utilizado para acessar dados organizacionais, reduzindo a necessidade de alternar entre aplicativos.
Microsoft Graph Toolkit:Utilizado para acessar dados do Microsoft Graph e integrar com o aplicativo.
O vídeo gravado pelo Dan Wahlin exemplifica como essa aplicação funciona e como ela pode ser útil para empresas que precisam gerenciar clientes e suas informações associadas.
O que é o Azure Communication Services?
OAzure Communication Servicesoferece APIs multicanal para incorporar funcionalidades de voz, vídeo, chat, SMS, email e muito mais em aplicações.
Esses serviços incluem APIs REST e SDKs de biblioteca cliente, facilitando a adição de recursos de comunicação sem necessidade de expertise nas tecnologias subjacentes.
O Azure Communication Services suporta diversos formatos:
Até mesmo o uso do WhatsApp pode ser integrado com o Azure Communication Services.
Além disso, o ACS é compatível com várias plataformas e linguagens, incluindo navegadores web (JavaScript), iOS (Swift), Android (Java) e Windows (.NET), com uma biblioteca de interface do usuário para acelerar o desenvolvimento de aplicativos para Web, iOS e Android. Ele é identidade agnóstica, dando controle sobre a identificação e autenticação dos clientes.
Se deseja saber os diferentes cenários de uso que você pode implementar com o Azure Communication Services, acesse aqui.
E, se você desejar saber mais sobre o Azure Communication Services, novamente o Dan Wahlin gravou um vídeo explicando como funciona o Azure Communication Services e como ele pode ser útil para empresas que precisam de funcionalidades de comunicação em suas aplicações.
O que é o Microsoft Graph?
O Microsoft Graph atua como um portal para os dados e insights do Microsoft 365. Ele oferece uma forma unificada de programar que permite acessar uma vasta quantidade de dados disponíveis no Microsoft 365, Windows e Enterprise Mobility + Security. Com o Microsoft Graph, você pode desenvolver aplicativos tanto para organizações quanto para consumidores, beneficiando-se dos dados que alcançam milhões de usuários.
Há inúmeros serviços do Microsoft Graph que você pode acessar, como:
Serviços principais do M365:Bookings, Calendar, Delve, Excel, Microsoft 365 compliance eDiscovery, Microsoft Pesquisa, OneDrive, OneNote, Outlook/Exchange, Pessoas (contatos do Outlook), Planner, SharePoint, Teams, To Do, Viva Insights.
Serviços de Enterprise Mobility + Security:Análise Avançada de Ameaças, Proteção Avançada contra Ameaças, Microsoft Entra ID, Identity Manager e Intune.
Serviços do Windows:atividades, dispositivos, notificações, Impressão Universal.
Serviços Dynamics 365 Business Central
Caso queira saber mais sobre o Microsoft Graph, acesse aqui.
Porém, é importante ressaltar que o Azure OpenAI Services é um serviço que não está disponível para todos os usuários. Ele é um serviço em preview e, para usá-lo, é necessário solicitar acesso. Se você deseja fazer uso do serviço, precisará solicitar acesso e aguardar a aprovação.
Nota: O link para solicitação de acesso ao Azure OpenAI Services está no link aqui.
Nota: O link para solicitação de acesso ao Azure OpenAI Services está no link aqui.
Mas, caso você não tenha acesso ao Azure OpenAI Services, você pode usar a OpenAI API. A OpenAI API é um serviço que está disponível para todos os usuários e você pode começar a usá-lo imediatamente. Requer custos de uso, mas você pode começar a usar o serviço sem a necessidade de aprovação.
Iniciando a configuração do Projeto
Lembrando que, para seguir o passo a passo do workshop você poderá acessar a documentação oficial do workshopaqui.
Nesse primeiro momento, configuramos o projeto fazendo uso doCodespaces. Pois com o Codespaces, não precisaremos instalar nada em nossa máquina local. Tudo será feito na nuvem e, para isso, basta ter uma conta no GitHub.
Nota: O Codespaces é um serviço que permite desenvolver e testar aplicações em um ambiente de desenvolvimento baseado na nuvem. Você pode usar até 60 horas por mês gratuitamente.
Nota: O Codespaces é um serviço que permite desenvolver e testar aplicações em um ambiente de desenvolvimento baseado na nuvem. Você pode usar até 60 horas por mês gratuitamente.
Aproveitamos para executar o comando npm install para instalar as dependências do projeto. Tanto na pasta client e na pasta server. E, devido ao uso do Codespaces, podemos fazer uso do Docker para criar um container com o PostgreSQL. Simplesmente executando o comando docker-compose up -d para criar o container.
Se você não acompanhou a live, o projeto está disponível no GitHub. Você pode acessar o repositório aqui. Forke o repositório e siga o passo a passo do workshop.
E, finalmente criamos uma conta do Microsoft 365 Developer Program. Que é um programa gratuito que oferece uma conta de desenvolvedor do Microsoft 365, com acesso a um ambiente de desenvolvimento do Microsoft 365 E5, incluindo 25 licenças de usuário para uso de teste.
Recomendo que você crie uma conta no Microsoft 365 Developer Program para ter acesso a um ambiente de desenvolvimento do Microsoft 365 E5 e também para poder conseguir seguir com o tutorial!
Conclusão e Próximos Passos
Ao final do workshop, os participantes foram incentivados a aplicar o conhecimento adquirido em seus projetos, com Gláucia enfatizando a inevitável influência da inteligência artificial no futuro da tecnologia e desenvolvimento de software.
Próxima Live
Preparem-se para a próxima sessão da série Learn Live, onde continuaremos explorando novas integrações e expandindo os conhecimentos em aplicações LOB com OpenAI, Azure Communication Services e Microsoft Graph Toolkit.
A próxima parte do workshop será no dia 29 de Maio às 14h (horário de Brasília). Então, fique ligado(a) para não perder nenhuma live! E, aproveite e se inscreva no Canal do YouTube do Microsoft Reactor para não perder nenhuma live!
Lembrando que, essa série de vídeos continuará até Julho de 2024! Então, fique ligado(a) para não perder nenhuma live! E, aproveite e se inscreva no Canal do YouTube do Microsoft Reactor para não perder nenhuma live!
Recursos Adicionais
Sempre é muito importante ter acesso a recursos adicionais para aprimorar o conhecimento. Por isso, deixo aqui alguns links que podem ser úteis para vocês:
This article is contributed. See the original author and article here.
Session: Building Collaborative Apps in Teams to bring People together Speakers: Loki Meyburg
Collaboration and productivity are essential for any organization, especially in the hybrid work environment. Microsoft Teams is the ultimate platform for collaboration, allowing you to work together with apps in chats, channels, and meetings. Loki Meyburg explained in his session how to build collaborative apps in Teams and enhance your work experience.
Collaboration vs. Productivity
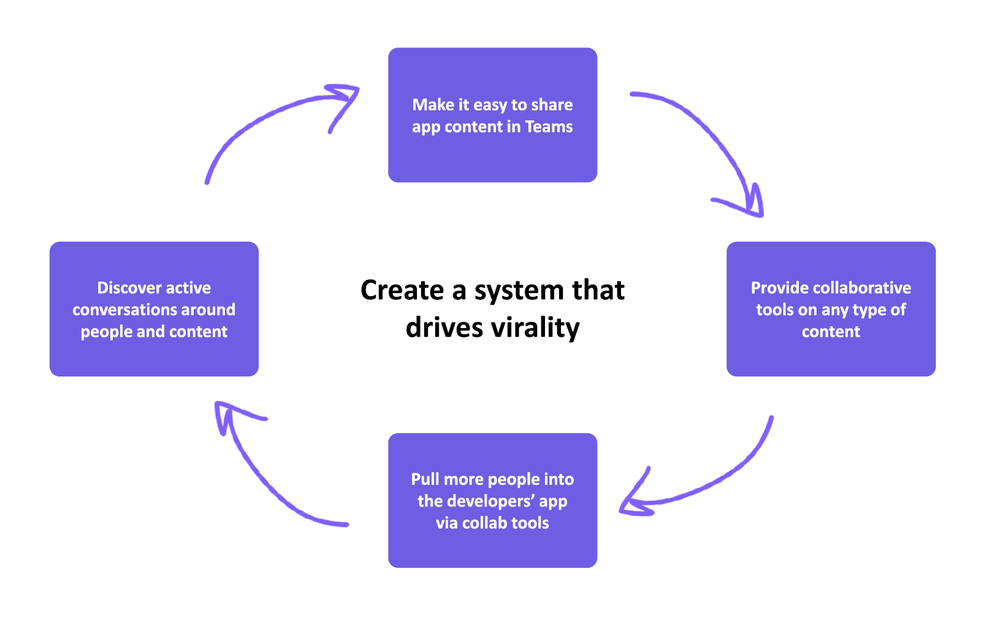
First, let’s understand the difference between collaboration and productivity, and how Teams can support both aspects of work. Collaboration is the act of working together with multiple people to achieve a common goal, while productivity is the efficiency and effectiveness of individual or collective work efforts. Microsoft Teams enables you to collaborate around apps by sharing, discovering, notifying, and collaborating on app content in various contexts.
Sharing is the first step of collaboration
One of the key features of Teams is the ability to collaborate around shared links. When you share a link to an app content in a chat or channel, Teams can automatically unfurl the link and attach a rich interactive preview card, using adaptive cards and bots. The preview card can show relevant information and actions related to the app content, such as a product launch diagram, a survey, or a report. You can also open the app content in a popout window with chat on the side or share it to a meeting and use it together in real-time.
To build these experiences, you can use message extensions, link unfurling, app content stages, and Live Share. Message extensions allow you to register your domain and turn links into adaptive cards. Link unfurling enables bots to unfurl the links and attach the adaptive cards to the messages. App content stages are special views that present the web app in a popout window or a meeting stage. Live Share is a service that allows you to easily enable multiplayer experiences in meetings, with features such as inking, cursors, video, and audio synchronization.
How to build these experiences
Bots are the foundation on which we will build these experiences. They enable everything else. You can use message extensions and link unfurling to attach rich interactive adaptive card previews when your URLs get shared in chats or channels. These previews can show relevant information and actions related to your app content, such as a product launch diagram, a survey, or a report. You can also customize the look and feel of the adaptive cards using templates and styles.
There are two app content stages, collab stage and meeting stage, to present your web app in Teams. The collab stage is a popout window that opens when you click on the app icon in the chat header or the preview card. It allows you to view and interact with the app content along with the chat on the side. The meeting stage is a full-screen view that opens when you share the app content to a meeting. It allows you to collaborate on the app content in real-time with other meeting participants. You can use Live Share to easily enable multiplayer experiences in meetings, with features such as inking, cursors, video, and audio synchronization.
Going from productivity to collaboration
Another important aspect of building collaborative apps in Teams is taking collaboration to the next level. You can enhance the collaboration experience by proactively notifying users and creating focused conversations, leveraging app skills and natural language processing, and using Teams SSO to authenticate users. You can also use some tools and resources for developers, such as Figma UI Kit, Teams Toolkit for Visual Studio Code, and Developer Portal. You should also be aware of some upcoming improvements, such as app rating and review, adaptive card styling, permissions and consent, and instant app tabs.
In conclusion, Teams can help you collaborate around apps in various scenarios and contexts, and you can build these experiences using the Teams platform.
Additional resources
You can find more information about how to build your own collaborative apps like link unfurling, collab stages or the Teams AI library here:
This article is contributed. See the original author and article here.
Hello, Mike Bazarewsky writing again, now on our shiny new ISV blog! My topic today is on a product that hasn’t gotten a huge amount of press, but actually brings some really nice capabilities to the table, especially with respect to IoT scenarios as we look to the future with Azure IoT Operations. That product is AKS Edge Essentials, or AKS-EE for short.
What did Microsoft have before AKS-EE?
AKS-EE is intended to be the “easy button” for running Linux-based and/or Windows-based containers on a Windows host, including a Windows IoT Enterprise host. It’s been possible to run Docker-hosted containers on Windows for a long time, and it’s even been possible to run orchestrators including Kubernetes on Windows for some time now. There’s even formal documentation on how to do so in Microsoft Learn.
Meanwhile, in parallel, and specific to IoT use cases, Microsoft offers Azure IoT Edge for Linux on Windows, or EFLOW for short. EFLOW offers the Azure IoT Edge container orchestrator on a Windows host by leveraging a Linux virtual machine. That virtual machine runs a customized deployment of CBL-Mariner, Microsoft’s first-party Linux distribution designed for secure, cloud-focused use cases. As an end-to-end Microsoft offering on a Microsoft platform, EFLOW is updated through Microsoft Update and as such, “plays nice” with the rest of the Windows ecosystem and bringing the benefits of that ecosystem while allowing running targeted Linux containers to run with a limited amount of “ceremony”.
What does AKS-EE bring to the table?
Taking this information all into account, it’s reasonable to ask “What are the gaps? Why would it make sense to bring another product into the space?” The answer is two-fold:
For some ISVs, particularly those coming from traditional development models (e.g. IoT developers, web service developers), the move to “cloud native” technologies such as containers is a substantial shift on its own, before worrying about deployment and management of an orchestrator. However, an orchestrator is still something those ISVs need to be able to get to scalability and observability as they work through their journey of “modernization” around containers.
EFLOW works very, very well for its intended target, which is Azure IoT Edge. However, that is a specialized use case that does not generalize well to general application workloads.
There is a hidden point here as well. Windows containers are a popular option in many organizations, but Linux containers are more common. At the same time, many enterprises (and thus, ISV customers) prefer the management, hardware support, and long-term OS support paths that Windows offers. Although through technologies such as Windows container hosting, Windows Subsystem for Linux, and Hyper-V allow for running Linux containers on a Windows host, they have different levels of complexity and management overhead, and in some situations, they are not practical.
The end result of all of this is that there is a need in the marketplace for a low-impact, easily-deployed, easily-updated container hosting solution for Linux containers on Windows hosts that supports orchestration. This is especially true as we look at a solution like Azure IoT Operations, which is the next-generation, Kubernetes-centric Azure IoT platform, but is also true for customers looking to move from the simplistic orchestration offered by the EFLOW offering to the more sophisticated orchestration offered by Kubernetes.
Besides bringing that to the table, AKS-EE builds on top of the standard k3s or k8s implementations, which means that popular Kubernetes management tools such as k9s can be used.
It can be Azure Arc enabled, allowing centralized management of the solution in the Azure Portal, Azure PowerShell, or Azure CLI. Azure Arc supports this through an outgoing connection from the cluster to the Azure infrastructure, which means it’s possible to remotely manage the environment, including deploying workloads, collecting telemetry and metrics, and so on, without needing incoming access to the host or the cluster. And, because it’s possible to manage Windows IoT Enterprise using Azure Arc, even the host can be connected to remotely, with centrally managed telemetry and updates (including AKS-EE through Microsoft Update). This means that it’s possible to have an end-to-end centrally managed solution across a fleet of deployment locations, and it means an ISV can offer “management as a service”. An IoT ISV can even offer packaged hardware offerings with Windows IoT Enterprise, AKS-EE, and their workload, all centrally managed through Azure Arc, which is an extremely compelling and powerful concept!
What if I am an IoT Edge user using EFLOW today?
As you might be able to determine from the way I’ve presented AKS-EE, one possible way to think about AKS-EE is as a direct replacement for EFLOW in IoT Edge scenarios. The AKS-EE Product Group is finishing guidance on migrating from EFLOW to AKS-EE and it will be published as soon as it is completed.
Conclusion
Hopefully, this short post gives you a better understanding of the “why” of AKS-EE as an offering and how it relates to some other offerings in the Microsoft space. If you’re looking to evaluate AKS-EE, the next step would be to review the Quickstart guide to get started!
Looking forward, if you are interested in production AKS-EE architecture, FastTrack ISV and FastTrack for Azure (Mainstream) have worked with multiple AKS-EE customers at this point, from single host deployments to multi-host scale-out deployments, including leveraging both the Linux and the Windows node capabilities of AKS-EE and leveraging the preview GPU support in the product. Take a look at those sites to learn more about how we can help you with derisking your AKS-EE deployment, or help you decide if AKS-EE is in fact the right tool for you!
This article is contributed. See the original author and article here.
Prologue – The creation of a new proxy with Linux, Rust, and OSS
In this introductory blog to the new Azure Front Door next generation platform, we will go over the motivations, design choices and learnings from this undertaking which helped us successfully achieve massive gains in scalability, security and resiliency.
Introduction
Azure Front Door is a global, scalable, and secure entry point for caching and acceleration of your web content. It offers a range of features such as load balancing, caching, web application firewall, and a rich rules engine for request transformation. Azure Front Door operates at the edge of Microsoft’s global network and handles trillions of requests per day from millions of clients around the world.
Azure Front Door, originally built upon a Windows-based proxy, has been a critical component in serving and protecting traffic for Microsoft’s core internet services. As the commercial offering of Azure Front Door expanded, and with the ever-evolving landscape of security and application delivery, we recognized the need for a new platform. This new platform would address the growing demands of scale, performance, cost-effectiveness, and innovation, ensuring we are able to meet the challenging scale and security demands from our largest enterprise customers. For our next-generation Azure Front Door platform, we opted to build it on Linux and embrace the open-source software community. The new edge platform was designed to incorporate learnings from the previous proxy implementation, while allowing us to accelerate innovation and deliver enhanced value to our customers. We will delve into the key design and development decisions that shaped the next generation proxy, and a modern edge platform that meets innovation, resiliency, scale and performance requirements of Azure and Microsoft customers.
Why Linux and Open Source?
A key choice that we made during the development of the new proxy platform was to use Linux as the operating system for the proxy. Linux offers a mature and stable platform for running high-performance network applications and it has a rich ecosystem of tools and libraries for network programming which allows us to leverage the expertise and experience of the open-source community.
Another reason for choosing Linux was that it offers a vibrant ecosystem with containers and Kubernetes for deploying and managing the proxy instances. The use of containers and Kubernetes offer many benefits for cloud-native applications, such as faster and easier deployment, scaling, and updates, as well as better resource utilization and isolation. By using containers and Kubernetes, we were also able to take advantage of the existing infrastructure and tooling that Microsoft has built for running Linux-based services on Azure.
The next decision that we made was to use open-source software as the basis of the platform. We selected high-quality and widely used open-source software for tasks like TLS termination, caching, and basic HTTP proxying capabilities. By using existing and reliable open-source software as the foundation of the new edge platform, we can concentrate on developing the features and capabilities that are unique to Azure Front Door. We also gain from continuous development and enhancement by the open-source community.
How did we build the next generation proxy?
While open-source software provides a solid foundation for the new proxy, it does not cover all the features and capabilities that we need for Azure Front Door. Azure Front Door is a multi-tenant service that supports many custom proxy features that are not supported by any open-source proxy. Building the proxy from scratch was faced with multiple design challenges but in this blog we will focus on the top two that helped build the foundation of the new proxy. We will discuss other aspects such as resilient architecture and protection features in later parts of this blog series.
Challenge 1: Multi-Tenancy
The first major challenge in developing Azure Front Door as a multi-tenant service was ensuring that the proxy could efficiently manage the configurations of hundreds of thousands of tenants, far surpassing the few hundred tenants typically supported by most open-source proxies. Each tenant’s configuration dictates how the proxy handles their HTTP traffic, making the configuration lookup an extremely critical aspect of the system. This requires all tenant configurations to be loaded into memory for high performance.
Processing configuration for hundreds of thousands of tenants means that the system needs to handle hundreds of config updates every second which requires dynamic updates to the data path without disrupting any packets. To address this, Azure Front Door adopted a binary configuration format which supports zero-copy deserialization and ensures fast lookup times. This choice is crucial not only for efficiently managing current tenant configurations but also for scaling up to accommodate future growth, potentially increasing the customer base tenfold. Additionally, to handle dynamic updates to the customer configuration delivered by the Azure Front Door’s configuration pipeline, a custom module was developed to asynchronously monitor and update the config in-memory.
Challenge 2: Customer business logic
One of the most widely adopted features of Azure Front Door is our Rules Engine, which allows our customers to set up custom rules tailored for their traffic. To build the proxy from scratch means that we must enable this extremely powerful use case in the open-source proxy, which brings us to our second challenge. Rather than creating fixed modules for each rule, we chose to innovate.
We developed a new domain-specific language (DSL) named AXE (Arbitrary eXecution Engine), specifically designed to add and evolve data plane capabilities swiftly. AXE is declarative and expressive, enabling the definition and execution of data plane processing logic in a structured yet flexible manner. It represents the rules as a directed acyclic graph (DAG), where each node signifies an operation or condition, and each edge denotes data or control flow. This allows AXE to support a vast array of operations and conditions, including:
Manipulating headers, cookies, and query parameters
Regex processing
URL rewriting
Filtering and transforming requests and responses
Invoking external services
These capabilities are integrated at various phases of the request processing cycle, such as parsing, routing, filtering, and logging.
AXE is implemented as a custom module in the new proxy, where it interprets and executes AXE scripts for each incoming request. The module is built on a fast, lightweight interpreter that operates in a secure, sandboxed environment, granting access to necessary proxy variables and functions. It also supports asynchronous and non-blocking operations, vital for non-disruptive external service interactions and timely processing.
This innovative approach to building and integrating the Rules Engine using AXE ensures that Azure Front Door remains a cutting-edge solution, capable of meeting and exceeding the dynamic requirements of our customers. Though AXE was developed for supporting Rules Engine feature of Azure Front Door, it was so flexible that we use it to power our WAF module now.
Why Rust?
Another important decision that we made while building the next generation proxy was to write new code in Rust, a modern and safe systems programming language. All the components we mentioned in the section above are either written in Rust or being actively rewritten in Rust. Rust is a language that offers high performance, reliability, and productivity, and it is gaining popularity and adoption in the network programming community. Rust has several features and benefits that make it a great choice for the next generation proxy, such as:
Rust has a powerful and expressive type system that helps us write correct and robust code. Rust enforces strict rules and performs all checks at compile time to prevent common errors and bugs, such as memory leaks, buffer overflows, null pointer exceptions, and data races. Rust also supports advanced features found in modern high-level languages such as generics, traits, and macros, that allow us to write generic and reusable code.
Rust has a concise and consistent syntax that avoids unnecessary boilerplate and encourages common conventions and best practices. Rust also has a rich and standard library that provides a wide range of useful and high-quality functionality with an emphasis on safety and performance, such as collections, iterators, string manipulation, error handling, networking, threading, and asynchronous execution abstractions.
Rust has a strong and vibrant community that supports and contributes to the language and its ecosystem. It has a large and growing number of users and developers who share their feedback, experience, and knowledge through various channels, such as forums, blogs, podcasts, and conferences. Rust also has a thriving and diverse ecosystem of tools and libraries that enhance and extend the language and its capabilities, such as IDEs, debuggers, test frameworks, web frameworks, network libraries, and AI/ML libraries.
We used Rust to write most of the new code for the proxy. By using Rust, we were able to write highly performant and reliable code for the proxy, while also improving our development velocity by leveraging existing Rust libraries. Rust helped us avoid many errors and bugs that could have compromised the security and stability of the proxy, and it also made our code more readable and maintainable.
Conclusion
The Azure Front Door team embarked on this journey to overhaul the entire platform a few years ago by rewriting the proxy and changing the infrastructure hosting the proxy. This effort enabled us to increase our density and throughput by more than double along with significant enhancements to our resiliency and scalability. We have successfully completed the transition of Azure Front Door customers from the old platform to the new one without any disruption. This challenging task was like changing the wings of a plane while it is airborne.
In this blog post, we shared some of the design and development challenges and decisions that we made while building the next generation edge platform for Azure Front Door that is based on Linux and uses Rust and OSS to extend and customize its functionality. We will share more details about AXE and other data plane and infrastructure innovations in later posts.
If you want to work with us and help us make the internet better and safer, we have some great opportunities for you. Azure Front Door team is looking to hire more engineers in different locations, such as USA, Australia, and Ireland. You can see more details and apply online at the Microsoft careers website. We hope to hear from you and welcome you to our team.


Recent Comments