This article is contributed. See the original author and article here.
1. File Actions
If you use the SharePoint File Actions dataset in Microsoft Graph Data Connect, you might want to join it with the SharePoint Files dataset to get the details for each file. This post is about how you can do it, including the most common issues.
2. What is in File Actions
The SharePoint File Actions dataset includes details about every time a file was accessed, deleted, downloaded, modified, moved, renamed, or uploaded. The information about each action includes the type of action, when it happened, what file was acted upon, what application was used, and the user who performed the action (the actor).
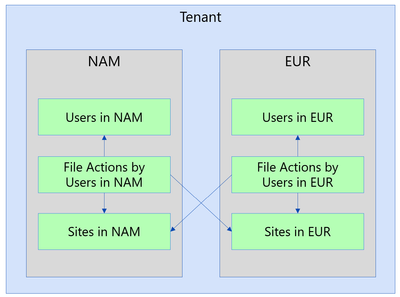
A common use of this dataset is to join with the SharePoint Sites or the SharePoint Files to understand how much activity is going on for a specific Site or File. You could use this to see which Site or File was the most accessed on a given day. If you accumulate the actions for a longer period, you could find which sites had no activities in the last 90 days.
To find the details for site associated with a specific action, group File Actions by site ID then join with Sites. Here’s a SQL example to get a list of most popular sites during the period covered by File Actions:
WITH ActionsBySite AS (
    SELECT
        SiteId,
        MIN(ActionDate) AS EarliestAction,
        MAX(ActionDate) AS LatestAction,
        COUNT(*) AS ActionCount
    FROM FileActions
    GROUP BY SiteId
)
SELECT
    S.Id AS SiteId,
    S.[RootWeb.Title] AS SiteName,
    S.CreatedTime AS SiteCreated,
    S.[RootWeb.LastItemModifiedDate] AS SiteLastModified,
    S.[RootWeb.TemplateId] AS SiteTemplateId,
    A.EarliestAction,
    A.LatestAction,
    A.ActionCount
FROM ActionsBySite AS A
JOIN Sites S
ON A.SiteId = S.Id
ORDER BY ActionCount DESC
LIMIT 10;
To find details of the file associated with a specific action, group File Actions by File then join with Files. Here’s a similar example to get a list of most popular files during the period covered by File Actions:
WITH ActionsByFile AS (
    SELECT
        SiteId,
        WebId,
        ListId,
        ListItemId,
        MIN(ActionDate) AS EarliestAction,
        MAX(ActionDate) AS LatestAction,
        COUNT(*) AS ActionCount
    FROM FileActions
    GROUP BY SiteId, WebId, ListId, ListItemId
)
SELECT
    F.DirName,
    F.FileName,
    F.AuthorEmail,
    F.TimeCreated AS FileCreated,
    F.TimeLastModified AS FileLastModified,
    A.EarliestAction,
    A.LatestAction,
    A.ActionCount
FROM ActionsByFile AS A
JOIN Files F
ON A.SiteId = F.SiteId
AND A.WebId = F.WebId
AND A.ListId = F.ListId
AND A.ListItemId = F.ItemId
ORDER BY ActionCount DESC
LIMIT 10;
NOTE: Please check with your compliance team if they approve of keeping the File Actions data for longer periods of time. There might be restrictions on how long you should keep private information.
4. Potential issues
With huge datasets like Files and File Actions, there are scenarios where the JOIN is not a perfect match. Here are a few possible issues when joining File Actions with Sites or Files.
The JOIN operation will exclude a specific action if the File Action is in a different region than the File. When a tenant has multiple regions, the actions are recorded in the region of the actor. An actor in that region might be accessing files in other regions, which you might not have in that environment. To overcome that, you must run collection for SharePoint Files from all the regions and combine (union) them into a single dataset.
NOTE: These datasets are partitioned by region for compliance reasons, so please make sure to run this scenario by your compliance team before combining data from multiple regions.
4b. Matching dates
There are certain situations where the Files will be missing when you try the join because your File Action snapshot is more recent than your File snapshot date. For instance, if you have a File Actions snapshot for July 15th joined with a Files snapshot for July 1st. Essentially, the JOIN will exclude the File Action because the File data did not make it yet.
Also, the SharePoint Files dataset might take about a week to fully update. You might exclude an action for a file that was recently created and did not make its way into the Files dataset yet. So even if both the File Actions snapshot and the Files snapshot are from July 1st, there is the possibility that some of the recent files have not been captured yet.
There is also the chance of some File Actions arriving late (typically less than 0.01%). For instance, a small percentage of actions for July 1st might show in the snapshot for July 2nd.
So, in general, if you want to get the most complete dataset, it’s a good idea to wait until July 8th to process and report on actions for July 1st. This will guarantee that you are using a fresher Files dataset and allowing for late-arriving File Actions data.
4c. Not a Document Library
Another reason for not finding a match between the File Actions dataset and the Files dataset is when the file action is for a file not in a document library. The SharePoint Files dataset only includes files in a document library, ignoring other types of lists. This is by design to keep the Files dataset to a more reasonable size.
A common scenario here are actions related to SharePoint pages (files with the “aspx” extension), typically in Communication Sites. While you will not see these “aspx” pages in the Files dataset, you could still count actions per site.
Covering this gap would require adding specific datasets for SharePoint Pages and/or SharePoint Lists, providing additional details. This is something the team is considering for the future, but there is no estimated date for this.
4d. List Item Id missing
The File Actions dataset shows the telemetry as reported by applications. For some of these applications, it is possible that the ListItemId is not reported or is reported as “null”. In that case, the join will exclude those actions.
Again, you could summarize these actions at a site level even if the ListItemId is missing. You can also look at a summary by User Agent to identify specific applications that are not providing data.
5. Conclusion
I hope you learned more about the SharePoint File Actions dataset in Microsoft Graph Data Connect. You can read more about the Microsoft Graph Data Connect for SharePoint at https://aka.ms/SharePointData. There you will find many details, including a list of datasets available and frequently asked questions.
This article is contributed. See the original author and article here.
Microsoft 365 is the best way to access the latest versions of the productivity apps that millions of people use every day to bring their ideas to life and power through tasks. But we know some of our customers still prefer a non-subscription way to access our familiar apps, which is why we’re releasing Office 2024 on October 1 for consumers and small businesses.
This article is contributed. See the original author and article here.
I was having a conversation with a small business owner, and they mentioned wanting to have an emphasis on improving customer service and ratings, but the process of reading feedback and survey responses was taking up a lot of time. I often spend time analyzing questions and comments from customers, and it’s always a painstaking task dissecting verbatims and identifying themes and insights, let alone develop an action plan to resolve them. With the recent slate of enhancements announced, including Copilot in Excel being generally available, I thought it’d be appropriate to explore some ways Copilot could help make this a much simpler task.
Tip 1: Use Copilot in Excel to summarize unstructured text in a table
Easily one of the best tips that could save you time when trying to dig into and get insights from feedback verbatims is to ask Copilot to do it for you! Whether it’s customer feedback, survey results, or focus group studies, you can simply ask Copilot to summarize the text data.
In this example, I open my spreadsheet with customer ratings and feedback. I then open Copilot in Excel on the top right and ask it to “Please summarize the feedback in this sheet.”
A screenshot of Copilot in Excel summarizing rows of feedback verbatims
Copilot provides a high-level summary of the feedback, group it into different themes. Very quickly, with little effort, we already have some insights that we could start working with!
Tip 2: Add specifics to your prompt to get more precise insights
As we’ve covered in previous editions, how you craft your prompt matters. Let’s say you want to drill down further and get more insights focused on more negative reviews and areas of improvement. Using the same example data here, you could then write a prompt like, “Hone in on Feedback with Ratings of less than 3, can you summarize this feedback and provide key themes and areas of improvement.”
Copilot first explains what it’s doing:
A screenshot of Copilot outlining how it’s going to summarize feedback from responses with a rating of less than 3
Then, based on the focused information, gives me back more detailed and specific information so that I can focus on specific aspects of customer service that I want to address, including tips on how to take action.
A screenshot of more detailed insights focused on neutral to negative feedback analyzed A screenshot of recommendations by Copilot on how to improve customer service based on the feedback analysis
Just like that, we were able to find insights from raw feedback that would’ve otherwise taken time to parse through manually, and I can instead focus on building an action plan to help address my issues!
Let me know in the comments below how else you’ve been using Microsoft 365 Copilot, or if there are tips you’d like to see!
This article is contributed. See the original author and article here.
Azure Data Explorer (ADX) supports time series aggregation at scale, either by the summarize operator that keeps the aggregated data in tabular format or by the make-series operator that transforms it to a set of dynamic arrays. There are multiple aggregation functions, out of them avg() is one of the most popular. ADX calculates it by grouping the samples into fixed time bins and applying simple average of all samples inside each time bin, regardless of their specific location inside the bin. This is the standard time bin aggregation as done by SQL and other databases. However, there are scenarios where simple average doesn’t accurately represent the time bin value. For example, IoT devices sending data commonly emits metric values in an asynchronous way, only upon change, to conserve bandwidth. In that case we need to calculate Time Weighted Average (TWA), taking into consideration the exact timestamp and duration of each value inside the time bin. ADX doesn’t have native aggregation functions to calculate time weighted average, still we have just added few User Defined Functions, part of the Functions Library, supporting it:
time_weighted_val_fl() – Calculates the time weighted value of a metric using linear interpolation.
time_weighted_avg_fl() – Calculates the time weighted average of a metric using fill forward interpolation.
time_weighted_avg2_fl() – Calculates the time weighted average of a metric using linear interpolation.
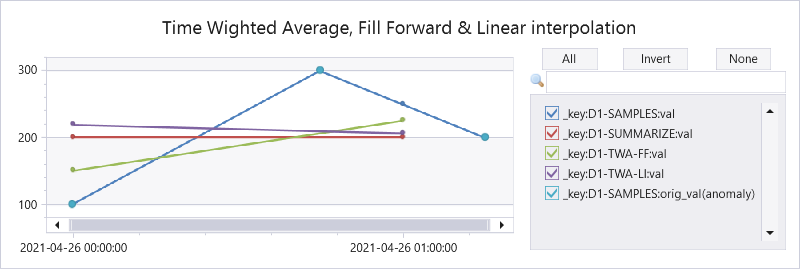
Here is a query comparing the original & interpolated values, standard average by the summarize operator, twa using fill forward and twa using linear interpolation:
let tbl = datatable(ts:datetime,  val:real, key:string) [
    datetime(2021-04-26 00:00), 100, 'D1',
    datetime(2021-04-26 00:45), 300, 'D1',
    datetime(2021-04-26 01:15), 200, 'D1',
];
let stime=datetime(2021-04-26 00:00);
let etime=datetime(2021-04-26 01:15);
let dt = 1h;
//
tbl
| where ts between (stime..etime)
| summarize val=avg(val) by bin(ts, dt), key
| project-rename _ts=ts, _key=key
| extend orig_val=0
| extend _key = strcat(_key, '-SUMMARIZE'), orig_val=0
| union (tbl
| invoke time_weighted_val_fl('ts', 'val', 'key', stime, etime, dt)
| project-rename val = _twa_val
| extend _key = strcat(_key, '-SAMPLES'))
| union (tbl
| invoke time_weighted_avg_fl('ts', 'val', 'key', stime, etime, dt)
| project-rename val = tw_avg
| extend _key = strcat(_key, '-TWA-FF'), orig_val=0)
| union (tbl
| invoke time_weighted_avg2_fl('ts', 'val', 'key', stime, etime, dt)
| project-rename val = tw_avg
| extend _key = strcat(_key, '-TWA-LI'), orig_val=0)
| order by _key asc, _ts asc
// use anomalychart just to show original data points as bold dots
| render anomalychart with (anomalycolumns=orig_val, title='Time Wighted Average, Fill Forward & Linear interpolation')
Explaining the results:
2021-04-26 00:00
2021-04-26 00:00
Interpolated value
100
(300+200)/2=250
Average by summarize
(100+300)/2=200
200
Fill forward TWA
(45m*100 + 15m*300)/60m = 150
(15m*300 + 45m*200)/60m = 225
Linear interpolation TWA
45m*(100+300)/2 + 15m*(300+250)/2)/60m = 218.75
15m*(250+200)/2 + 45m*200)/60m = 206.25
Note that all functions work on multiple time series, partitioned by supplied key.
You are welcome to try these functions and share your feedback!
This article is contributed. See the original author and article here.
Scenario
Customers follow the Microsoft doc to create CMK encrypted objects (data source, index etc.), but get the 500 Internal Server Error:
{‘error’:{‘code’:”,’message’:’Could not use key vault key to wrap/unwrap the encryption key. {‘Message’:’An error has occurred.’}’}
Possible Causes
The key vault host is incorrect, e.g. incorrect key vault domain.
Action: check the keyVaultUri in the Json payload.
The key vault host is inaccessible to search. For example, the key vault has public network access disabled but does not have a shared private link (SPL) configured from search.
Action: check the SPL configurations or create a SPL.
Note that if the key vault Uri is correct or accessible, the error message due to a wrong key vault key name or version in the JSON payload is slightly different. The error message has the complete key vault key path.
This article is contributed. See the original author and article here.
We’re thrilled to announce that Copilot is now available1 on OneDrive for the web to all our Copilot licensed commercial users2, marking a significant milestone in the way you work with files in OneDrive. Copilot brings the power of AI right into OneDrive to help you work more efficiently and effectively. Let’s take a look at how Copilot can transform the way you work with your files.
What Can You Do with Copilot in OneDrive?
Copilot isn’t just a tool; it’s a productivity companion that works alongside you, making everyday tasks easier and empowering you to achieve more. Here are some of the exciting ways you can take advantage of Copilot’s capabilities:
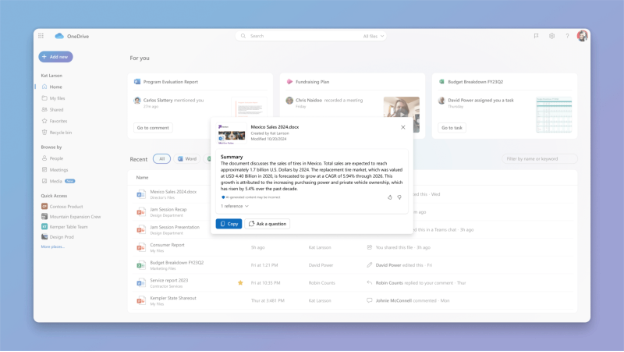
Generate Summaries for Large Documents No more scanning through long documents to find the key points. With Copilot, you can quickly generate a concise summary of a single document or up to 5 files3 at a time, allowing you to easily get insights and focus on what matters most.
Compare Differences Between Multiple Documents Whether you’re working with contracts, financial reports, or job applications, sometimes all you’re looking for are meaningful differences between files. With Copilot you can now save time by quickly comparing up to 5 files, highlighting the key differences between them in an easy-to-read table view, without even opening these files.
Answer Complex Questions Using Files Need insights from multiple documents? Copilot can analyze the content of your OneDrive files and answer complex questions by pulling the right information from across your stored data -turning your file storage into a valuable source of knowledge and insight.
Generate Ideas for New Documents If you’re stuck and need inspiration, Copilot can help you get started by suggesting outlines, ideas, or even a draft based on the files stored in OneDrive. For example, you can select relevant docs in your OneDrive and ask Copilot to generate drafts of a sales proposal, marketing strategy, or a project plan.
How to Get Started with Copilot in OneDrive
Getting started with Copilot in OneDrive is easy. Simply hover over a supported file in your OneDrive and click on the Copilot button to choose from a menu of suggested actions or ask your own question. You can also select up to 5 files and click the Copilot button in the command bar to get started. Whether you’re summarizing a report or need an insight from a file, Copilot is just a click away.
If you’re new to Copilot or want to learn more, check out our getting started guide for detailed instructions and tips on how to make the most of this powerful new tool. If you need more answers, visit our FAQs.
A Smarter, More Efficient Future with OneDrive
With the full availability of Copilot in OneDrive, we’re excited to see how you leverage this AI-powered assistant to transform the way you work. And we have a lot more exciting Copilot features coming your way soon. Start exploring Copilot in OneDrive today and discover how it can help you achieve more!
We’d love to hear your thoughts—don’t forget to provide feedback directly in Copilot by using thumbs up or thumbs down feature. Your input helps us improve our experience!
Copilot in OneDrive requires a Microsoft Copilot for Microsoft 365 license.
Copilot in OneDrive is currently available on OneDrive for web and for our commercial users only.
For a list of currently supported file formats, please visit our FAQs.
About the author
Arjun is a Principal Product Manager on the OneDrive web team. His main focus is to bring the power of AI to files experiences in OneDrive and across other M365 apps. Outside work, he enjoys dining out, traveling, and playing cricket whenever possible.
This article is contributed. See the original author and article here.
Boost visibility, streamline role management, and enhance compliance
In today’s digital landscape, managing security, roles, and licensing within ERP systems is increasingly complex. As organizations scale, the need for robust governance, efficient user management, and cost-effective licensing strategies becomes paramount. To address these challenges, Microsoft Dynamics 365 is introducing a set of new capabilities in our ERP portfolio. These new capabilities enhance security and governance, offering significant benefits to IT professionals and business leaders alike.
A critical aspect of the upcoming security features is how they will help prepare for compliance certifications, including Sarbanes-Oxley (SOX). With regulatory standards becoming more stringent, achieving compliance is essential. More than ever, companies need to mitigate risks associated with fraud, reporting errors, and security breaches. As new AI technologies are adopted, security becomes even more top of mind. Robust governance frameworks safeguard sensitive data and ensure ethical AI deployment. The enhanced governance features will ensure that you can maintain rigorous control over financial processes, role management, and security protocols. These features provide visibility and a transparent audit trail, significantly easing the certification process. Additionally, they reduce the likelihood of non-compliance, protecting your organization from financial and reputational risks.
“Bringing additional transparency and simplicity to our ERP customers for managing security, licensing and roles is a critical step in helping organizations meet their compliance and governance goals while saving costs.” – George Glantsching, VP, Microsoft Dynamics
Bringing new features to customers faster
Microsoft is delivering advanced security and role management features which will empower organizations to apply precise role management, advanced audit capabilities, and comprehensive license optimization tools, while maintaining a seamless user experience in Microsoft Dynamics 365. This ensures that you can access these critical features faster, enhancing security and operational efficiency.
Simplify role management while reducing costs
We’ve listened to our customers and are introducing advanced features to the Dynamics 365 ERP portfolio, focusing on security management and licensing. This capability will simplify role management, providing you with tools to create, manage, and optimize roles within the ERP environment. The precise role and duty management feature, powered by tailored automations, allows organizations to define duties based on specific processes or tasks. This ensures role access aligns accurately with each team’s operational needs, leading to more accurate control over access permissions. Cost savings are driven by ensuring that licenses are scoped to each user’s specific needs. By refining role management in this way, these advanced features ensure organizations can scale with confidence while optimizing both governance and cost efficiency.
Ensure compliance with role-based access control
Another critical feature is the segregation of duties (SoD) validation. This control mechanism ensures no single system user controls all aspects of any critical business process, reducing fraud and error risks. System administrators will be able to easily define incompatible tasks, ensuring that critical operations are not compromised. This feature is essential for leaders aiming to meet stringent regulatory requirements and maintain high levels of internal security. With integrated SoD validation, your business can minimize exposure to risk and better prepare for audits or regulatory reviews.
Gain greater control with advanced security features
The new features coming to Dynamics 365 will include several advanced security controls giving system administrators greater visibility and control over their environments. The role audit trail will provide a non-removable history of permission changes, making it easier to track and audit role modifications over time. Security versioning and snapshot capabilities will allow security snapshots at specific points, enabling easy comparison or restoration if needed. The temporary role assignment feature will be invaluable for managing employee absences, allowing roles to be reassigned while maintaining strict control over access. These capabilities will provide peace of mind for business leaders that require agile, yet secure, role management.
Control elevated privileges and secure sensitive data
A critical addition to the upcoming security features is the Elevated privilege management. (This is often referred to as super user privilege management (SPM) or ‘FireFighter’ in ERP world.) It provides the ability to manage and monitor elevated privileges for super users or administrators requiring temporary critical system access. Significantly reduce the risk of misuse or security breaches by restricting elevated access to specific, time-limited periods and tracking all super-user activities. This advanced control ensures only authorized personnel have access to sensitive systems, when necessary, further enhancing compliance and internal governance.
Optimize costs with detailed licensing insights
The upcoming license report based on the new licensing model allows organizations to see exactly what license levels are applied to each user, calculate the total cost of ownership (TCO), and validate license accuracy. This report, alongside others like role components with license indicators and duty components with license indicators, provides a comprehensive view of license usage, helping optimize license costs effectively. These tools empower better licensing management, ensuring customers only pay for what they need and maximizing the value of their ERP investments.
Looking ahead: the future of ERP security
As Microsoft Dynamics 365 ERP portfolio evolves, these new features mark a significant step forward in ERP security and governance. For system administrators, these tools will provide enhanced control, reduced risk, and greater efficiency in managing complex ERP environments. Integrating these features into daily operations ensures ERP systems are secure and aligned with latest industry standards and best practices.
Stay tuned for more updates as we continue to innovate, enhancing the Microsoft Dynamics 365 ERP portfolio. We look forward to delivering tools that empower you to excel in today’s dynamic business landscape.
This article is contributed. See the original author and article here.
As a Microsoft Partner, are you still determining what events to attend this fall?
Ultimate Partner LIVE – Executive Summit ’24, is your chance to elevate your Microsoft partnership and take your business to the next level. It’s about exclusive insights, personal connections, and real strategies for success. If you’re serious about growth in this ecosystem, you don’t want to miss this executive summit October 22-23, 2024, in Dallas, TX.
A key focus of the Summit will be understanding how an ecosystem approach enables partners to align with Microsoft, reach more customers and accelerate growth.
Sandy Gupta, Global VP for ISV at Microsoft will join Vince Menzione, Ultimate Partner CEO, for an exclusive strategic conversation to discuss Microsoft’s perspective on the ecosystem.
During this fireside chat you will learn:
Where cloud, AI, and digital transformation are headed, and what that means for your business. Jay McBain, Chief Analyst at Canalys, has predicted that GenAI will be a US$158 billion opportunity for the channel ecosystem by 2028. Sandy will discuss how the Microsoft partner ecosystem is aligning for this opportunity.
Real-world, actionable insights to position your software company to win in this ecosystem and unlock new growth opportunities. Microsoft recently commissioned a global study through IDC, “Microsoft Partners: Driving Economic Value and AI Maturity”. Key findings from the study show for every $1 of Microsoft revenue, partners who develop software generate $11.
About Sandy’s career path at Microsoft and how his unique viewpoint will shape Microsoft’s ISV strategy in FY25
Meet and ask questions to leaders like Sandy and his team during this event! Build deep, meaningful connections with other senior executives from leading Microsoft Partners and VP/GM Microsoft leaders from ISV, GSI, and CSP.
At Ultimate Partner, we bring the most important leaders, industry experts, and the Ultimate Partner Workshops to provide you a masterclass in two solid days.
Secure your ticket today, as they’re selling fast. Don’t miss out on driving your business forward with Microsoft’s latest innovations!
I can’t wait to host you in Dallas, where we will spark the ecosystem together.
This article is contributed. See the original author and article here.
As the business landscape rapidly evolves, integrating AI solutions into field service operations isn’t just a trend—it’s a necessity. Previously, we shared “5 steps for helping you become AI-ready in field service”. Today, we want to talk about how you can transform your field service organizations by using AI capabilities to drive efficiency, enhance customer satisfaction, and ultimately boost the bottom line.
Microsoft Dynamics 365 Field Service
Transform your service operations, deliver exceptional service, and improve customer experiences.
One of the most significant benefits of AI in field service is predictive maintenance. By using AI algorithms and machine learning models combined with Internet of Things (IoT) data, you can predict your customers’ equipment issues before they occur through continuous monitoring. But, predictive maintenance can also provide data-driven insights that can help you identify other patterns, trends, and potential areas for improvement—for example, energy expenditure—that help your customers see your field service organization as a partner.
Microsoft Dynamics 365 Field Service customers can use Connected Field Service to seamlessly connect their IoT devices to diagnose problems and identify potential issues even before customers become aware of them. Work orders are automatically generated based on IoT data and displayed in Field Service, where field service managers and dispatchers can then use the generative AI capabilities in Microsoft Copilot for Dynamics 365 to automate and streamline work order and resource management. This proactive approach also minimizes downtime, reduces repair costs, and can ensure uninterrupted service delivery to enhance customer experience and increase customer loyalty.
Optimizing frontline workforce management
Today’s enterprise companies can no longer rely on the old paper-based processes for scheduling and performing maintenance and repairs. While many organizations have made the switch to digital in the past several years, their processes remain in a half-digital, half-paper-based limbo that can end up making things more confusing than ever. Field service managers spend hours managing customer information—customer requirements, work orders, resources, schedules, and more. Having to switch between different applications—or between digital and paper—means mistakes are more likely to happen. The bottom line is somebody entering the wrong customer data can make insights and next steps less reliable—which can cost you money in the long run.
AI-powered workforce management tools can help you optimize scheduling and dispatching, helping to ensure that the right technician is assigned to the right job at the right time. This not only improves your operational efficiency, but also enhances customer satisfaction by reducing wait times and increasing first-time fix rates. Dynamics 365 Field Service Plugin for Microsoft Copilot in Outlook or Microsoft Teams enables your field service managers, dispatchers, and technicians to take advantage of generative AI capabilities that make them more efficient and responsive in servicing customers. With Microsoft Copilot, field service managers can simplify work order management by auto-summarizing work orders, assets, resources, bookings, and more. And more importantly, they can manage work orders inside the tool they use the most.
Maybe your field service managers spend a lot of time managing customer emails. Now, without leaving Outlook, they can use the Field Service Copilot pane to help them streamline work order creation with relevant details pre-populated from emails and provide key work order information. The scheduling suggestions in the Field Service Copilot pane also helps service managers schedule field technicians based on travel time, availability, skill set, and more. Your field service managers can also easily schedule work orders using Copilot for Field Service in Teams. As it does in Outlook, the app suggests scheduling options based on factors including availability, skill set, distance to the customer site, preferred time slots, and more. They can also use natural language search in Teams to locate information including guides and manuals, work orders, customer history, and more.
Field technicians can struggle with tightly packed schedules, especially when appointments and routes need to be updated during the day. Now, AI-powered work order updates (in preview) in Copilot in Dynamics 365 Field Service mobile app enable your field technicians to update work orders on the fly by describing work performed in natural language, using either text or speech-to-text capabilities. Based on their input, Copilot recommends updates to work order fields and updates them after confirmation from the field technician. Field technicians can also view AI-generated work order recaps on the go without having to navigate through customer records to view pertinent information.
Enhancing customer experience
Using Microsoft Copilot Studio, customers can create AI-powered chatbots and virtual assistants to provide instant support to their end users, answering queries, and resolving issues in real-time. This 24/7 availability enhances customer experience, helping lead to higher satisfaction and loyalty. You can automate routine customer conversations with field service technicians, such as calls about regularly scheduled maintenance or warranty calls. This enables your technicians to focus on more high value conversations. A benefit of AI-powered chatbots created using Microsoft Copilot Studio is that customers can interact with them using natural language to describe their questions or issues. Any information collected from the chatbot can also be used to pre-populate work orders, helping technicians resolve issues or schedule service appointments faster. You can also use AI-powered chatbots to help keep your customers informed with automated service reminders and notifications via email and text messaging or enable them to reschedule appointments.
Driving data-driven decision making
By analyzing vast amounts of data, AI can uncover patterns and insights more efficiently than human analysts, providing you with better data to help you make more informed decisions. When it comes to your field service organization, using AI to discover trends and patterns can help with strategic planning and drive continuous improvement.
Dynamics 365 Field Service provides a resource and utilization report, a work order summary report, an optimization summary, and an admin report to help you drill down into how your field service operations are performing. You can also connect to Microsoft Dataverse, the intelligent data platform that powers Microsoft Dynamics 365 apps and the Microsoft Power Platform, to access your Field Service data and other relevant customer or operational data to create custom reports. For customers using the Microsoft Power BI Premium service, Dynamics 365 offers various ways to visualize your data using Microsoft Copilot in Power BI to get the most from your data. You can use natural language to get quick and easy summaries, or you can refine or guide the summary by customizing prompts, such as “summarize this page using bullet points” or “provide a summary of work orders on this page”. You can also ask specific questions about the visualized data on a report page and receive a tailored response. This response includes references to specific visuals, aiding you in understanding the specific data sources contributing to each part of the answer or summary within a report.
G&J Pepsi-Cola Bottlers: Transformative AI in action
G&J Pepsi-Cola Bottlers has successfully implemented AI in their field service operations, leading to significant improvements. By integrating Dynamics 365 Field Service with AI capabilities, they have streamlined their work order management, reduced manual tasks, and improved scheduling efficiency. The introduction of Copilot in Dynamics 365 Field Service has further enhanced their operations by providing technicians with real-time assistance and insight.
The future of field service
The integration of AI into field service is no longer a futuristic concept. It’s a present-day reality. Business decision makers who embrace this technology can expect to see significant improvements in efficiency, customer satisfaction, and overall business performance. Now is the time to harness the power of transformative AI and lead your field service operations into the future.
This article is contributed. See the original author and article here.
Welcome to the Viva Glint newsletter. These recurring communications coincide with platform releases and enhancements to help you get the most out of the Viva Glint product. You can access the current newsletter and past editions on the Viva Glint blog.
Glint released its latest new features and enhancements on September 21, 2024. Scheduled monthly releases and regular maintenance are how we best serve our customers. Your dashboard provides date and timing details two or three days before releases. See our future release and downtime dates. Follow along with what features are ahead: Viva Glint product roadmap.
Microsoft 365 Copilot in Viva Glint
Copilot in Viva Glint summarizes non-English survey comments. As a Copilot user, you’ll still interact with Copilot in English, but Copilot now summarizes non-English comments left by survey respondents. To gather the best feedback, encourage your employees to leave comments in their native language. Microsoft 365 Copilot currently supports 27 languages.
Learn how Microsoft HR uses Viva and Microsoft 365 Copilot to empower employees. Using a human-centric approach, Microsoft HR rolled out Microsoft 365 Copilot to their global HR organization. Read the blog about how Microsoft uses Viva to communicate, encourage skilling and development, and measure success.
New on your Viva Glint platform
360 feedback programs are included with all Viva Glint purchases! 360 feedback programs provide multiple perspectives for gathering insights into an employee’s strengths and opportunities, with a long-term focus on improvement.
Export reports to PDFs easily and quickly. Now the Export feature in all Glint reports includes a full PDF experience with quick generation time and capabilities such as search, markup, highlight, and preview. You can also select which report sections to export – an enhancement our customers have been requesting! Read about PDF enhancements.
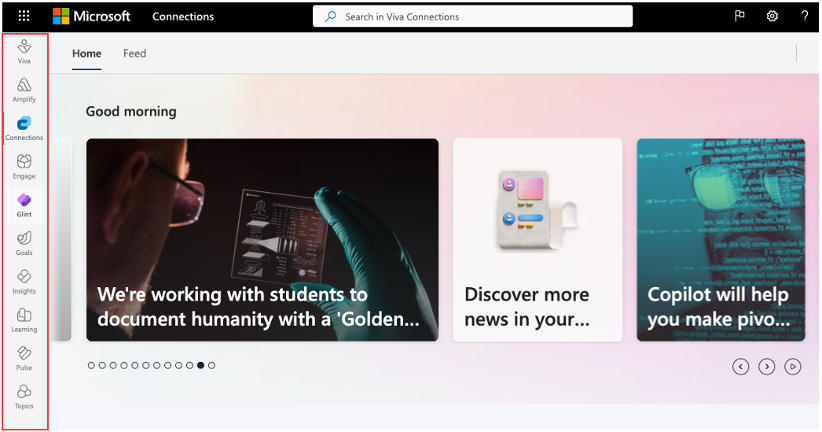
Navigate between Viva apps with ease. The Viva App Bar is a shared Microsoft component that enables Viva suite users to seamlessly discover and navigate between Viva apps they have purchased on the web. Viva Glint is integrating with these shared navigation elements to allow our users to have consistent experiences across Viva apps.
Enhanced data controller experience. Microsoft Viva Glint Administrators can decide how survey responses are handled for deleted users and how Glint reuses employee IDs over time. Learn about new user data options in the General Settings feature and its impact on user deletion.
Collaborate in Viva Glint across multiple tenants. Use Microsoft 365’s multitenant organization (MTO) feature to let survey takers and dashboard users from multiple tenants access Glint on a home tenant. Get a holistic view of your organization’s employee sentiment, no matter how complex your tenant configuration.
Our next session in this popular series focuses on maximizing survey participation. Bring your questions! Register
AI Empowerment: How HR uses AI | October 22
Join us to hear how HR professionals use AI to work more effectively. This session covers key features, capabilities, and use cases for AI within the HR function, and recommendations on how it can help you be more effective in your role. Register
Events you may have missed
Catch up with recordings and recaps released since our last newsletter:
September 2024 Town Hall: Read about and watch the recording from our first Town Hall. So much has happened and there is so much more to come!
Do your managers feel equipped to understand and act on feedback? Viva People Science conducted a study with 700+ US-based managers across a variety of industries to gain a deeper understanding of their experience, from common practices to barriers when it comes to acting on employee feedback. Learn more about the critical findings.
Accelerate AI transformation with our new eBook.The state of AI change readiness, from the Viva People Science team, outlines findings on AI readiness, discusses implications, and provides practical guidance for leaders and HR on best to support people through change related to AI at work.
Build a holistic employee listening strategy. Take time to align with your internal stakeholders and complete our Holistic Listening Vision and Strategy Discovery Workbook from the Viva People Science team. This workbook helps you consider information important to your listening strategy and for tracking progress.
Coming soon: learn about the combined powers of Viva Glint, Viva Insights, and Viva Pulse. Together these apps measure employee engagement and productivity while giving you actionable insights. Keep your eyes out for a new communication where we will be highlighting features, customer success stories, and events featuring these products.


Recent Comments