by Contributed | Jun 1, 2021 | Technology
This article is contributed. See the original author and article here.
One of the important goals of Azure Security Center is to help you understand your current security situation. Azure Security Center continuously assesses your resources for security issues and flags a resource as healthy or unhealthy accordingly providing you recommendations.
Automation is not new in Azure Security Center, it reduces overhead and can improve your security by ensuring the process steps are done quickly, consistently and according to your predefined requirements. Azure Resource Graph and Azure Security Center’s REST APIs gives you great capability to achieve this goal. We recently added two new time indicator fields to both Microsoft.security/assessments REST API provider and Azure Resource Graph to help you have more visibility into when was a resource first identified as unhealthy/healthy (firstEvaluationDate) and when the resource status changed to healthy/unhealthy (statusChangeDate) with the help of which, you can create automations around Cloud Security Posture Management (CSPM). Learn more about these fields here. The time-indicator fields makes it even more easy for you to automate and build your own playbooks for e.g., an automation my dear friend created recently to notify about new stale resources.
Today I want to introduce you to another automation that uses Time Indicators (firstEvaluationDate and statusChangeDate) to show the average time it needs for your resource owners to remediate a particular security control or recommendation.
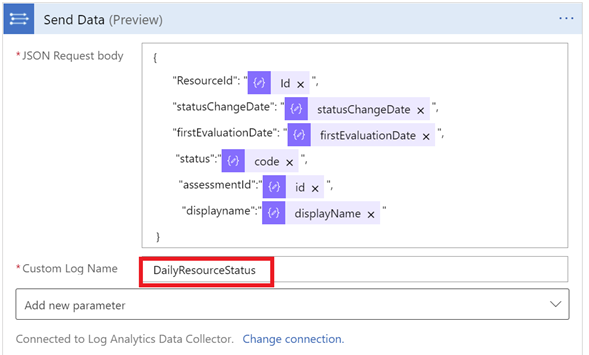
This playbook is configured to run every 24hrs to pull the assessment information from the API and exports the assessments identified by Azure security center to a custom log of the Log Analytics workspace
 Example Custom log created in the Log analytics workspace
Since the Log Analytics workspace has the historical data now, the logic app starts by iterating all the healthy assessments of the resources and if the assessment status is found to be “healthy”, it queries the history to check if that resource was ever “unhealthy” and logs the previousStatus date.
 previousStatus calculation example
The difference of these dates will be written to an array to calculate the average in the next loop.
The Logic App is using ticks, to calculate the specific timestamp inorder to get the average time. One of the challenges using the built-in date/time functions in Logic App, addToTime() or addSeconds(), is it can only handle as precise as seconds, while ticks provide ten million times more accurate values, which we lose a certain level of precision.
 Use of Ticks to calculate timestamp
The output of the HealthyArray variable will be passed to an Aggregation loop to calculate the average time for all those resources whose previousState was unhealthy.
This value is passed to a to a custom log of the Log Analytics workspace which represents the average time taken to remediate the resources to better RCA for changes.
 Example Custom log created in the Log analytics workspace representing average time
The playbook will also calculate the total number of unhealthy resources in the 24hrs period and the top ‘five’ security controls that are unhealthy in your environment and will then compose a new HTML email body and send it to the address(es) that you determine when deploying the automation to your environment.
 Example email generated from the automation
Note:
Make sure to manually trigger the playbook once you’ve met all prerequisites. Since this Playbook creates a custom log in the Log Analytics Workspace, for the first few runs the logicapp will error out until there’s data in the workspace for it to pull. Once the custom table gets populated in the workspace, you’ll start receiving the results.
What are you waiting for? Go ahead and deploy this automation from our Azure Security Center Github repository using the provided ARM template and let us know your feedback.
Now that we have given you a good head start on how to use these fields, show us your creativity using the time indicators and don’t forget to let us know how these new fields (firstEvaluationDate and statusChangeDate) are helpful for you.
Acknowledgements:
Thanks to for @Miri Landau, @Ronny Keshet for envisioning this wonderful automation idea.
by Contributed | Jun 1, 2021 | Technology
This article is contributed. See the original author and article here.
It’s been a while since we last talked about the events captured by Microsoft Defender for Identity. We last published a blog in August last year and so we thought it would be a good opportunity to give you an update with the latest events you can use to hunt for threats on your domain controllers using advanced hunting in Microsoft 365 Defender.
As a general rule of thumb, all Defender for Identity activities that are available in Microsoft 365 Defender advanced hunting fit into one of four data sets:
- IdentityInfo
- IdentityLogonEvents
- IdentityQueryEvents
- IdentityDirectoryEvents
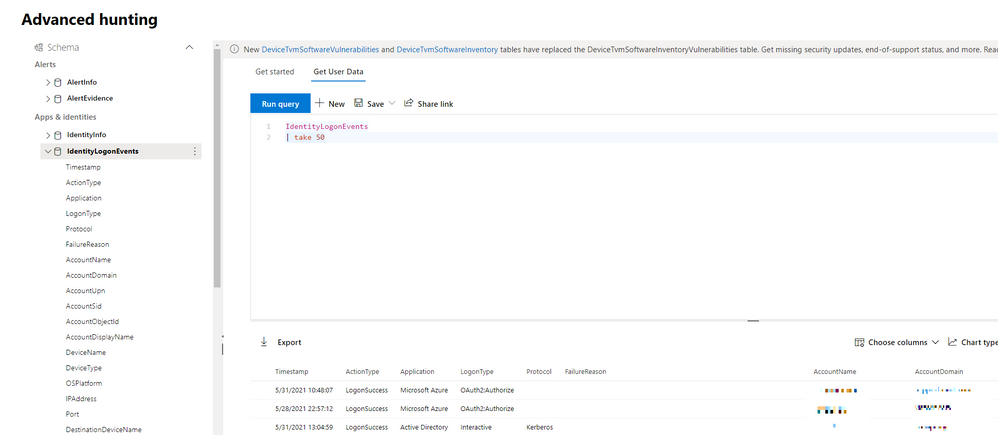
(Figure 1 – The advanced hunting console available as part of Microsoft 365 Defender)
Learn about accounts in your organization using IdentityInfo
Every effective threat hunting style investigation starts with understanding what users we are protecting, and this is what we are presented with using the IdentityInfo table. Although this data set is not exclusive to Defender for Identity, it does provide comprehensive details for the accounts being utilized in the environment. Using information made available from this data set, you can easily correlate different account attributes such as cloud / on-premises SID, UPN, and object ID.
This table also provides rich account information from Active Directory such as personal details (name, surname, city, country), professional information (job title, department, email address), and other AD attributes (domain, display name).
//Find out what users are disabled.
IdentityInfo
| where IsAccountEnabled == “0”
| summarize arg_max(AccountName,*) by AccountUpn
Correlating information between Defender for Identity and Defender for Endpoint
With Defender for Identity installed in your organization, your on-premises Active Directory identities are protected against advanced threats, and you also have visibility into various logon events. These authentication activities, along with those being captured by Azure AD feeds into IdentityLogonEvents data set, where you can hunt over authentication activities easily.
Defender for Identity activities are covering authentications over Kerberos, LDAP, and NTLM. Each authentication activity provides details such as the account information, the device the authentication activity was performing on, network information (such as the IP and port number), and more.
Harnessing this data, you can easily hunt over abnormal logons during non-working hours, learn more about logon routine in the network, and correlate data with Microsoft Defender for Endpoint.
// Enrich logon events with network activities happening on the device at the same time
IdentityLogonEvents
| where Timestamp > ago(7d)
| project LogonTime = Timestamp, DeviceName, AccountName, Application, LogonType
| join kind=inner (
DeviceNetworkEvents
| where Timestamp > ago(7d)
| project NetworkConnectionTime = Timestamp, DeviceName, AccountName = InitiatingProcessAccountName, InitiatingProcessFileName, InitiatingProcessCommandLine
) on DeviceName, AccountName
| where LogonTime - NetworkConnectionTime between (-2m .. 2m)
Queries targeting Active Directory objects
With IdentityQueryEvents, you can quickly find out what queries are targeting the domain controller. Queries can happen over the network either naturally by different services or legitimate activities in the network but can often be used by an attacker to perform reconnaissance activities on different objects like users, groups, devices or domains – seeking out those with certain attributes or privileges.
In certain attack vectors, like AS-REP Roasting that we covered in an earlier blog post, the reconnaissance portion often involves the attacker performing enumeration techniques to find users that have the pre-authentication attribute turned on. This can be found easily with a similar query:
// Enrich logon events with network activities happening on the device at the same time

IdentityLogonEvents
| where Timestamp > ago(7d)
| project LogonTime = Timestamp, DeviceName, AccountName, Application, LogonType
| join kind=inner (
DeviceNetworkEvents
| where Timestamp > ago(7d)
| project NetworkConnectionTime = Timestamp, DeviceName, AccountName = InitiatingProcessAccountName, InitiatingProcessFileName, InitiatingProcessCommandLine
) on DeviceName, AccountName
| where LogonTime - NetworkConnectionTime between (-2m .. 2m)
Track Active Directory changes
Finally, we have the IdentityDirectoryEvents table. In general, this table captures three categories of events on your domain controller:
- Remote code execution.
- Changes to attributes of Active Directory objects, including groups, users, and devices.
- Other activities performed against the directory, such as replication or SMB session enumeration.
Also, starting with Defender for Identity version 2.148, if you configure and collect event ID 4662, Defender for Identity will report which user made the Update Sequence Number (USN) change to various Active Directory object properties. For example, if an account password is changed and event 4662 is enabled, the event will record who changed the password. As a result, this information can be found using advanced hunting.
Here is a sample query you can use:
// Track service creation activities on domain controllers
IdentityDirectoryEvents
| where ActionType == "Service creation"
| extend ServiceName = AdditionalFields["ServiceName"]
| extend ServiceCommand = AdditionalFields["ServiceCommand"]
| project Timestamp, ActionType, Protocol, DC = TargetDeviceName, ServiceName, ServiceCommand, AccountDisplayName, AccountSid, AdditionalFields
| limit 100
As always, please let us know what you think and how we can enhance this capability further. Let us know what you use advanced hunting for in the comments too!
To learn more about advanced hunting in Microsoft 365 Defender and these new enhancements, go to the following links:
by Contributed | Jun 1, 2021 | Technology
This article is contributed. See the original author and article here.
Hello developers :waving_hand:! In this article, we introduce our project “Plant AI :shamrock:” and walk you through our motivation behind building this project, how it could be helpful to the community, the process of building this project, and finally our future plans with this project.
Plant AI :shamrock: is a web application :globe_with_meridians: that helps to easily diagnose diseases in plants from plant images using Machine Learning available on the web. We provide an interface on the website where you can upload images of your plant leaves. Since we focus on plant leaf diseases we can detect the plant’s diseases by seeing an image of the leaves. We also provide users easy ways to treat the diagnosed disease.
As of now, our model supports 38 categories of healthy and unhealthy plant images across species and diseases. See the complete list of supported diseases and species can be found here. If you are want to test out Plant AI, you can use one of these images.
Guess, what? This project is also completely open-sourced:star:, here is the GitHub repo for this project: https://github.com/Rishit-dagli/Greenathon-Plant-AI
The motivation behind building this
Human society needs to increase food production an estimated 70% by 2050 to feed an expected population size that is predicted to be over 9 billion people [1]. Currently, infectious diseases reduce the potential yield by an average of 40% with many farmers in the developing world experiencing yield losses as high as 100%.
The widespread distribution of smartphones among farmers around the world offers the potential of turning smartphones into a valuable tool for diverse communities growing food.
Our motivation with Plant AI is to aid crop growers by turning their smartphones into a diagnosis tool that could substantially increase crop yield and reduce crop failure. We also aim to make this rather easy for crop growers so the tool can be used on a daily basis.
How does this work?
As we highlighted in the previous section, our main target audience with this project is crop growers. We intend for them to use this on a daily basis to diagnose disease from their plant images.
Our application relies on the Machine Learning Model we built to identify plant diseases from images. We first built this Machine Learning model using TensorFlow and Azure Machine Learning to keep track, orchestrate, and perform our experiments in a well-defined manner. A subset of our experiments used to build the current model have also been open-sourced and can be found on the project’s GitHub repo.
We were quite interested in running this Machine Learning model on mobile devices and smartphones to further amplify its use. Using TensorFlow JS to optimize our model allows it to work on the web for devices that are less compute-intensive.
We also optimized this model to work on embedded devices with TensorFlow Lite further expanding the usability of this project and also providing a hosted model API built using TensorFlow Serving and hosted with Azure Container Registry and Azure Container Instances.
We talk about the Machine Learning aspect and our experiments in greater detail in the upcoming sections.
 The model in action
To allow plant growers to easily use this Plant AI, we provide a fully functional web app built with React and hosted on Azure Static Web Apps. This web app allows farmers to use the Machine Learning model and identify diseases from plant images all on the web. You can try out this web app at https://www.plant-ai.tech/ and upload a plant image to our model. In case you want to test out the web app we also provide real-life plant images you can use.
We expect most of the traffic and usage of Plant AI from mobile devices, consequently, the Machine Learning model we run through the web app is optimized to run on the client-side.
This also enables us to have blazing fast performance with our ML model. We use this model on the client-side with TensorFlow JS APIs which also allows us to boost performance with a WebGL backend.
Building the Machine Learning Model
Building the Machine Learning Model is a core part of our project. Consequently, we spent quite some time experimenting and building the Machine Learning Model. We had to build a machine learning model that offers acceptable performance and is not too heavy since we want to run the model on low-end devices
Training the model
We trained our model on the Plant Village dataset [2] on about 87,000 (+ augmented images) healthy and unhealthy leaf images. These images were classified into 38 categories based on species and diseases. Here are a couple of images the model was trained on:

We experimented with quite a few architectures and even tried building our own architectures from scratch using Azure Machine Learning to keep track, orchestrate, and perform our experiments in a well-defined manner.
It turned out that transfer learning on top of MobileNet [3] was indeed quite promising for our use case. The model we built gave us the acceptable performance and was close to 12 megabytes in size, not a heavy one. Consequently, we built a model on top of MobileNet using initial weights from MobileNet trained on ImageNet [4].
We also made a subset of our experiments used to train the final model for public use through this project’s GitHub repository.
Running the model on a browser
We applied TensorFlow JS (TFLS) to perform Machine Learning on the client-side on the browser. First, we converted our model to the TFJS format with the TensorFlow JS converter, which allowed us to easily convert our TensorFlow SavedModel to TFJS format. The TensorFlow JS Converter also optimized the model for the web by sharding the weights into 4MB files so that they can be cached by browsers. It also attempts to simplify the model graph itself using Grappler such that the model outputs remain the same. Graph simplifications often include folding together adjacent operations, eliminating common subgraphs, etc.
After the conversion, our TFJS format model has the following files, which are loaded on the web app:
- model.json (the dataflow graph and weight manifest)
- group1-shard*of* (collection of binary weight files)
Once our TFJS model was ready, we wanted to run the TFJS model on browsers. To do so we again made use of the TensorFlow JS Converter that includes an API for loading and executing the model in the browser with TensorFlow JS :rocket:. We were excited to run our model on the client-side since the ability to run deep networks on personal mobile devices improves user experience, offering anytime, anywhere access, with additional benefits for security, privacy, and energy consumption.
Designing the web app
One of our major aims while building Plant AI was to make high-quality disease detection accessible to most crop growers. Thus, we decided to build Plant AI in the form of a web app to make it easily accessible and usable by crop growers.
As mentioned earlier, the design and UX of our project are focused on ease of use and simplicity. The basic frontend of Plant AI contains just a minimal landing page and two other subpages. All pages were designed using custom reusable components, improving the overall performance of the web app and helping to keep the design consistent across the web app.
Building and hosting the web app
Once the UI/UX wireframe was ready and a frontend structure was available for further development, we worked to transform the Static React Application into a Dynamic web app. The idea was to provide an easy and quick navigation experience throughout the web app. For this, we linked the different parts of the website in such a manner that all of them were accessible right from the home page.
 Web landing page
Once we can access the models we load them using TFJS converter model loading APIs by making individual HTTP(S) requests for loading the model.json file (the dataflow graph and weight manifest) and the sharded weight file in the mentioned order. This approach allows all of these files to be cached by the browser (and perhaps by additional caching servers on the internet) because the model.json and the weight shards are each smaller than the typical cache file size limit. Thus a model is likely to load more quickly on subsequent occasions.
We first normalize our images that is to convert image pixel values from 0 to 255 to 0 to 1 since our model has a MobileNet backbone. After doing so we resize our image to 244 by 244 pixels using nearest neighbor interpolation though our model works quite well on other dimensions too. After doing so we use the TensorFlow JS APIs and the loaded model to get predictions on plant images.
Hosting the web app we built was made quite easy for us using Azure Static Web Apps. This allowed us to easily set up a CI/ CD Pipeline and Staging slots with GitHub Actions (Azure’s Static Web App Deploy action) to deploy the app to Azure. With Azure Static Web Apps, static assets are separated from a traditional web server and are instead served from points geographically distributed around the world right out of the box for us. This distribution makes serving files much faster as files are physically closer to end users.
Future Ideas
We are always looking for new ideas and addressing bug reports from the community. Our project is completely open-sourced and we are very excited if you have feedback, feature requests, or bug reports apart from the ones we mention here. Please consider contributing to this project by creating an issue or a Pull Request on our GitHub repo!
One of the top ideas we are currently working on is transforming our web app into a progressive web app to allow us to take advantage of features supported by modern browsers like service workers and web app manifests. We are working on this to allow us to support:
- Offline mode
- Improve performance, using service workers
- Platform-specific features, which would allow us to send push notifications and use location data to better help crop growers
- Considerably less bandwidth usage
We are also quite interested in pairing this with existing on-field cameras to make it more useful for crop growers. We are exploring adding accounts and keeping a track of images the users have run on the model. Currently, we do not store any info about the images uploaded. It would be quite useful to track images added by farmers and store information about disease statistics in a designated piece of land on which we could model our suggestions to treat the diseases.
Thank you for reading!
If you find our project useful and want to support us; consider giving a star :star: on the project’s GitHub repo.
Many thanks to Ali Mustufa Shaikh and Jen Looper for helping me to make this better. :)
Citations
[1] Alexandratos, Nikos, and Jelle Bruinsma. “World Agriculture towards 2030/2050: The 2012 Revision.” AgEcon Search, 11 June 2012, doi:10.22004/ag.econ.288998.
[2] Hughes, David P., and Marcel Salathe. “An Open Access Repository of Images on Plant Health to Enable the Development of Mobile Disease Diagnostics.” ArXiv:1511.08060 [Cs], Apr. 2016. arXiv.org, http://arxiv.org/abs/1511.08060.
[3] Howard, Andrew G., et al. “MobileNets: Efficient Convolutional Neural Networks for Mobile Vision Applications.” ArXiv:1704.04861 [Cs], Apr. 2017. arXiv.org, http://arxiv.org/abs/1704.04861.
[4] Russakovsky, Olga, et al. “ImageNet Large Scale Visual Recognition Challenge.” ArXiv:1409.0575 [Cs], Jan. 2015. arXiv.org, http://arxiv.org/abs/1409.0575.

by Contributed | Jun 1, 2021 | Technology
This article is contributed. See the original author and article here.
360° imagery is a great way to explore the benefits of Mixed Reality while limiting up-front investments in either equipment (e.g. HoloLens and advanced MR headsets) or specialized talent (e.g. 3D artists). There are so many different scenarios for using these images within your organization. These can include training and onboarding employees (e.g. facility tours), celebrating and sharing capabilities of new facilities, and many explorations around documenting current state and monitoring progress of physical spaces. Basically, any time you have a physical space that you need to document or communicate about to others, 360° imagery can be a great tool.
For me, that also extends outside work to backcountry ski adventures where I can show friends, family, and co-workers what it is like to experience remote backcountry destinations that can be a bit challenging to get to. Check out this video below for a quick view of what’s possible or go check out how it was made using the SharePoint spaces 360° tour web part.
SharePoint spaces offers significant flexibility for handling 360° images and videos. Most tools available to capture 360° images and videos will work with Spaces. However, there are several considerations you may not be familiar with from working with 2D images. There are also ways that you can optimize quality and performance both today and into the future as mixed reality devices expand in availability and quality. Here are a few key questions to keep in mind along with suggestions for tools that work well with Spaces today:
- What is the target device? Virtual Reality or Browser, Mobile or Desktop
- Is it better to capture 360° images or video?
- What is the right mix of content?
- What devices can capture 360° images?
- What formats does SharePoint spaces support?
Target Device
Interacting with your spaces has never been easier, SharePoint spaces supports viewing either in a web browser or using mixed reality headsets. The same content can be used for both, but if your primary use case is the browser, it does not make sense to use stereoscopic content. To create the best experience when viewing you may have to reduce resolution or file size to optimize for mobile or standalone VR headsets.
Images or Video
For the sake of simplicity, we recommend starting with 360° images and exploring video only when there is a strong need to capture a dynamic and changing space. Capturing and displaying high quality 360° video is notably more challenging than 360° images. If you pursue videos, make sure you add captions or a transcript and follow the best practices for video format, resolution, etc.
Combining 360° and 2D Images and Videos
In many cases, the best experience can be created by combining video and images, SharePoint spaces supports both 360° and 2D images and videos in the same space. You will find that 360° images are great for understanding spatial context (e.g where things are within a room) but 2D images or videos are useful to highlight specific areas within the image using a high resolution and artfully composed view of a few areas you want to highlight. Users will understand the context from the 360° image while appreciating the detail, artistry, and focused storytelling that are characteristic of high quality 2D images and videos. Spaces makes it easy to combine the two, just add your 2D images as annotations using the 360° tour web part.
Capture Devices
There are many options available for capturing 360° images ranging from smartphone apps (e.g. Google Camera Photo Spheres) to simple consumer handheld 360° cameras (e.g. Ricoh Theta, Insta 360 One X) to more complicated commercial high resolution and stereoscopic cameras (e.g. Insta360 Pro 2). These devices will generally produce outputs that are usable immediately in SharePoint spaces, but often the experience can be improved by optimizing to balance quality and file size as described below. If you are going to be capturing a lot of 360° images, a dedicated camera is recommended because it will be a much faster workflow.
Smartphone apps can produce high resolution and high-quality images, but they require you to take multiple images that are assembled into a 360° image by the app. This means the process of capturing images will be slower than a dedicated multi-lens 360° camera (consumer handheld or commercial). Unless the scene is completely static during the capture, they can also produce image artifacts such as ghosting as seen in this image:

Recommended Image Settings
Format
While SharePoint spaces supports many options for image format (JPG, TIFF, PNG, etc.), we recommend storing images as equirectangular progressive JPEG images with quality setting set to 80% or equivalent in various software tools. Most 360° cameras automatically output equirectangular JPEG images. These can be batch optimized to reduce file size and set the quality setting using various tools like Adobe Photoshop or RIOT image optimizer after the images are captured.
Resolution
It is best to capture images with the highest resolution possible. Equirectangular images have a 4:2 aspect ratio (twice as many pixels wide as tall). We recommend using 8K resolution (8192 X 4096) to achieve maximum quality 360° image output in SharePoint spaces while balancing file size, download time, etc. However, lower resolutions are often acceptable – especially if your goal is communication, documentation, or collaboration instead of a showcase visual experience.
Two examples are shown below – the first is an 8K image (captured with an Android smart phone) while the second is 5.3K resolution (captured with a consumer handheld Ricoh Theta V). Although the 5.3K resolution is acceptable quality for many applications, the 8K resolution captures notably more detail.
If using a camera that can capture above 8K resolution it would be a best practice to keep images at the highest resolution and use image editing tools like Adobe Photoshop or RIOT to save versions optimized for SharePoint spaces. That will allow you to update your SharePoint space as higher resolution mixed reality headsets become available and those extra pixels can be put to good use.
 8K Image in SharePoint spaces
 5.3K image in SharePoint spaces
Conclusion
Following these guidelines should make sure your 360° imagery maintains high quality while balancing performance and load time. Have some ideas for what we should do next with 360° imagery in SharePoint spaces? Let us know what you are looking for or share your 360° imagery scenario in the comments.
by Contributed | Jun 1, 2021 | Technology
This article is contributed. See the original author and article here.
Final Update: Tuesday, 01 June 2021 15:51 UTC
We’ve confirmed that all systems are back to normal with no customer impact as of 06/01, 14:50 UTC. Our logs show the incident started on 06/01, 09:10 UTC and that during the 5 hours 40 minutes that it took to resolve the issue some customers may have experienced failed attempts when performing control plane CRUD operations in US Gov Virginia.
- Root Cause: The failure was due one of our backend dependent service.
- Incident Timeline: 5 Hours & 40 minutes – 06/01, 09:10 UTC through 06/01, 14:50 UTC
We understand that customers rely on Application Insights as a critical service and apologize for any impact this incident caused.
-Harshita

Recent Comments