Power BI Reports  for Azure Lab Services – Part 1: Visualizing Cost Management Data

Power BI Reports for Azure Lab Services – Part 1: Visualizing Cost Management Data

This article is contributed. See the original author and article here.

Azure Lab Services costs are integrated with Cost Management on the lab account level.  However, sometimes it’s useful to create a custom report for your team.  We can do this using the line item data from Cost Management.  In this blog post we will use Power BI desktop to create a basic report that shows total cost, total number of virtual machines and total number of labs.  The report will also include a table that shows cost per lab and cost per virtual machine.


planetmaher_0-1629153655517.png


To create this report, we need to complete four major tasks.


  1. Get the data. We need to import data into PowerBI.

  2. Transform the data.   Each cost line item has all the information we need, but it will need to be separated, so we can work with lab and lab virtual machine information individually.

  3. Create the data visualization.

  4. Publish the report for others to see.


Get the data


There are couple options to import the Cost Management data into PowerBI.  Which one to use will depend on your type of Azure agreement and your permission level.


Azure Cost Management connector


The first option is the Azure Cost Management connector. Follow the instructions at Create visuals and reports with the Azure Cost Management connector in Power BI Desktop.  You will need to provide a billing scope which could cover from a billing agreement to a specific resource group.  See understand and work with Azure Cost Management scopes for more information about scopes.  See identify resource id for a scope for instructions to get billing scope based on the type of scope you are using.


The Azure Cost Management connector currently supports customers with a Microsoft Customer Agreement or an Enterprise Agreement (EA).  There are also some unsupported subscription types.  To successfully use the connector, you must have correct permissions and the ability for users to read cost management data must be enabled by the tenant administrator.  You can check your access by calling the cost management usage detail api directly.


Azure Cost Management exports


The second option is to export costs to a storage account fromAzure Cost Management.  Follow instructions at Tutorial – Create and manage exported data from Azure Cost Management | Microsoft Docs to create the recurring export.  You can choose to have data exported daily, weekly or monthly.  Each export will be a CSV file saved in blob storage.


In PowerBI Desktop, we will use the Azure Blob Storage connector to import this data.  Select the usage detail data from the storage account container you used when scheduling the cost management data exports.  Choose to combine the files when importing the CSV file data.


Transform the data


Each usage detail line item has the information for the full resource id of the virtual machine (either template or student) associated with the cost.  As explained in cost management guide for Azure Lab Services, these resources will follow one of two patterns. 


For templates virtual machines:


/subscriptions/{subscription-id}/resourceGroups/{resource-group}/providers/Microsoft.LabServices/labaccounts/{lab-account-name}/environmentsettings/default

For student virtual machines:


/subscriptions/{subscription-id}/resourceGroups/{resource-group}/providers/Microsoft.LabServices/labaccounts/{lab-account-name}/environmentsettings/default/environments/{vm-name}

For our report, we will need to extract the required data the from the InstanceId property of the Cost Management usage details.  Complete the following steps in Power Query.


  1. Filter on ConsumedService equal to microsoft.labservices

  2. Remove duplicate rows.  We do this to avoid any issues if using Cost Management exports and data is accidentally exported multiple times.  Select all columns except the Source.Name.

  3. Duplicate InstanceId column and rename it ResourceId.

  4. Split the InstanceId column on the ‘/’ character.

  5. Clean up split columns.

    1. Delete InstanceId.1 to InstanceId.8.  We already have the SubscriptionGuid and ResourceGroup columns, so the InstanceId.3 and InstanceId.5 columns aren’t needed. 

    2. Rename InstanceId.9 to LabAccount.

    3. Delete InstanceId.10.

    4. Rename InstanceId.11 to Lab.

    5. Delete InstanceId.12 to InstanceId.14.

    6. Rename InstanceId.15 to VirtualMachine.

    7. Replace ‘null’ values with ‘template’.  Any rows that don’t have a value for VirtualMachine are costs associated with running the template virtual machine for the lab.


  6. Save transformations.


Schema for the table should look something like the picture below.  Depending on your Azure subscription type, there may be more columns not seen in this example.


planetmaher_1-1629153655523.png


Visualize the data


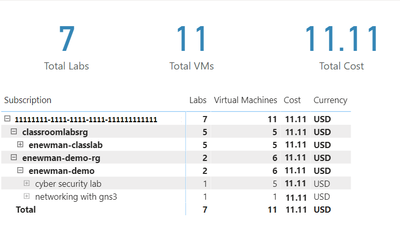
First, let’s create some cards for high-level information.  Our cards will show the total cost, number of labs and number of virtual machines used. 


Total Cost


The total cost is held in the PreTaxCost column.  PowerBI already recognizes that PreTaxCost is number and will automatically add all the column values to create a sum.  Add a card to the visual and add PreTaxCost to the Field property of the card visualization.  Optionally change the name for the visualization from PreTaxCost to Total Cost.  


planetmaher_2-1629153655529.png


Number of Labs


Next, let’s display the number labs.  We’ll need to create a new measure for this.  For instructions explaining how to create a new measure, see create your own measures in Power BI Desktop tutorial


For the most accurate reporting, we can’t just create a measure that counts all the distinct values in the Lab column because it is possible to have two labs with the same name in different lab accounts.  So, for our measure named NumberOfLabs we will count the number of rows when grouped by all the identifying columns for a lab, which are subscription, resource group, lab account and lab name.  Note, in this example the table name is dailyexports.


NumberOfLabs = COUNTROWS(GROUPBY(dailyexports, dailyexports[SubscriptionGuid], dailyexports[ResourceGroup], dailyexports[LabAccount], dailyexports[Lab]))

Now we can create a card for the NumberOfLabs measure by following instructions at create card visualizations (big number tiles).


Total Number of Virtual Machines


Creating a card for the total number of virtual machines used will be similar to creating a card for total number of labs.  We need to create a measure that counts the unique combination of subscription, resource group, lab account, lab and virtual machine name.  Our new measure is


NumberOfVMs = COUNTROWS(GROUPBY(dailyexports, dailyexports[SubscriptionGuid], dailyexports[ResourceGroup], dailyexports[LabAccount], dailyexports[Lab], dailyexports[VirtualMachine]))

Now we can create a card for NumberOfVMs measure by following instructions at create card visualizations (big number tiles) .


Matrix


Now let’s create a matrix visual to allow us to drill down into our data. For instructions how to create a matrix visualization, see create a matrix visual in Power BI.  For our matrix visualization, we’ll add the Subscription, ResourceGroup, Lab Account, Lab, VirtualMachine for the rows.  NumberOfLabs, NumberOfVMs, PreTaxCost and Currency will be our values.  Note, for the currency column, the first value for currency will be shown with the matrix is collapsed.


After of renaming the columns for the visuals and applying some theming, our report now looks like the following picture.  I’ve expanded the subscription, resource groups and the ‘enewman-demo’ lab account.  Under the lab account you can see the two labs and total cost for each lab.  As you can see by the plus sign next to the lab’s names, each lab could be expanded to list the virtual machines for the lab as well as the cost for each virtual machine.


planetmaher_3-1629153655531.png


Publish the data


Last step is to publish the report!  See publish datasets and reports from Power BI Desktop for further instructions.


Happing Reporting!


The Lab Services Team

Four essentials to collaborate as one business, everywhere

Four essentials to collaborate as one business, everywhere

This article is contributed. See the original author and article here.

Across every industry, we’re all navigating the new world of hybrid work. Together, we’re building a blended model that enables more flexibility in when, where, and how people work, and that model is here to stay. But organizations can’t let flexibility turn into separate, disjointed work effortsthey must enable the entire organization to operate as one business, everywhere.

With Dynamics 365 + Microsoft Teams, we’re helping organizations achieve this goal, making it easier for people in any role or department to connect, communicate, and collaborate onbusinessfunctionsno matter when, where, or how they’re working.

The essentials for cross-organizational collaboration

As business leaders shape their hybrid workplace strategy, we believe there are four “collaboration essentials they must consider so they can work as one business, everywhere.

1. The new flow of workmust connect everyone, across every business function

In a world of hybrid work, digital collaboration should help broaden networks, not constrict them. That’s why we’re making it easier for any Dynamics 365 user to seek out diverse perspectives, learnings, and insights from anywhere within the organizationbetween sales and engineering, marketing and finance, retail frontlines, and customer service.

Dynamics 365 users will soon be able to inviteanyMicrosoft Teams user from across the organization to view and collaborate on business records right within the flow of a Teams chat or channel. Thisenables everyone in the organization to directly contribute to business activities in the moment, without needing to switch context across multiple apps and data sources.

Organizations are taking full advantage of this opportunity. Insurance brokerage and advisory company Willis Towers Watson plans to put the powerful combination of Microsoft Teams and Microsoft Dynamics 365 Sales in the hands of the whole company so that anyone from sellers to service agents can share and collaborate from within Teams or Dynamics 365 Sales without switching apps. At Rockwell Automation, a worldwide company dedicated to industrial automation and digital transformation, sellers and sales leaders have access to Dynamics 365 and Microsoft Teams so that they can collaborate with other sellers and groups across the company.

2. Teams must be able to connect everywhere, anytime, on every channel

In the pre-COVID world, collaboration was largely synchronouswith team members working on a problem at the same time, either in person or in a virtual meeting. But today, collaboration must be asynchronous as well. In addition to the ability to meet live on video, employees also need the ability to share customer records, service cases, or workflows with any expert in the organization, in the flow of their work in Dynamics 365and enable that expert to add value from anywhere, at any time.

For example, organizations can enable asynchronous collaboration by embedding chatbots in the flow of work.With new chatbot capabilities in Dynamics 365 Human Resources,employees can view time-off balances and submit leave requests from within Teams, without having to visit a separate HR portal. Employees simply type in a few keywords, and a chatbot can easily help them find out their leave balance or request time off. Managers can just as easily review and approve time-off requests with just a few clicks. With this self-service experience, employees and managers can work together on simple HR tasks from anywhere, at any timeall from within the flow of work with Teams.

Every organization, large and small, needs to bring collaboration into the flow of work. With Dynamics 365 Business Central, small and medium businesses can also connect people, processes, insights, and cross-functional team collaboration to make better decisions faster. Now in preview, Business Central users can paste a link to any Dynamics 365 record into a Microsoft Teams chat, and it will expand that into a compact card to share with coworkers. They can view card details, edit data, and take action without ever leaving Teamsin the office, at home, or on the go. In addition, users can look up business contacts, vendors, and customers that can be shared into chat, or used to bring up rich, actionable details in a window in Teams.

3. Collaboration must go beyond the office

Our research shows that remote work increased interactions with immediate teams and close networks, but dramatically diminished interactions with more distant networks. This is a worrying trend for business leaders, potentially leading to problems like groupthink or employee isolation. Dynamics 365 and Teams help organizations bring every network closer together so that those closest to the problem can access the people and information they need to spur innovation, wherever they are located.

On the retail frontlines, for example, it’s critical to have the most accurate product and inventory information on hand, as well as coordinate important tasks to keep stores running efficiently. New task management functionality now available in Dynamics 365 Commerce allows managers and workers to create task lists, manage assignment criteria, and track task statuses integrated between Dynamics 365 Commerce back office, store commerce, and Teams applications.

Mattress Firm, one of the country’s largest specialty mattress retailers,provides retail associates with Microsoft Surface Go devices that integrate Dynamics 365 Commerce and Office 365 apps. The mobile point of sale system can enable them to engage better with guests while accessing experts and sales information in Teams, all in realtime.

Collaboration happens in the moment, between anyonefrom the home office to the factory floor to oil platforms.For example, in the coming months, we’re introducing new ways for field technicians to stay connected to work orders, information, and experts in real-time, even from some of the most remote job sitesall with seamless integration between Dynamics 365 Field Service, Dynamics 365 Remote Assist, and Teams.

Saint-Gobain, a global leader in the manufacturing of sustainable, high-performance building materials, uses Microsoft Dynamics 365 Remote Assist with HoloLens and Teams to help its process experts virtually troubleshoot equipment in its factories around the world, as well as train technicians faster. And frontline workers based at offshore Chevron platforms use a HoloLens mixed reality headset equipped with Microsoft Dynamics 365 Remote Assist and Microsoft Teams to connect with colleagues onshore and perform virtual safety measures.

4. The new world of work must be personalized

In addition to improving the way people work together across the organization, collaboration should improve how individuals and departments engage with end customersenabling everyone to deliver more personalized experiences. In a world of hybrid work, it’s clear that virtual events will remain a key method for engaging with customers, and customer expectations for a personalized experience have risen.

This year, marketers will be able to set up, promote, and report on events hosted on Microsoft Teams from within Dynamics 365 Marketing. In a few simple steps, they can export attendee data and view customer segments created in Dynamics 365 Marketing based on audience attendance. Customer journeys, including starter emails, are also automatically created to nurture attendees. Users can then further customize the content and experiences for attendees based on how they engage and orchestrate personalized customer journeys.

One business, everywhere: Collaborate in the flow of work

As the definition of workplace continues to evolve, every organization needs to bring people, insights, and business processes together in collaborative spaces. These four essential capabilitiesbuilt into Dynamics 365 and Teamswill help everyone across your business work together from anywhere in a more seamless and natural way.

Learn more

The post Four essentials to collaborate as one business, everywhere appeared first on Microsoft Dynamics 365 Blog.

Brought to you by Dr. Ware, Microsoft Office 365 Silver Partner, Charleston SC.

Four essentials to collaborate as one business, everywhere

Make every interaction count with customer journey orchestration

This article is contributed. See the original author and article here.

Since the onset of the digital age, customer behaviors have radically evolved. As new technology emerges, customers’ expectations for brands continually align with digital evolution. However, the pandemic has brought along a significant, unexpected shift in both customer behavior and expectations. With lives upended and livelihoods being affected around the world, consumers have been forced to adopt completely new behaviors. This evolution was brought on through a trial by fire, throwing a decade’s worth of digital adoption in just a few months, which not only affected consumer behavior in digital spaces, but across brick-and-mortar as well.

Watch the customer journey orchestration webinar to learn more.

Emerging digital trends

So, what does this mean for brands looking to align with consumer trends? Today’s consumers perceive technology optimistically, as an intimate lifeline. They like to try new things and shop on a trial basis, while also looking for novelty. This demonstrates their desire for a sense of personal control and empowerment. While many of the former mentions aren’t surprising, one of the most interesting trends emerge from the pandemic is that consumers no longer distinguish between material life and immersive digital experiences, clearly a knock-on effect of the majority of the global population operating from home. Abandoning ingrained shopping habits, consumers are forcing businesses to innovate into the digital-first marketplace in real time.

The modern digital consumer demonstrates:

  • Willingness to experiment
  • Self-efficiency
  • Information savviness
  • Digital and physical integration
  • High device usage

The effect of the pandemic

However, the wow factor of new technology alone isn’t enough to engage consumers like it used to be. People are now more discerning and skeptical, and this has never been more pronounced than with the changes in consumer behavior brought on by the pandemic. Today’s customers expect brands to understand them and their needs, and the pandemic has caused a major shift in what those perceived needs are. A consumer’s last best experience becomes their expectation. Brands looking to stay ahead of competitors absolutely must shift their own approach to customers based on these emerging trends.

Brands need to shift and expand their tactics as they expect consumers to:

  • Worry more, spend (less) in new ways, and save more.
  • Be more ambivalent, contradictory, demanding, and mistrustful.
  • Accelerate their digital behaviors and demand more from digital interactions.

The customer-obsessed model

The confluence of the modern digital behaviors with the anxiety-led behaviors brought on by the pandemic presents a significant challenge for brands looking to continue growing and meeting customer needs. That’s why brands must first become customer-obsessed and work toward building a new operating model. A customer-obsessed enterprise operates differently, focusing its strategy, operations, and budget on the customer. It must be customer-led, insights-driven, fast, ultra-nimble, and connected to meaningful data.

The first place to start is to assemble a holistic ecosystem:

  • Recognition: Identity resolution at a personalized, individual level
  • Context: History merged with real-time contextual insight
  • Experience: Analytics to determine action, offer, content, or message
  • Orchestration: Delivery and dialog management at the appropriate touchpoint
  • Optimization: Insights for ongoing interactions and strategic planning

Looking toward the horizon

As new digital trends emerge and consumer behavior and expectations evolve, it’s critical for brands to evolve with them. For organizations to stay competitive, they must orchestrate a holistic end-to-end journey for each customer that adds value at every interaction and drives intent through seamlessly connected experiences in both the physical and digital worlds. To do so, many companies and industries are leveraging rich AI-powered segments and insights from Microsoft Dynamics 365 Customer Insights along with journey-orchestration capabilities in Microsoft Dynamics 365 Marketing.

Watch the customer journey orchestration webinar to learn more.

The post Make every interaction count with customer journey orchestration appeared first on Microsoft Dynamics 365 Blog.

Brought to you by Dr. Ware, Microsoft Office 365 Silver Partner, Charleston SC.

Experiencing Data Latency in Europe regions for platform logs – 08/17 – Investigating

This article is contributed. See the original author and article here.

Initial Update: Tuesday, 17 August 2021 17:09 UTC

Starting at 09:20 UTC on 17 Aug 2021 you have been identified as a customer using Azure Monitor who may be experiencing high latency for platform logs configured via Diagnostics settings.
  • Work Around: None
  • Next Update: Before 08/17 18:30 UTC
We are working hard to resolve this issue and apologize for any inconvenience.
-Chandar

Azure VMware Solution Releases Placement Polices in Public Preview

Azure VMware Solution Releases Placement Polices in Public Preview

This article is contributed. See the original author and article here.

Co-Authored: Ashwin Kabadi, Senior Product Manager, Azure VMware Solution, Microsoft


Placement policies enable admins to specify constraints or rules when allocating Virtual Machines within an Azure VMware Solution (AVS) private cloud. With this update the creation and assignment of vSphere Distributed Resource Scheduler (DRS) rules for running Virtual Machines (VMs) in an AVS SDDC has been simplified and is now executable directly from the Azure Portal for cloud admin roles.


Making updates to VM (Virtual Machine) groups and Host groups is a cumbersome operation, especially for hosts in a cloud environment where they can be more frequently cycled. In an on-premises environment, as hosts are replaced in the vSphere inventory, the vSphere admin must modify the host group to ensure that the desired VM-Host placement constraints continue to stay in effect. Placement policies in AVS take care of updating the Host groups when a host is rotated or changed. Similarly, if you scale-in a cluster, the Host Group is also updated automatically, as applicable. This eliminates the overhead of managing the Host Groups.


Placement policies essentially define constraints or rules that allow you to decide where and how the VMs should run within the AVS SDDC clusters. Placement polices are used to support VM performance and availability by grouping multiple VMs that communicate regularly on the same host.  policy and help mitigate the impact of maintenance operations to policies within the SDDC cluster. Placement polices in AVS also reduce the complexity and administrative burden of updating host groups via DRS rules in vSphere during SDDC maintenance operations.


Placement policies.png


When you create a placement policy, it creates a vSphere Distributed Resource Scheduler (DRS) rule in the specified vSphere cluster. It also includes additional logic for interoperability with Azure VMware Solution operations.


There are two basic placement policy types now supported:


  1. Virtual Machine to Virtual Machine: this refers to a policy that is applied to VMs with respect to each other.

    • VM-VM Affinity policies instruct DRS to try keeping the specified VMs together on the same host for performance reasons as an example.

    • VM-VM Anti-Affinity policies instruct DRS to try keeping the specified VMs apart from each other on separate hosts. It’s useful in scenarios where  you may want to spread your virtual machines across hosts to ensure availability of the applications.


  2. Virtual Machine to SDDC Host: this refers to a policy applied to selected VMs to either run on, or avoid  selected hosts  .

    • VM-Host Affinity policies instruct DRS to try running the specified VMs on the hosts defined.

    • VM-Host Anti-Affinity policies instruct DRS to try running the specified VMs on hosts other than those defined.


For more information on requirements for placement policies in Azure VMware Solution and how to create and apply them, see Microsoft Docs pages here.


Start using placement polices directly from the Azure Portal  today!