by Contributed | Aug 25, 2021 | Dynamics 365, Microsoft 365, Technology
This article is contributed. See the original author and article here.
In the media and entertainment industry, production timelines continue to accelerate, file sizes continue to grow, and remote workflows have become the norm.
Content creators must scale and accelerate their production workflows to meet ever-increasing audience demands for personalization, immediacy, and choice. At the same time, media and entertainment organizations must look for every opportunity to reduce cost, better manage and monetize assets, and enable collaboration and productivity across their production and post-production teamsall while maintaining the security of their high-value creative IP.
The Dynamics 365 media and entertainment accelerator empowers partners and developers serving the media industry to adopt cloud workflows to address these challenges. Our 2.0 release with enhanced features and expanded data model is now generally available.
First introduced in July 2020, the Dynamics 365 media and entertainment accelerator enables organizations todevelop and deploy their own business applications for quick access to data insights and new workplace automation. It builds on Common Data Model and Microsoft Power Platform, and includes sample code and various industry-specific customizations to support media and entertainment applications and business logic.
Version 1.0 of the media and entertainment accelerator included a data model with entities and attributes centered on the theme of fan and guest engagement. These are used when building new applications to drive guest experiences and sales workflows, and to support broad data collection and analysis. The accelerator allows ISV partners and developers working in Microsoft Power Platform to add media-specific data entities, sample user interface forms and canvas apps, and business flows that could be used for:
- Event and physical venue management.
- Sports management.
- Ticketing and advertising sales.
- Media sponsorships.
- Guest interactions, such as automating event registrations, creating and managing new loyalty programs, or tracking guest preferences.
Enhanced live, hybrid, and virtual events with Microsoft Power Apps portals and Microsoft Teams integrations
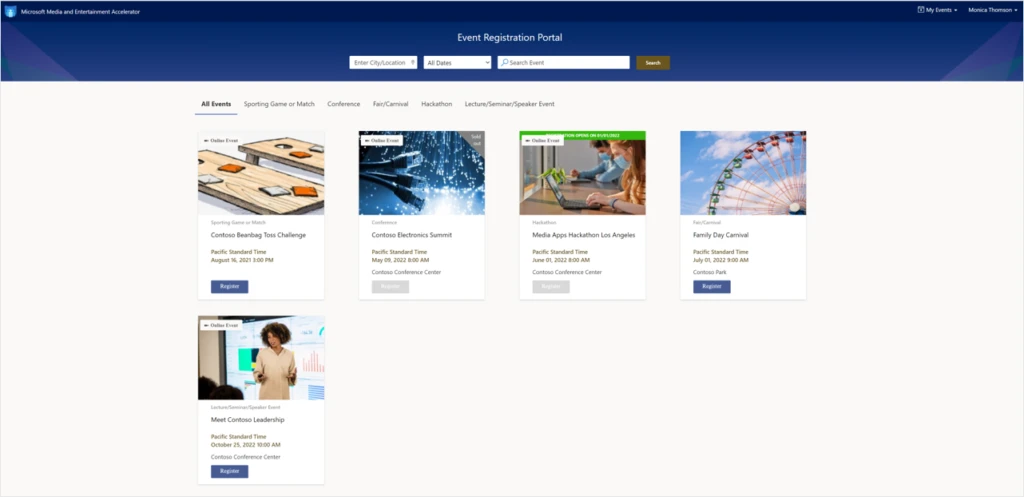
In the 2.0 release, Microsoft has expanded the media data model and code samples that ship with the accelerator to incorporate support for the industry’s recent shift to hosted online and hybrid live events. Microsoft Teams API integration has been added so event producers can easily create schedules, and support live events and broadcasts, virtual conferences and seminars, remote press conferences and briefings, or even sports matches or league activities where guest plan to participate through Microsoft Teams. A sample events and venues model-driven application has been added to enable these capabilities. Microsoft has also included a Power Apps portals template so event producers can launch their own fan-facing web sites to promote events, register guests for upcoming live events, and allow registrants to RSVP for activities. They can even join a live event in progress such as a sports game, symposium, or music concert directly and without the need for a separate Microsoft Teams client.
Accelerate the development of apps for cloud-based content production workflows
What’s more, in the 2.0 release we have added a content production management solution that addresses the needs of creative production houses, advertising agencies, special effects houses, and television and motion picture studios.
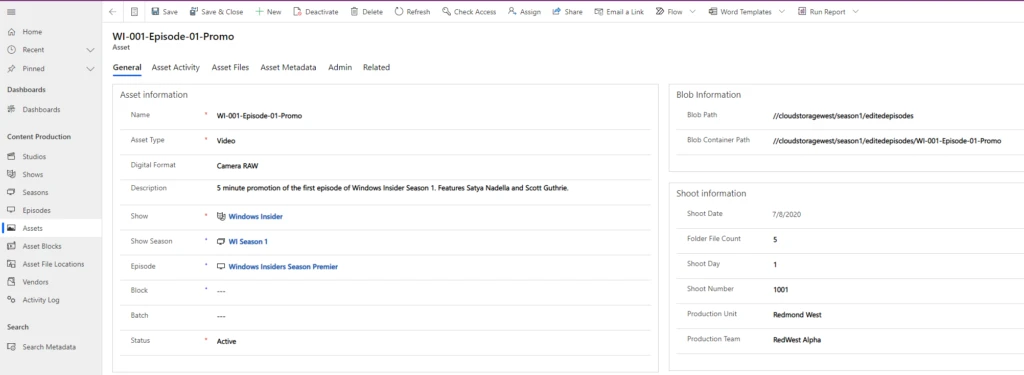
The content production management solution adds 15 data entities to the media data model from studios, shows, episodes, and seasons to production assets, video and audio tracks, and descriptive and AI-generated metadata. The accelerator includes sample user interfaces, dashboards, and automated business flows to assist with the rapid development of online applications that can be used for optimized collaboration and productivity throughout the creative process.
These elements enable the development applications that address most of today’s collaborative cloud-based production and post-production workflows by using Microsoft Power Automate for:
- Adding data and processes for managing access and asset sharing.
- Improved searching capabilities.
- Relational asset management.
- Automation of common functions, such as:
- Asset uploads
- Archiving
- Tagging and discovery
- Distribution
- Quality control
As described by Harry Grinling, founder and CEO of Support Partners, “The new capabilities of the Microsoft Dynamics 365 Media and Entertainment Accelerator will allow us to rapidly extend our solution portfolio for cloud-enabled archiving, asset management, and remote collaboration. The combination of this latest release of the accelerator and our tried-and-tested production frameworks will help make the migration of workflows to the cloud frictionless for our global roster of media and entertainment customers.” Support Partners is a Microsoft ISV partner that designs, deploys, and supports innovation in the cloud.
Mark Keller, head of strategy and innovation at WPP, added “We are really excited to collaborate with Microsoft and see huge potential and massive scalability with the Content Production features of the M&E Accelerator for building and expanding new virtual studio offerings for our clients.” WPP is one of the world’s largest advertising agencies, operating in 110 countries, and leverages Microsoft technology to build customized solutions for their brand clients.
Next steps
Get started right away with a test drive of the latest release of the Dynamics 365 media and entertainment accelerator on AppSource. You can interact with a preconfigured test drive environment that demonstrates key features and benefits without the need to set up or use your own Power Apps or Dynamics 365 subscription.
When you’re ready, the data model, solutions, application and data samples, Power BI reports, and UX controls that come with the Dynamics 365 media and entertainment accelerator are available to any Microsoft Power Platform developer from the “Get It Now” feature on AppSource, or also for download on GitHub, with additional supporting documentation and configuration information on Microsoft Docs.
Microsoft empowers media and entertainment organizations to achieve more with our powerful and flexible development platforms supported by a comprehensive partner ecosystem with industry-leading solutions for creativity, collaboration, content management, audience insights, and personalized customer experiences.
The post Virtual live events and cloud-enabled content workflows now supported in Dynamics 365 media and entertainment accelerator appeared first on Microsoft Dynamics 365 Blog.
Brought to you by Dr. Ware, Microsoft Office 365 Silver Partner, Charleston SC.
by Contributed | Aug 24, 2021 | Technology
This article is contributed. See the original author and article here.
This is the first in a series of articles which explore how to integrate Artificial Intelligence into a video processing infrastructure using off-the-market cameras and Intel OpenVino Model Server running at the edge. In the below sections we will learn some background trivia, hardware/software prerequisites for implementation, and steps to setup a production-ready AI enabled Network Video Recorder that has the best of both worlds – Microsoft and Intel.
What is a video analytics platform
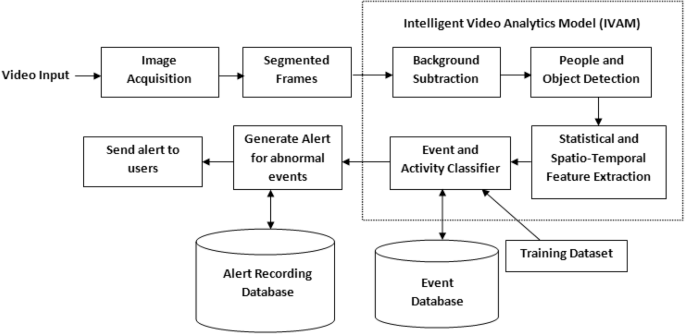
In the last few years, video analytics, also known as video content analysis or intelligent video analytics, has attracted increasing interest from both industry and the academic world. Video Analytics products add artificial intelligence to cameras by analyzing video content in real-time, extracting metadata, sending out alerts and providing actionable intelligence to security personnel or other systems. Video Analytics can be embedded at the edge (even in-camera), in servers on-premise, and/or on-cloud. They extract only temporal and spatial events in a scene, filtering out noise such as lighting changes, weather, trees and animal movements. Here is a logical flow of how it works.
Let’s face it: on-premises and legacy video surveillance infrastructure are still in the dark ages. Physical servers often have limited virtualization integration and support, as well as racks upon racks of servers that clog up performance regardless of whether the data center is using NVR, direct-attached storage, storage area network or hyper-converged infrastructure. It’s been that way for the last 10, if not 20, years. Buying and housing an NVR for five or six cameras is expensive and time-consuming from a management and maintenance point of view. With great improvements in connectivity, compression and data transfer methods, a cloud-native solution becomes an excellent option. Here are some of the popular use cases in this field and digram of a sample deployment for critical infrastructure.
- Motion Detection
- Intrusion Detection
- Line Crossing
- Object Abandoned
- License Plate Recognition
- Vehicle Detection
- Asset Management
- Face Detection
- Baby Monitoring
- Object Counting
|

|
Common approaches for proposals to clients involve either a new installation (greenfield project) or a lift and shift scenario (brownfield project). Video intelligence is one industry where it becomes important to follow a bluefield approach – meant to describe a combination of both brownfield and greenfield, where some streams of information are already in motion and some will be new instances of technology. The reason is that the existing hardware and software installations are very expensive and although they are open to new ideas, they want to keep what is already working. The current article is about setting up this new technology in a way so it accepts pipelines, for inference and event generation, on live video for the above use cases in future.
The rise of AI NVRs
Video Intelligence was invented in 1942 by German engineer, Walter Bruch, so that he and others could observe the launch of V2 rockets on a private system. While its purpose has not drastically changed in the past 75 years, the system itself has undergone radical changes. Since its development, users’ expectations have evolved exponentially, necessitating the development of faster, better, and more cost-effective technology.
Initially, they could only watch through live streams as they happened— recordings would become available much later (VCR). Until the recent past these were analog devices using analog cameras and a Digital Video Recorder (DVR). Not unlike your everyday television box which used to run off these DVRs in every home! Recently, these have started getting replaced with Power Over Ethernet (PoE) enabled counterparts, running off Network Video Recorders (NVR). Here is a quick visual showing the difference between DVR and NVR.

AI NVR Video Analytics System is a plug-and-play turnkey solution, including video search for object detection, high-accuracy intrusion detection, face search and face recognition, license plate and vehicle recognition, people/vehicle counting, and abnormal-activity detection. All functions support live stream and batch mode processing, real-time alerts and GDPR-friendly privacy protection when desired. AI NVR overcomes the challenges of many complex environments and is fully integrated with AI video analytics features for various markets, including perimeter protection of businesses, access controls for campuses and airports, traffic management by law enforcement, and business intelligence for shopping centers. Here is a logical flow of an AI NVR from video capture to data-driven applications.

In this article we are going to see how to create such an AI NVR at the edge using Azure Video Analyzer (AVA) and Intel products.
Azure Video Analyzer – a one-stop solution from Microsoft
Azure Video Analyzer (AVA) is a brand new service to build intelligent video applications that span the edge and the cloud. It offers the capability to capture, record, and analyze live video along with publishing the results – video and/or video analytics. Video can be published to the edge or the Video Analyzer cloud service, while video analytics can be published to Azure services (in the cloud and/or the edge). With Video Analyzer, you can continue to use your existing video management systems (VMS) and build video analytics apps independently. AVA can be used in conjunction with computer vision SDKs and toolkits to build cutting edge IoT solutions. The diagram below illustrates this.

This is the most essential component of creating the AI NVR. As you may have guessed, in this article we are going to deploy an AVA module on IoT edge to coordinate between the model server and the video feeds through an http extension. You can ‘bring you own model’ and call it through either http or grpc endpoint.
Intel OpenVINO toolkit
OpenVINO (Open Visual Inference and Neural network Optimization) is a toolkit provided by Intel to facilitate faster inference of deep learning models. It helps developers to create cost-effective and robust computer vision applications. It enables deep learning inference at the edge and supports heterogeneous execution across computer vision accelerators — CPU, GPU, Intel® Movidius™ Neural Compute Stick, and FPGA. It supports a large number of deep learning models out of the box.

OpenVino uses its own Intermediate Representation (IR) (link)(link) format similar to ONNX (link), and works with all your favourite deep learning tools like Tensorflow, Pytorch etc. You can either convert your resultant model to openvino or use/optimize the available pretained models in the Intel model zoo. In this article we are specifically using the OpenVino Model Server (OVMS) available through this Azure marketplace module, Out of the many models in their catalogue I am only using those that count faces, vehicles, and people. These are identified by their call signs – personDetection, faceDetection, and vehicleDetection.
Prerequisites
There are some hardware and software prerequisites for creating this platform.
- ONVIF PoE camera able to send encoded RTSP streams (link)(link)
- Intel edge device with Ubuntu 18/20 (link)
- Active Azure subscription
- Development machine with VSCode & IoT Extension
- Working knowledge of Computer Vision & Model Serving
ONVIF PoE camera
ONVIF (the Open Network Video Interface Forum) is a global and open industry forum with the goal of facilitating the development and use of a global open standard for the interface of physical IP-based security products. ONVIF creates a standard for how IP products within video surveillance and other physical security areas can communicate with each other. This is different from propreitary equipment, and you can use all open source libraries with them. A decent quality camera like Reolink 410 is enough. Technically you can use wireless camera but I would not recommend that in a professional setting.
Intel edge device with Ubuntu
This can be any device with one or more Intel cpu. Intel NUC makes great low cost IoT edge device and even the cheap ones can handle around 10 cameras running at 30 fps. I am using a base model with Celeron processor priced at around 130$. The camera(s), device, and some cables are all you need to implement this. Optionally, like me, you may need a PoE switch or network extender to get connected. Check the wattage of the PoE to be at least 5 W, and bandwidth to be at least 20 mbps per camera. You also need to install Ubuntu Linux.
Active Azure subscription
Surely, you will need this one, but as we know Azure has this immense suit of products, and while ideally we want to have everything, it may not be practically feasible. For practical purposes you might have to ask for access to particular services, meaning you have to know ahead exactly which ones you want to use. We will need the following:
- Azure IoT Hub (link)
- Azure Container Registry (link)
- Azure Media Services (link)
- Azure Video Analyzer (link)
- Azure Streaming Analytics (link)(future article)
- Power BI / React App (link)(future article)
- Azure Linux VM (link)(optional)
Computer Vision & Model Serving
Generally this prerequisite takes a lot of engineering and is expensive. Thankfully the OVMS extension from Intel is capable of serving high quality models from their zoo, because without this you would have to do the whole flask/socket server thing and it wouldn’t be half as good. Whatever models you need you can mention their call sign and it will be served instantly for you at the edge by the extension. We will see more about this in the next article once things are setup. Note: we are making the platform in such a way that you can use Azure CustomVision or Azure Machine Learning models on this same setup in future with very minimal changes.
Reference Architecture
We are definitely living in interesting times when something as complex as video analytics is almost an OOTB feature! Below is a ready-to-deploy architecture recommended and maintained by Microsoft Azure for video analytics. Technically if you know what you are doing you can deploy this entire thing with the push of a few buttons. However, I found it to have a bit too much for a Minimum Viable Product (MVP) as it is ‘viable’ but not ‘minimum’ so to say.

Here I present an alternate architecture that we followed, implemented, and got comparable results to the one above. This is a stripped down version of the official architecture, contains only the necessary components of a MVP for AI NVR, and is much easier to disect.
 Notice it looks somewhat simliar to the logical flow of an AI NVR shown in one of the prior sections.
Inbound feed to the AI NVR
Before we go into the implementation I wanted to mention some aspects about the inputs and outputs of this system.
- Earlier we said the system needs RTSP input, even though there are other forms of streaming protocols such as RTMP(link), HTTP etc. However, we choose RTSP mostly because its optimized for viewing experience and scalability.
- For development purpose it is recommended to use the excellent RTSP Simulator provided by Microsoft.
- To display the video being processed use any of the following players.
- You can technically use a usb webcam and create your own RTSP stream(link)(link), However, underneath it uses GStreamer, RTSPServer, and pipelines. From my experience you should be careful using this method, especially since you will need understanding of hardware/software media encoding (e.g. H.264) and GStreamer dockerization
 .
.
- One very interesting option that I used as a video source was the RTSP Camera Server app. This will instantly turn your smartphone camera into an RTSP feed that your AI NVR can consume
 !
!
- Last, but not the least you should make sure that your incoming feed has the required resolution that your CV algorithms need. The trick is not to use too good cameras. 4 to 5 MP is fine for maintaining pixel distribution parity with available pretrained models.
Outbound events from the AI NVR
In Azure Video Analyzer, each inference object regardless of using HTTP-based contract or gRPC based contract follows the object model described below.

The example below contains a single Inference event with vehicleDetection. We will see more of these in a future article.
{
  "timestamp": 145819820073974,
  "inferences": [
    {
      "type": "entity",
      "subtype": "vehicleDetection",
      "entity": {
        "tag": {
          "value": "vehicle",
          "confidence": 0.9147264
        },
        "box": {
          "l": 0.6853116,
          "t": 0.5035262,
          "w": 0.04322505,
          "h": 0.03426218
        }
      }
    }
Apart from the inference events there are many other type of events, such as the MediaSessionEstablished event, which happens when you are recording the media either in File Sink or Video Sink.
[IoTHubMonitor] [9:42:18 AM] Message received from [avasampleiot-edge-device/avaedge]:
{
  "body": {
    "sdp": "SDP:nv=0rno=- 1586450538111534 1 IN IP4 XXX.XX.XX.XXrns=Matroska video+audio+(optional)subtitles, streamed by the LIVE555 Media Serverrni=media/camera-300s.mkvrnt=0 0rna=tool:LIVE555 Streaming Media v2020.03.06rna=type:broadcastrna=control:*rna=range:npt=0-300.000rna=x-qt-text-nam:Matroska video+audio+(optional)subtitles, streamed by the LIVE555 Media Serverrna=x-qt-text-inf:media/camera-300s.mkvrnm=video 0 RTP/AVP 96rnc=IN IP4 0.0.0.0rnb=AS:500rna=rtpmap:96 H264/90000rna=fmtp:96 packetization-mode=1;profile-level-id=4D0029;sprop-parameter-sets=XXXXXXXXXXXXXXXXXXXXXXrna=control:track1rn"
  },
  "applicationProperties": {
    "dataVersion": "1.0",
    "topic": "/subscriptions/{subscriptionID}/resourceGroups/{name}/providers/microsoft.media/videoanalyzers/{ava-account-name}",
    "subject": "/edgeModules/avaedge/livePipelines/Sample-Pipeline-1/sources/rtspSource",
    "eventType": "Microsoft.VideoAnalyzers.Diagnostics.MediaSessionEstablished",
    "eventTime": "2021-04-09T09:42:18.1280000Z"
  }
}
The above points are mentioned so as to show how some of the expected outputs look like. After all that, lets see how exactly you can create a foundation for your AI NVR.
Implementation
In this section we will see how we can use these tools to our benefit. For the Azure resources I may not go through the entire creation or installation process as there are quite a few articles on the internet for doing those. I shall only mention the main things to look out for. Here is an outline of the steps involved in the implementation.
- Create a resource group in Azure (link)
- Create a IoT hub in Azure (link)
- Create a IoT Edge device in Azure (link)
- Create and name a new user-assigned managed identity (link)
- Create Azure Video Analyzer Account (link)
- Create AVA Edge provisioning token
- Install Ubuntu 18/20 on the edge device
- Prepare the device for AVA module (link)
- Use Dev machine to turn on ONVIF camera(s) RTSP (link)
- Set a local static IP for the camera(s) (link)
- Use any of the players to confirm input streaming video (link)
- Note down RTSP url(s), username(s), and password(s)
- Install docker on the edge device
- Install VSCode on development machine
- Install IoT Edge runtime on the edge device (link)
- Provision the device to Azure IoT using connection string (link)
- Check IoT edge Runtime is running good on the edge device and portal
- Create an IoT Edge solution in VSCode (link)
- Add env file to solution with AVA/ACR/Azure details
- Add Intel OVMS, AVA Edge, and RTSP Simulator modules to manifest
- Create deployment from template (link)
- Deploy the solution to the device
- Check Azure portal for deployed modules running
Lets go some of the items in the list in details.
Steps 1 and 2 are common steps in many use cases and can be done by following this. For 3 you need to make sure you are creating an ‘IoT Edge‘ device and not a simple IoT device. Follow the link for 4 to create a managed identity. For 5 use the interface to create an AVA account. Enter a name for your Video Analyzer account. The name must be all lowercase letters or numbers with no spaces, and 3 to 24 characters in length. Fill in the proper subscription, resource group, storage account, and identity from previous steps. You should now be having a running AVA account. Use these steps to create ‘Edge Provisioninig Token‘ for step 6. Remember, this is just for AVA Edge, not to be confused with provisioning through DPS. For 7, ubuntu linux is good, the support for this in windows is a work in progress. After you create the account keep the following information on standby.
AVA_PROVISIONING_TOKEN="<Provisioning token>"
Step 8, although simple, is an important step in the process. All you actually need to do is to run the below command.
bash -c "$(curl -sL https://aka.ms/ava-edge/prep_device)"
However, underneath this there is a lot going on in preparation for the NVR. The Azure Video Analyzer module should be configured to run on the IoT Edge device with a non-privileged local user account. The module needs certain local folders for storing application configuration data. The RTSP camera simulator module needs video files with which it can synthesize a live video feed. The prep-device script in the above command automates the tasks of creating input and configuration folders, downloading video input files, and creating user accounts with correct privileges.
Steps 9,10, and 11 are for setting up your ONVIF camera(s). Things to note here are that you need to set static class C IP addresses for each camera, and set https protocol along with difficult-to-guess passwords. Again, take extra caution if you are doing this with wireless camera. I use VLC to confirm the live camera feed from each camera. You may think this is obvious or choose to automate this, but I have seen a lot of issues in either. I personally recommend clients to confirm feed/frame-rate from every camera manually using urls. VLC is my player of choice but you have many more choices.
Before you bring Azure into the picture, you must have all your RTSP urls ready and tested in setp 12. Here is an example rtsp url of the main feed. Notice the port number ‘554‘ and encoding ‘h264‘.
rtsp://username:difficultpassword@192.168.0.35:554//h264Preview_01_main
For 13 to 18 keep going by the book(links). For step 19, fill in your details in the following block and create the ‘env‘ file.
SUBSCRIPTION_ID="<Subscription ID>"
RESOURCE_GROUP="<Resource Group>"
AVA_PROVISIONING_TOKEN="<Provisioning token>"
VIDEO_INPUT_FOLDER_ON_DEVICE="/home/localedgeuser/samples/input"
VIDEO_OUTPUT_FOLDER_ON_DEVICE="/var/media"
APPDATA_FOLDER_ON_DEVICE="/var/lib/videoAnalyzer"
CONTAINER_REGISTRY_USERNAME_myacr="<your container registry username>"
CONTAINER_REGISTRY_PASSWORD_myacr="<your container registry password>"
For 20 add the following module definitions in your deployment json. This will cover Azure AVA, Intel OVMS, and RTSP Simulator. Also follow this for more details.
"modules": {
          "avaedge": {
            "version": "1.1",
            "type": "docker",
            "status": "running",
            "restartPolicy": "always",
            "settings": {
              "image": "mcr.microsoft.com/media/video-analyzer:1",
              "createOptions": {
                "Env": [
                  "LOCAL_USER_ID=1010",
                  "LOCAL_GROUP_ID=1010"
                ],
                "HostConfig": {
                  "Dns": [
                    "1.1.1.1"
                  ],
                  "LogConfig": {
                    "Type": "",
                    "Config": {
                      "max-size": "10m",
                      "max-file": "10"
                    }
                  },
                  "Binds": [
                    "$VIDEO_OUTPUT_FOLDER_ON_DEVICE:/var/media/",
                    "$APPDATA_FOLDER_ON_DEVICE:/var/lib/videoanalyzer"
                  ]
                }
              }
            }
          },
"openvino": {
            "version": "1.0",
            "type": "docker",
            "status": "running",
            "restartPolicy": "always",
            "settings": {
              "image": "marketplace.azurecr.io/intel_corporation/open_vino:latest",
              "createOptions": {
                "HostConfig": {
                  "Dns": [
                    "1.1.1.1"
                  ]
                },
                "ExposedPorts": {
                  "4000/tcp": {}
                },
                "Cmd": [
                  "/ams_wrapper/start_ams.py",
                  "--ams_port=4000",
                  "--ovms_port=9000"
                ]
              }
            }
          },
"rtspsim": {
            "version": "1.0",
            "type": "docker",
            "status": "running",
            "restartPolicy": "always",
            "settings": {
              "image": "mcr.microsoft.com/lva-utilities/rtspsim-live555:1.2",
              "createOptions": {
                "HostConfig": {
                  "Dns": [
                    "1.1.1.1"
                  ],
                  "LogConfig": {
                    "Type": "",
                    "Config": {
                      "max-size": "10m",
                      "max-file": "10"
                    }
                  },
                  "Binds": [
                    "$VIDEO_INPUT_FOLDER_ON_DEVICE:/live/mediaServer/media"
                  ]
                }
              }
            }
          }
}
21 to 23 are again the usual steps for all IoT solutions and once you deploy the template, you should have the following modules running as below.

There, we have created the foundation for our Azure IoT Edge device to perform as a powerful AI NVR. Here ‘avaedge‘ is the Azure Video Analyzer service, ‘openvino‘ provides the model server extension, and ‘rtspsim‘ creates the simulated ‘live’ input video feed. In the next article we will see how we can use this setup to detect faces or maybe cars and stuff.
Future Work
I hope you enjoyed this article on setting up an AI enabled NVR for video analytics application. We love to share our experiences and get feedback from the community as to how we are doing. Look out for upcoming articles and have a great time with Microsoft Azure.
To learn more about Microsoft apps and services, contact us at contact@abersoft.ca or 1-833-455-1850!
Please follow us here for regular updates: https://lnkd.in/gG9e4GD and check out our website https://abersoft.ca/ for more information!
by Contributed | Aug 22, 2021 | Technology
This article is contributed. See the original author and article here.
On SQL Server, there is a database setting called parameterization.
parameterization has two values, Simple (the default) or Forced.
I will share here some details and examples to simplify the concept of parameterization, and try to describe how it impacts Database performance:
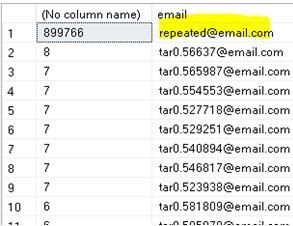
In my scenario, the distribution of the data is not even on column email of my example table infotbl, when I execute the Query below it shows that the value repeated@email.com is repeated in 899766 rows (of 1 million rows table), while the other values are repeated maximum 8 times only:
select email , count(*) from infotbl group by email order by count(*) desc
First, I created an index on the email column using below statement:
create index ix_emailsender on infotbl (email)
Logically, the Query Optimizer will choose index seek for all values except for repeated@email.com, it will choose a Clustered Index scan instead.
For example, if I execute the following two queries, both will have a different execution plan:
select * from infotbl where email = 'tar0.554553@email.com'

select * from infotbl where email = 'repeated@email.com'

How to check the density of an index ?
By running show_statistics console command as the following:
dbcc show_statistics (infotbl, ix_emailsender)

All density in the result above is 1 / distinct values , it is same as the result of the query:
select 1/convert(decimal(30,20),count(distinct email)) from infotbl;
Parameterization Forced:
If I repeat the same queries but after changing the parameterization to Forced, first by running the Alter database:
ALTER DATABASE [mydatabase] SET PARAMETERIZATION FORCED WITH NO_WAIT
--I may need to free the procedure cache by running :
dbcc freeproccache()
Now, I executed the Queries again, first:
select * from infotbl where email = 'repeated@email.com'

Then if I run the second Query, the Query optimizer will use the reserved execution plan “that has been created by Query 1”:
select * from infotbl where email = 'tar0.554553@email.com'

Then all other executions will be slower than expected, because there will be always an Index Scan every time whatever the size of result is and the selectivity of the search value.
Other Disadvantage of Forced parameterization, the Filtered Index:
If I create a filtered index on the ModifiedOn column, as an example when all Application’s important queries and Reports are accessing only data of 2021.
Filtered Index script:
create index IX_createdon on infotbl (createdon) include (email) where createdon => '1-1-2021'
With Simple parametrization, all Queries that search for values in 2021 range, will use index Seek:
select email from infotbl where createdon = '2021-06-08 11:00:22.513'

And others are as below example, will use Clustered index scan instead:
select email from infotbl where createdon = '2020-06-09 15:02:02.280'

Now if I set Parametrization Forced again and execute the same two Queries, I will have the same execution plan, as below:
select email from infotbl where createdon = '2021-06-08 11:00:22.513'

If you view the Execution Plan’s XML, you will find the Waring UnmatchedIndexes=”true” as the following :
          <QueryPlan DegreeOfParallelism="1" CachedPlanSize="24" CompileTime="1" CompileCPU="1" CompileMemory="200">
            <UnmatchedIndexes>
              <Parameterization>
                <Object Database="[tarasheedb]" Schema="[dbo]" Table="[infotbl]" Index="[IX_createdon]" />
              </Parameterization>
            </UnmatchedIndexes>
            <Warnings UnmatchedIndexes="true" />
This is because the Query Optimizer cannot use the Filtered index when the parametrization is Forced.
What is the good thing in Parameterization forced option?
The following script will show the execution plans of my Select Queries:
SELECT objtype, text
FROM sys.dm_exec_cached_plans
CROSS APPLY sys.dm_exec_sql_text(plan_handle)
WHERE   text like '%select *  from infotbl where email%' and not (text like '%SELECT objtype, text %')
With parameterization Forced, Only one Adhoc Execution plan exists in the plan cache, and the prepared execution plan that will be reused every time the query executed “again”, this will save the time of recompiling overhead every time, and decreases the size of the Procedure cache.

by Contributed | Aug 20, 2021 | Technology
This article is contributed. See the original author and article here.
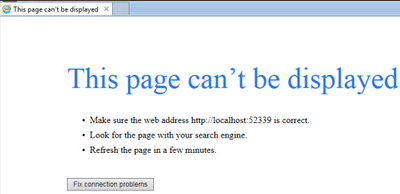
What is Page cannot be displayed?
There are certain scenarios in which when we try to browse a site hosted on IIS server, we end up getting Page cannot be displayed (PCBD) . There are several reasons for which we will eventually get PCBD , some of the reasons are :
- Network related problems
- Improper bindings on IIS
- Improper certificates on IIS
- Incorrect settings on Http.Sys
In most of the scenarios the request doesn’t even reach to the IIS layer and fails before that . Here is a nice article explaining about layers of service that a request has to travel: https://techcommunity.microsoft.com/t5/iis-support-blog/iis-services-http-sys-w3svc-was-w3wp-oh-my/ba-p/287856
Generally, a PCBD error looks like below:
This blog will focus on list of steps which are going to be useful for troubleshooting these kinds of scenarios .Here, I have created a Flow chart:

There are several steps in the flow chart which require data collection , just listing a few of them here:
Steps for capturing Schnannel logs and Capi2 logs :
Schannel Logs:
- Start Registry Editor. To do this, click Start, click Run, type regedt32, and then click OK.
- Locate the following key in the registry:
- HKEY_LOCAL_MACHINESystemCurrentControlSetControlSecurityProvidersSCHANNEL
- On the Edit menu, click Add Value, and then add the following registry value:
- Value Name: EventLogging
- Data Type: REG_DWORD
- Note After you add this property, you must give it a value. See the table in the “Logging options” section to obtain the appropriate value for the kind of events that you want to log.
- Exit Registry Editor.
- Click Start, click Shut Down, click to select Restart, and then click OK to restart the computer. (Logging does not take effect until after you restart the computer).
Logging options:
The default value for Schannel event logging is 0x0000 in Windows NT Server 4.0, which means that no Schannel events are logged. In Windows 2000 Server and Windows XP Professional, this value is set to 0x0001, which means that error messages are logged. Additionally, you can log multiple events by specifying the hexadecimal value that equates to the logging options that you want. For example, to log error messages (0x0001) and warnings (0x0002), set the value to 0x0003.
Value Description
0x0000 Do not log
0x0001 Log error messages
0x0002 Log warnings
0x0004 Log informational and success events
From https://support.microsoft.com/en-in/help/260729/how-to-enable-schannel-event-logging-in-iis
Capi2 Logs :
The CryptoAPI 2.0 Diagnostics is a feature available on Windows Server 2008+ that supports the trouble shooting of issues concerned with, for example: Certificate Chain Validation Certificate Store Operations Signature Verification
This article describes how to enable the CAPI2 Diagnostic, but for an in depth review of the capability, check here.
Enable CAPI2 logging by opening the Event Viewer and navigating to the Event Viewer (Local)Applications and Services LogsMicrosoftWindowsCAPI2 directory and expand it. You should see a view named Operational as illustrated in Figure 1.

Figure 1, CAPI2 Diagnostics in Event Viewer
Next, right-click on the Operational view and click the Enable Log menu item as shown in Figure 2.

Figure 2, Enable CAPI2 Event Logging
Once enabled, any warnings or errors are logged into the viewer. Reproduce the problem you are experiencing and check if the issue is logged.
Command for checking Reserved URLs:
netsh http show urlacl
The above command lists DACLs (discretionary access control list ) for the specified reserved URL or all reserved URLs.
Command for checking Http.sys Service State:
netsh http show ServiceState
The above command shows snapshot of Http service .
Command for checking the IP Listen:
netsh http show iplisten
The above command lists all IP addresses in the IP listen list. The IP listen list is used to scope the list of addresses to which the HTTP service binds. “0.0.0.0” means any IPv4 address and “::” means any IPv6 address
Capturing Network trace –
To capture Network trace using Netmon tool…please check out this link : https://docs.microsoft.com/en-us/windows/client-management/troubleshoot-tcpip-netmon
Steps for capturing Http.sys ETW trace:
Capture a Perfview trace with IIS ETW providers. You can download Perfview from : https://github.com/microsoft/perfview/releases/tag/P2.0.71
Before starting the Pervfiew trace just run this command in admin command prompt (this captures http.sys traces), also start the other traces:
netsh trace start capture=yes overwrite=yes maxsize=2048 tracefile=c:minio_http.etl provider={DD5EF90A-6398-47A4-AD34-4DCECDEF795F} keywords=0xffffffffffffffff level=0xff provider={20F61733-57F1-4127-9F48-4AB7A9308AE2} keywords=0xffffffffffffffff level=0xff provider="Microsoft-Windows-HttpLog" keywords=0xffffffffffffffff level=0xff provider="Microsoft-Windows-HttpService" keywords=0xffffffffffffffff level=0xff provider="Microsoft-Windows-HttpEvent" keywords=0xffffffffffffffff level=0xff provider="Microsoft-Windows-Http-SQM-Provider" keywords=0xffffffffffffffff level=0xff
Make some 5-6 requests from client (http requests not https).. Once they fail, stop all of them, then run the below command to stop the command
netsh trace stop
This netsh trace will be saved on C drive with the name “minio_http.etl”..
Hope this one helps you.
Happy troubleshooting !!! :smiling_face_with_smiling_eyes:


Recent Comments