
by Contributed | Dec 14, 2021 | Dynamics 365, Microsoft 365, Technology
This article is contributed. See the original author and article here.
Today, nothing is certain for brands. Standing still means falling behind. Heritage brands are no different. Now more than ever, brands need to find authentic ways to engage with digitally-savvy consumers no matter where they are. How do brands steeped in tradition create modern experiences that resonate with today’s digital-native consumers?
Heritage brands like Campari and Leatherman are at a pivotal moment in their rich history, as consumer behavior shifts seemingly overnight. To adapt, these established brands turned to Microsoft Customer Experience Platform to forge direct relationships with consumers. Hyper-personalizing experiences while retaining their unique brand personality is made possible by combining digital technology with their brand and marketing strengths to attract and retain customers. Individualized journeys require real-time insights gleaned from customer data and infused into line-of-business applications, and seamless activation across a growing number of customer touchpoints. Privacy-aware, consent-enabled personalization powered by AI enables the brands to engage each customer at precisely the right moment with the right touch, at scale.
Unify and predict to personalize experiences
Campari Group, the 160-year-old alcohol spirits manufacturer, found it challenging to collect and analyze data to accurately predict customer needs. To derive value from the vast amount of customer data, Campari turned to Microsoft Dynamics 365 Customer Insights, a customer data platform (CDP) that’s part of Microsoft Customer Experience Platform to unify fragmented customer data and generate AI-powered insights that reveal the next best action.
Because of the sensitive nature of customer data, security and compliance were very important considerations. With the most advanced data governance and consent management capabilities, Dynamics 365 Customer Insights was the obvious choice.
Moving forward, Campari is taking experiences to the next level with real-time, customer-led journey orchestration in order to hyper-personalize experiences across different touchpointslike email, mobile, social, and in-personaccording to marketing segments and consumer types.
“Customer journey orchestration in Dynamics 365 Marketing promotes contextually relevant and consistent real-time conversations with every customer across all interaction points. We can more precisely align marketing messages for each communication channel to gain the greatest impact. We see the effects in in-store sales and also in e-commerce, which is particularly important during COVID-19We want to use this data in an end-to-end way, from marketing to sales to customer service, capturing and optimizing the entire customer journey.”Chad Niemuth, Vice President, Global IT Marketing and Sales, Campari Group.
By unifying data and deriving insights, Campari is now better prepared for new opportunities, whether it’s launching a new product, entering a new market, or building customer loyalty.
Engage in new ways
Whether customers are engaging with your brand virtually, in-person, or both, Microsoft can help create a seamless customer journey across channels. Leatherman, a leader in high-quality multi-tools, pocket tools, and knives for 37 years, needed a solution to meet their growing direct-to-consumer business. They wanted to curate a more personalized customer journey and to create user experience continuity with their online store. They leveraged customer journey orchestration to deliver an end-to-end welcome journey for their new customers.
Leatherman was able to create multi-touchpoints that allowed them to engage their customers across commerce and marketing using real-time custom events. This journey was executed every time a customer signed up or started to check out on their website. It allowed Leatherman to seamlessly activate new customers and to create opportunities for continued engagement along the way.
“We have the flexibility to trigger our journeys in multiple ways from our website and our other Dynamics products, and products from other vendors. The journey can also react to customer activities in real-time.”Liz Lee, IT Director, Leatherman Tool Group.
Leatherman gained a 360-degree view of their customer, was able to break down silos between existing systems, use the data to drive insights, and better tailor the customer experience.
When you have true multi-channel personalization that keeps your customer top of mind, you not only create a better experience for them, but also build brand loyalty. These individualized customer journeys keep them coming back for more and can turn customers into ambassadors for your brand.
Learn more
Take your brand into the future by creating tailored, delightful customer journeys with Microsoft Customer Experience Platform, an end-to-end solution that safely unifies and protects your customer data while inspiring trust and loyalty.
The post Shaping the future of retail with Microsoft Customer Experience Platform appeared first on Microsoft Dynamics 365 Blog.
Brought to you by Dr. Ware, Microsoft Office 365 Silver Partner, Charleston SC.
by Contributed | Dec 14, 2021 | Dynamics 365, Microsoft 365, Technology
This article is contributed. See the original author and article here.
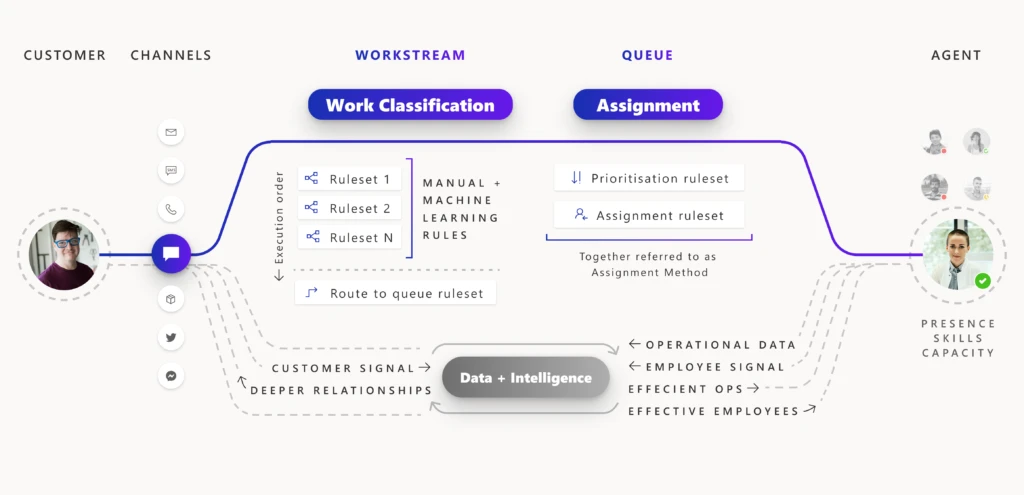
When unified routing is running smoothly for your customer service organization, incoming work items are routed to the best agent and the service workload is optimized and efficient. Depending on the needs of your business, the underlying routing infrastructure can get complex over time. When something goes wrong, it can take some effort to troubleshoot the issue. Recent updates to the unified routing capability in Dynamics 365 Customer Service help you streamline the problem-solving process.
Unified routing stages for classification and assignment
The architecture of unified routing lets you divide your routing setup into stages, and then optimize each stage individually. The classification stage lets you create rules that use customer datawhether direct or subtleto add insights to the incoming work item. You can also use machine-learning models like intelligent skill finder, sentiment prediction, and effort estimation in this stage. The insights added are then used in the assignment stage to prioritize and assign the work item to the best suited agent or queue for resolution.
For every incoming work item, rules within each applicable stage are processed so that the work item is assigned to the best agent. Diagnostics are generated from this processing, and you can view those diagnostics on each stage. You can look at how a work item was classified, how it was routed to a certain queue, and how it was prioritized and assigned.
Problem solving with unified routing diagnostics
When there is a problem with this routing setup, you use diagnostics to get insights into what might be wrong. You can see why certain work items are taking longer to assign, and you can also see why an item could be incorrectly assigned. More information: Diagnostics for unified routing
Historically, only administrators had access to diagnostics from Customer Service Hub or the Omnichannel admin center app. So, only the administrator had the ability and responsibility to create rules, view diagnostics, search for misroutes, edit rules to fix issues, and optimize the routing setup.
But during day-to-day operations, it is the supervisors and customer service managers who are responsible for the performance of the queues and the agents they manage. Issues usually surface here first, before they come to the attention of the administrator. Therefore, supervisors and managers now have access to historical analysis for unified routing. These reports surface KPIs for measuring the efficiency of all resources. While analytics tell your staff that something is not right, they need more tools to dig deep and pinpoint the core issue.
To help with this, we have extended the access to diagnostics to supervisors. Now supervisors can look at individual work items in queues that they manage and diagnose why each work item was routed in a certain way. If the routing is not as expected, they can inform the administrator and even make suggestions to improve the current setup.
Unified routing diagnostics scenario
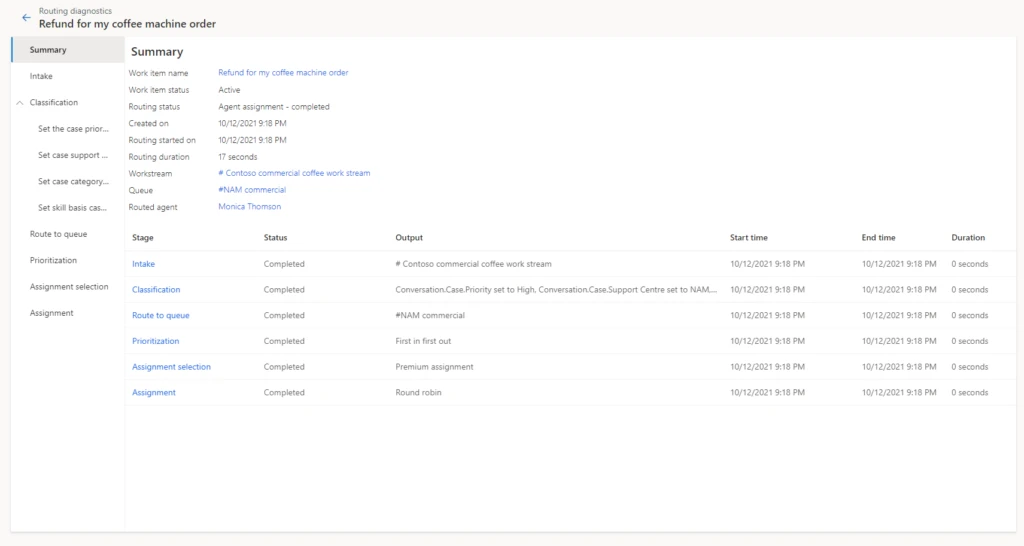
Let’s consider an example. Imagine a scenario where a supervisor is managing queues for coffee machine refund requests. Previously, there were only two queues, one for customers at the Bronze level and one for those at Gold or Silver service levels. Now, the organization has added a third queue exclusively for Gold-level service customers. The supervisor wants to ensure that the new queue for refunds to Gold status customers is working properly.
Reviewing analytics, the supervisor can see that work items in the Silver queue have a higher session transfer rate. With access to diagnostics, the supervisor can investigate further by opening Routing diagnostics, selecting the Silver queue, and reviewing the diagnostics records for some of the recent work items.
In our scenario, the supervisor looks at the rules that are applied to the work items, as seen in the image below, and quickly notices that the route to queue rule has incorrect logic that sends work items to the Silver refunds queue instead of Gold. Note that the finalidentified queue is displayed at the top of the page in the route to queue stage, which makes it even easier for the supervisor to check the queue identified.
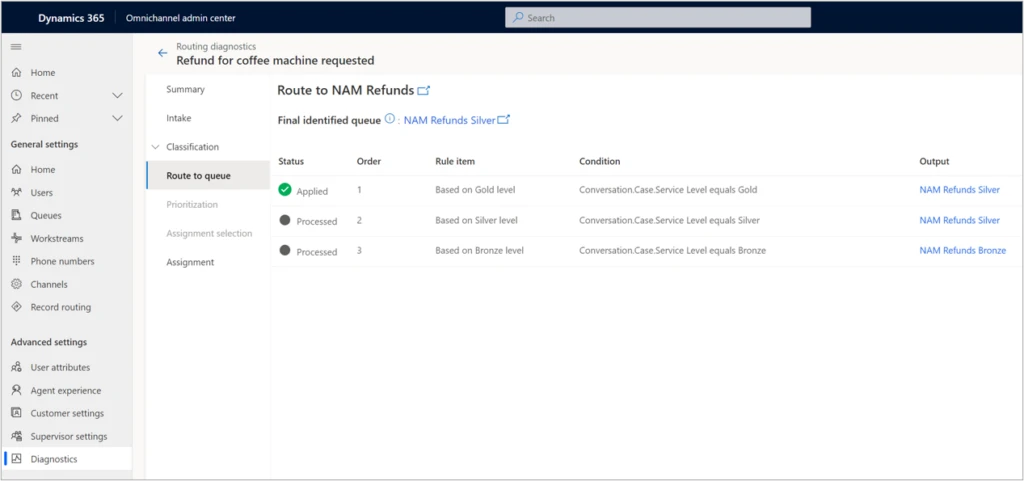
To quickly mitigate this issue, the supervisor can manually assign the appropriate work items to the correct queue, where they will then be assigned to the right agents. Now that the supervisor was able to unravel the mystery behind the increase in session transfer rate, they can bring up the issue to the administrator, who can make the required rule change and fix the problem.
Analytics and diagnostics are powerful tools. With broader access to these tools, your organization can gain better efficiency as you more quickly evolve your routing setup.
Next steps
With 2021 release wave 1, take advantage of the benefits of unified routing in Dynamics 365 Customer Service. Check out the system requirements and availability in your region. Also, read more in the documentation:
This blog post is part of a series of deep dives that will help you deploy and use unified routing at your organization. See other posts in the series to learn more.
The post Use diagnostics to optimize unified routing for your call center appeared first on Microsoft Dynamics 365 Blog.
Brought to you by Dr. Ware, Microsoft Office 365 Silver Partner, Charleston SC.
by Contributed | Dec 13, 2021 | Technology
This article is contributed. See the original author and article here.
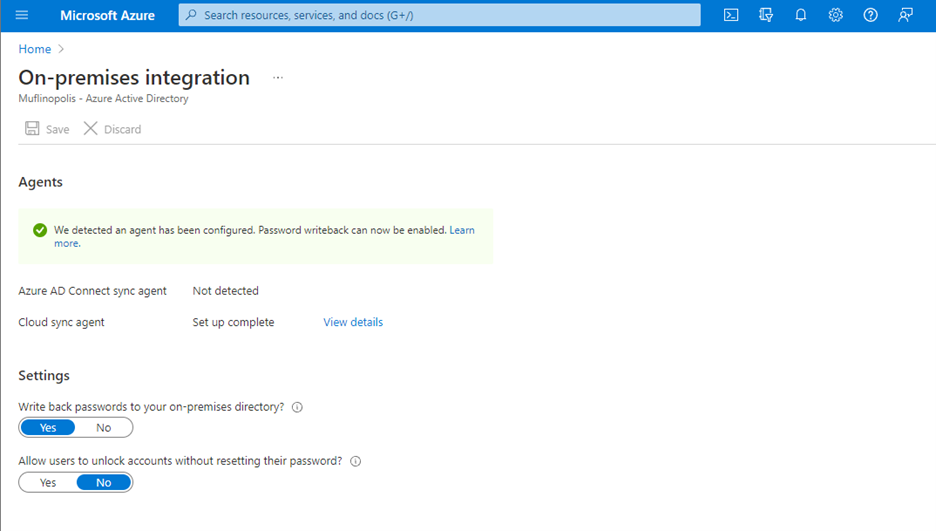
With the continued evolution and adoption of hybrid work, we know how critical a strong identity and governance control plane is for IT scalability and a seamless user experience. Today, we are excited to share new Azure Active Directory (Azure AD) capabilities and best practices that can help organizations with these needs. With these updates, organizations will now be able to allow password writeback from the cloud when using Azure AD Connect cloud sync, provision to on-premises applications, verify their SCIM provisioning endpoints, and more.
Allow users to reset their password regardless if they are on-premises or in the cloud
Password writeback allows an on-premises synched user to initiate password changes in the cloud and have the password written back to the user’s on-premises Active Directory Domain Services (AD DS) environment in real time. This enables users to seamlessly transition between cloud and on-premises applications without worrying about managing multiple passwords. No matter where the password is updated, it remains in sync across the cloud and on-premises.
Now in public preview, Azure AD Connect cloud sync password writeback includes support for users synced from disconnected environments. Organizations can sync users from multiple disconnected domains into a central Azure AD tenant and reset passwords for these users from Azure AD.
Simplify provisioning to cloud and on-premises applications
At Microsoft Ignite, we announced that an open public preview is available for Azure AD to provisioning to on-premises applications that support SCIM, SQL, and LDAP. Organizations can manage provisioning to their on-premises applications the same way they’re used to with popular SaaS applications such as monday.com, Miro, and Asana. Building on this momentum, we’ve now added the ability to provision users into third-party LDAP directories such as OpenLDAP.

Simplify building and testing your provisioning end point in compliance with the SCIM standard
A limited preview is now available of a SCIM validation tool. This enables partners and customers to validate that their end point is compatible with the Azure AD SCIM client, reducing onboarding time to the Azure AD app gallery. Once you have built your new application as per the guidelines, you can request an invite to the preview here.

Upgrade to the latest version of Azure AD Connect sync to future-proof your environment
Legacy versions of Azure AD Connect sync rely on components such as SQL2012 and ADAL that are being retired in the coming year. As such, all customers must upgrade to Azure AD Connect sync v2.0 or evaluate switching to Azure AD Connect cloud sync to ensure uninterrupted provisioning support. Azure AD Connect sync v1.x versions will be retired effective August 30, 2022.
To provide better predictability for IT planning cycles, we have also established a consistent retirement cadence for Azure AD Connect sync versions. Moving forward, we will retire each version 18 months after a new version is released.
Use date comparisons to drive provisioning logic
Attribute expression mapping enables you to control and transform data before writing to target systems. Based on your feedback, we have added new built-in date functions Now(), DateAdd() and DateDiff() to help you compare dates and define granular attribute provisioning based on date time values. You can nest and combine them with other functions in your user provisioning flow to implement scenarios such as:
- Based on user type, set user account expiry date in a SaaS application or on-premises application to “X” number of days after current provisioning time.
- Find the interval difference between current date and HR hire date and use it to determine account activation / data flow logic.
As always, we’d love to hear from you! Feel free to leave comments down below or reach out to us on aka.ms/AzureADFeedback.
Learn more about Microsoft identity:
by Contributed | Dec 11, 2021 | Technology
This article is contributed. See the original author and article here.
Before implementing data extraction from SAP systems please always verify your licensing agreement. |
Over the last five episodes, we’ve built quite a complex Synapse Pipeline that allows extracting SAP data using OData protocol. Starting from a single activity in the pipeline, the solution grew, and it now allows to process multiple services on a single execution. We’ve implemented client-side caching to optimize the extraction runtime and eliminate short dumps at SAP. But that’s definitely not the end of the journey!
Today we will continue to optimize the performance of the data extraction. Just because the Sales Order OData service exposes 40 or 50 properties, it doesn’t mean you need all of them. One of the first things I always mention to customers, with who I have a pleasure working, is to carefully analyze the use case and identify the data they actually need. The less you copy from the SAP system, the process is faster, cheaper and causes fewer troubles for SAP application servers. If you require data only for a single company code, or just a few customers – do not extract everything just because you can. Focus on what you need and filter out any unnecessary information.
Fortunately, OData services provide capabilities to limit the amount of extracted data. You can filter out unnecessary data based on the property value, and you can only extract data from selected columns containing meaningful data.
Today I’ll show you how to implement two query parameters: $filter and $select to reduce the amount of data to extract. Knowing how to use them in the pipeline is essential for the next episode when I explain how to process only new and changed data from the OData service.
ODATA FILTERING AND SELECTION
To filter extracted data based on the field content, you can use the $filter query parameter. Using logical operators, you can build selection rules, for example, to extract only data for a single company code or a sold-to party. Such a query could look like this:
/API_SALES_ORDER_SRV/A_SalesOrder?$filter=SoldToParty eq 'AZ001'
The above query will only return records where the field SoldToParty equals AZ001. You can expand it with logical operators ‘and’ and ‘or’ to build complex selection rules. Below I’m using the ‘or’ operator to display data for two Sold-To Parties:
/API_SALES_ORDER_SRV/A_SalesOrder/?$filter=SoldToParty eq 'AZ001' or SoldToParty eq 'AZ002'
You can mix and match fields we’re interested in. Let’s say we would like to see orders for customers AZ001 and AZ002 but only where the total net amount of the order is lower than 10000. Again, it’s quite simple to write a query to filter out data we’re not interested in:
/API_SALES_ORDER_SRV/A_SalesOrder?$filter=(SoldToParty eq 'AZ001' or SoldToParty eq 'AZ002') and TotalNetAmount le 10000.00
Let’s be honest, filtering data out is simple. Now, using the same logic, you can select only specific fields. This time, instead of the $filter query parameter, we will use the $select one. To get data only from SalesOrder, SoldToParty and TotalNetAmount fields, you can use the following query:
/API_SALES_ORDER_SRV/A_SalesOrder?$select=SalesOrder,SoldToParty,TotalNetAmount
There is nothing stopping you from mixing $select and $filter parameters in a single query. Let’s combine both above examples:
/API_SALES_ORDER_SRV/A_SalesOrder?$select=SalesOrder,SoldToParty,TotalNetAmount&$filter=(SoldToParty eq 'AZ001' or SoldToParty eq 'AZ002') and TotalNetAmount le 10000.00
By applying the above logic, the OData response time reduced from 105 seconds to only 15 seconds, and its size decreased by 97 per cent. That, of course, has a direct impact on the overall performance of the extraction process.
FILTERING AND SELECTION IN THE PIPELINE
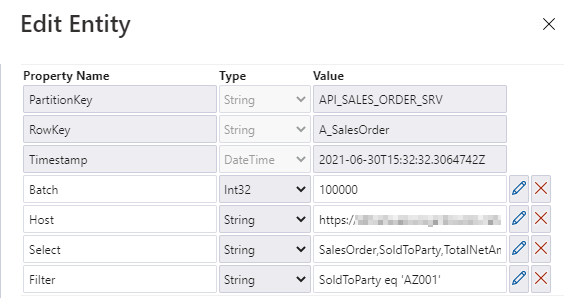
The filtering and selection options should be based on the entity level of the OData service. Each entity has a unique set of fields, and we may want to provide different filtering and selection rules. We will store the values for query parameters in the metadata store. Open it in the Storage Explorer and add two properties: filter and select.
I’m pretty sure that based on the previous episodes of the blog series, you could already implement the logic in the pipeline without my help. But there are two challenges we should be mindful of. Firstly, we should not assume that $filter and $select parameters will always contain a value. If you want to extract the whole entity, you can leave those fields empty, and we should not pass them to the SAP system. In addition, as we are using the client-side caching to chunk the requests into smaller pieces, we need to ensure that we pass the same filtering rules in the Lookup activity where we check the number of records in the OData service.
Let’s start by defining parameters in the child pipeline to pass filter and select values from the metadata table. We’ve done that already in the third episode, so you know all steps.

To correctly read the number of records, we have to consider how to combine these additional parameters with the OData URL in the Lookup activity. So far, the dataset accepts two dynamic fields: ODataURL and Entity. To pass the newly defined parameters, you have to add the Query one.

You can go back to the Lookup activity to define the expression to pass the $filter and $query values. It is very simple. I check if the Filter parameter in the metadata store contains any value. If not, then I’m passing an empty string. Otherwise, I concatenate the query parameter name with the value.
@if(empty(pipeline().parameters.Filter), '', concat('?$filter=', pipeline().parameters.Filter))

Finally, we can use the Query field in the Relative URL of the dataset. We already use that field to pass the entity name and the $count operator, so we have to slightly extend the expression.
@concat(dataset().Entity, '/$count', dataset().Query)

Changing the Copy Data activity is a bit more challenging. The Query field is already defined, but the expression we use should include the $top and $skip parameters, that we use for the client-side paging. Unlike at the Lookup activity, this time we also have to include both $select and $filter parameters and check if they contain a value. It makes the expression a bit lengthy.
@concat('$top=',pipeline().parameters.Batch, '&$skip=',string(mul(int(item()), int(pipeline().parameters.Batch))), if(empty(pipeline().parameters.Filter), '', concat('&$filter=',pipeline().parameters.Filter)), if(empty(pipeline().parameters.Select), '', concat('&$select=',pipeline().parameters.Select)))

With above changes, the pipeline uses filter and select values to extract only the data you need. It reduces the amount of processed data and improves the execution runtime.
IMPROVING MONITORING
As we develop the pipeline, the number of parameters and expressions grows. Ensuring that we haven’t made any mistakes becomes quite a difficult task. By default, the Monitoring view only gives us basic information on what the pipeline passes to the target system in the Copy Data activity. At the same time, parameters influence which data we extract. Wouldn’t it be useful to get a more detailed view?
There is a way to do it! In Azure Synapse Pipelines, you can define User Properties, which are highly customizable fields that accept custom values and expressions. We will use them to verify that our pipeline works as expected.
Open the Copy Data activity and select the User Properties tab. Add three properties we want to monitor – the OData URL, entity name, and the query passed to the SAP system. Copy expression from the Copy Data activity. It ensures the property will have the same value as is passed to the SAP system.

Once the user property is defined we start the extraction job.
MONITORING AND EXECUTION
Let’s start the extraction. I process two OData services, but I have defined Filter and Select parameters to only one of them.
Once the processing has finished, open the Monitoring area. To monitor all parameters that the metadata pipeline passes to child one, click on the [@] sign:

Now, enter the child pipeline to see the details of the Copy Data activity.

When you click on the icon in the User Properties column, you can display the defined user properties. As we use the same expressions as in the Copy Activity, we clearly see what was passed to the SAP system. In case of any problems with the data filtering, this is the first place to start the investigation.

The above parameters are very useful when you need to troubleshoot the extraction process. Mainly, it shows you the full request query that is passed to the OData service – including the $top and $skip parameters that we defined in the previous episode.
The extraction was successful, so let’s have a look at the extracted data in the lake.

There are only three columns, which we have selected using the $select parameter. Similarly, we can only see rows with SoldToParty equals AZ001 and the TotalNetAmount above 1000. It proves the filtering works fine.
I hope you enjoyed this episode. I will publish the next one in the upcoming week, and it will show you one of the ways to implement delta extraction. A topic that many of you wait for!


Recent Comments