by Contributed | Dec 30, 2021 | Technology
This article is contributed. See the original author and article here.
As we approach the new year, we often find ourselves reflecting on what we accomplished in the year that is coming to a close. Global pandemic aside, 2021 was a busy year for Azure Databricks. The platform expanded into new core use-cases while also providing additional capabilities and features to support mature and proven use-cases and patterns. Below you’ll find some of the highlights from 2021.
Lakehouse Platform
In 2021, the Lakehouse architecture really picked up steam. Early in the year, Lakehouse was mentioned in Gartner’s Hype Cycle for Data Management validating it as an architecture pattern being evaluated and leveraged across many different organizations and leading to many data and analytics companies and services adopting and providing guidance around the pattern.
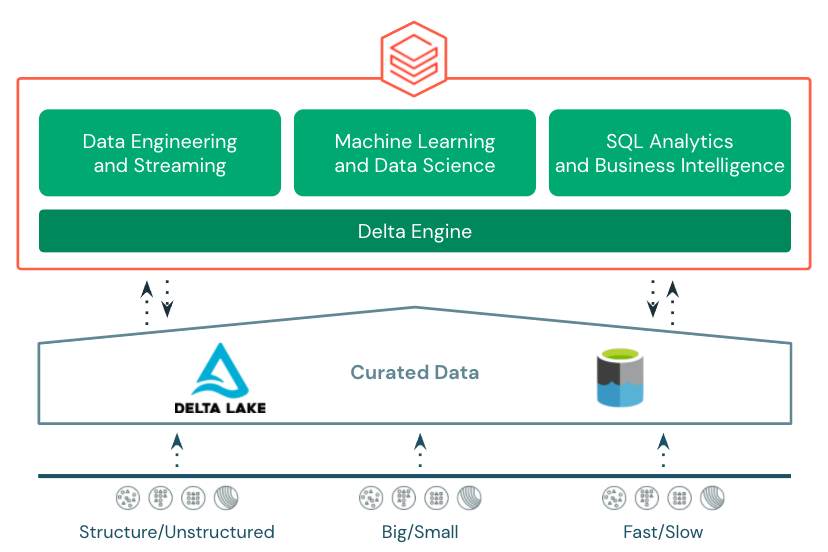
The Azure Databricks Lakehouse Platform provides end-to-end, best in class support for data engineering, stream processing, data science and machine learning, and SQL and business intelligence all on top of transactional, open storage in Azure Data Lake Store.
The foundation for the Azure Databricks Lakehouse is Delta Lake. Delta Lake is an open storage format that brings reliability to curated data in the data lake with acid transactions, data versioning, time-travel, etc. 2021 saw a slew of new features introduced to Delta Lake and Azure Databricks’s integration with Delta Lake including:
Photon
Also in 2021, Photon was made available in Azure Databricks. Photon is the native vectorized query engine on Azure Databricks, written to be directly compatible with Apache Spark APIs so it works with your existing code.

It’s also the same engine that was used to set an official data warehousing performance record. Photon is the default engine for Databricks SQL and is also available as a runtime option on clusters in Azure Databricks. Try it out to see how it improves performance on your existing workloads.
New User Experiences
2021 also brought new user experiences to Azure Databricks. Previously, data engineers, data scientists, and data analysts all shared the same notebook-based experience in the Azure Databricks workspace. In 2021, two new experiences were added.

Databricks Machine Learning was added to cater more to the needs of data scientists and ML engineers with easy access to notebooks, experiments, the feature store, and the MLflow model registry. Databricks SQL was added to cater more to the needs of business analysts, SQL analysts, and database admins with a familiar SQL-editor interface, query catalog, dashboards, access to query history, and other admin tools. An important characteristic of the three distinct user experiences is that all of them share a common metastore with database, table, and view definitions, consistent data security, and consistent programming languages and APIs to Delta Engine.
Databricks SQL
One of the biggest additions to Azure Databricks in 2021 was Databricks SQL. Databricks SQL was announced earlier in the year during the Data and AI Summit and went GA in Azure Databricks in December.

Databricks SQL provides SQL users and analysts with a familiar user experience and best-in-class performance for querying data stored in Azure Data Lake Store. Users can query tables and views in the SQL editor, build basic visualizations, bring those visualizations together in dashboards, schedule their queries and dashboards to refresh, and even create alerts based on query results.

Databricks SQL also provides SQL and database admins with the tools and controls necessary to manage the environment and keep it secure. Administrators can monitor SQL endpoint usage, review query history, look at query plans, and control data access down to row and column level with familiar GRANT/DENY ACLs.

Along with Databricks SQL came stronger and easier integration with Power BI. Over the course of 2021, the Power BI connector for Azure Databricks went GA and got several major performance improvements including Cloud Fetch for faster retrieval of larger datasets into Power BI. With the inclusion of Power BI in the Azure Databricks Partner Connect portal, users can now connect their Databricks SQL endpoint to Power BI with just a few clicks.
Data Engineering
2021 also saw several new features and enhancements to help make data engineers more efficient.

One of those is Delta Live Tables. Delta Live Tables provides a framework for building data processing pipelines. Users define transformations and data quality rules, and Delta Live Tables manages task orchestration, dependencies, monitoring, and error handling. Transformations and data quality rules can be defined using basic declarative SQL statements. Delta Live Tables can also be combined with the Databricks Auto Loader to provide simple, consistent incremental processing of incoming data. The Auto Loader also saw several enhancements including:

Another new capability that was added in 2021 is multi-task job orchestration. Prior to this capability, Databricks jobs could only reference one code artifact (i.e a notebook) per job. This meant that an external jobs orchestration tool was needed to string together multiple notebooks and manage dependencies. Multi-task job orchestration allows multiple notebooks and dependencies to be orchestrated and managed all from a single job. It also enables some additional future capabilities like the ability to reuse a jobs cluster across multiple tasks and even calculate a single DAG across tasks.
Databricks Machine Learning
Finally, 2021 brought some notable new features to an already industry leading data science and machine learning platform in Azure Databricks.

One of those features, announced during the Data and AI Summit, is Databricks AutoML. Databricks AutoML takes an open, glass-box approach to apply machine learning to a selected dataset. It includes prepping the dataset, training models, recording the hyperparameters, metrics, models, etc. using MLflow experiments, and even a Python notebook with the source code for each trial run (including feature importance!). This allows data scientists to easily build on top of the models and code generated by Databricks AutoML. Databricks AutoML automatically distributes trial runs across a selected cluster so that trials run in parallel.

Another feature introduced to Databricks Machine Learning in Azure Databricks was the Databricks Feature Store. The Databricks Feature Store is built on top of Delta Lake and is stored in Azure storage giving it all the benefits of Delta Lake like an open format, built in versioning, time-travel, and built in lineage. When used in an MLflow model, the Databricks Feature Store injects the feature information and feature lookup code right into the MLflow model artifact. This takes the burden off of the data scientist and MLOps engineer. The Databricks Feature Store even includes a sync for online storage like Azure MySQL for low latency feature lookups for real time inference.
Both the Databricks AutoML and Databricks Feature Store are available in the Databricks Machine Learning experience in the Azure Databricks Workspace.
More to Come in 2022
While 2021 was a busy year for Azure Databricks, there’s already some highly anticipated features and capabilities expected in 2022. Those include:
- The Databricks Unity Catalog will make it easier to manage and discover databases, tables, security, lineage, and other artifacts across multiple Azure Databricks workspaces
- Managed Delta Sharing will allow for secure sharing of Delta Lake datasets stored in Azure Data Lake Store to internal consumers and external consumers all with an open, vendor/tool agnostic standard (already available in Power BI!)
- Databricks Serverless SQL will allow for nearly-instant SQL compute startup with minimal management likely resulting in lower costs for BI and SQL workloads
- New low-code/no-code capabilities will enable and empower both data scientists and citizen data scientists to explore, visualize, and even prepare data with just a few clicks.
Get Started
Ready to dive in and get hands on with these new features? Register for a free trial, attend this 3-part training series, and join an Azure Databricks Quickstart Lab where you can get your questions answered by Databricks and Microsoft experts.
by Contributed | Dec 25, 2021 | Technology
This article is contributed. See the original author and article here.
Before implementing data extraction from SAP systems please always verify your licensing agreement. |
Seven weeks passed in a blink of an eye, and we are at the end of the Summer with OData-based extraction using Synapse Pipeline. Each week I published a new episode that reveals best practices on copying SAP data to the lake, making it available for further processing and analytics. Today’s episode is a special one. Not only it is the last one from the series, but I’m going to show you some cool features around data extraction that pushed me into writing the whole series. Since I have started working on the series, it was the main topic I wanted to describe. Initially, I planned to cover it as part of my Your SAP on Azure series that I’m running for the last couple of years. But as there are many intriguing concepts in OData-based extraction, and I wanted to show you as much as I can, I decided to run a separate set of posts. I hope you enjoyed it and learnt something new.
Last week I described how you could design a pipeline to extract only new and changed data using timestamps available in many OData services. By using filters, we can only select a subset of information which makes the processing much faster. But the solution I’ve shared works fine for just a part of services, where the timestamp is available as a single field. For others, you have to enhance the pipeline and make the complex expressions even more complicated.
There is a much better approach. Instead of storing the watermark in the data store and then using it as filter criteria, you can convince the SAP system to manage the delta changes for you. This way, without writing any expression to compare timestamps, you can extract recently updated information.
The concept isn’t new. SAP Extractors are available since I remember and are commonly used in SAP Business Warehouse. Nowadays, in recent SAP system releases, there are even analytical CDS views that support data extraction scenarios, including delta management! And the most important information is that you can expose both SAP extractors and CDS Views as OData services making them ideal data sources.
EXPOSE EXTRACTORS AND CDS VIEWS AS ODATA
The process of exposing extractors and CDS views as OData is pretty straightforward. I think a bigger challenge is identifying the right source of data.
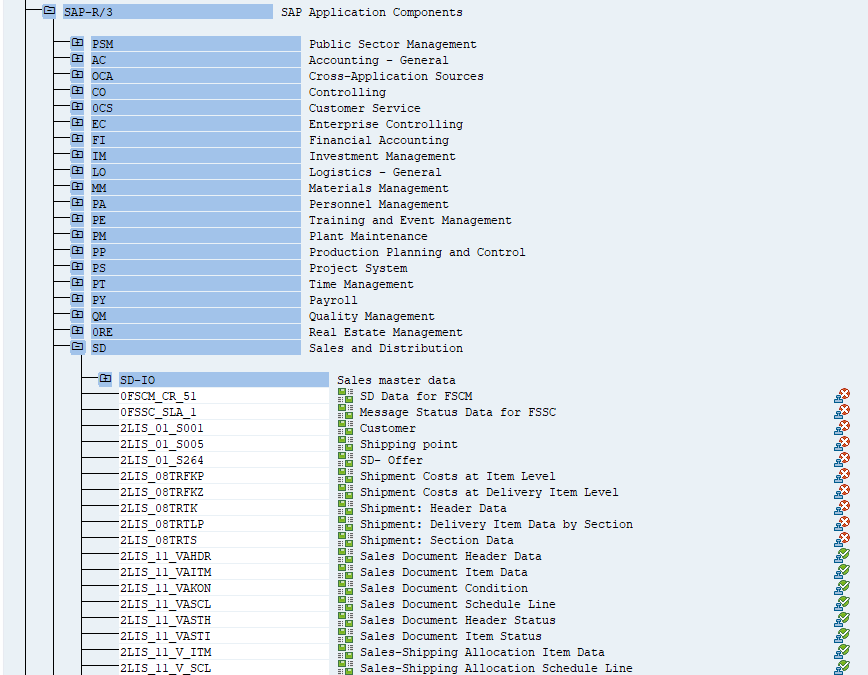
You can list available extractors in your system in transaction RSA5. Some of them may require further processing before using.

When you double click on the extractor name, you can list exposed fields together with the information if the data source supports delta extraction.

In the previous episode, I mentioned that there is no timestamp information in OData service API_SALES_ORDER_SRV for entity A_SalesOrderItem. Therefore, each time we had to extract a full dataset, which was not ideal. The SAP extractor 2LIS_11_VAITM, which I’m going to use today, should solve that problem.
I found it much more difficult to find CDS views that support data extraction and delta management. There is a View Browser Fiori application that lists available CDS Views in the system, but it lacks some functionality to make use of it – for example, you can’t set filters on annotations. The only workaround I found was to enter @Analytics.dataextraction.enabled:true in the search field. This way you can at least identify CDS Views that can be used for data extraction. But to check if they support delta management you have to manually check view properties.

Some CDS Views are still using the timestamp column to identify new and changed information, but as my source system is SAP S/4HANA 1909, I can benefit from the enhanced Change Data Capture capabilities, which use the SLT framework and database triggers to identify delta changes. I think it’s pretty cool. If you consider using CDS Views to extract SAP data, please check fantastic blog posts published by Simon Kranig. He nicely explains the mechanics of data extraction using CDS Views.
https://blogs.sap.com/2019/12/13/cds-based-data-extraction-part-i-overview/
I’ll be using the extractor 2LIS_11_VAITM to get item details and the I_GLAccountLineItemRawData to read GL documents. To expose the object as an OData service create a new project in transaction SEGW:

Then select Data Model and open the context menu. Choose Redefine -> ODP Extraction.

Select the object to expose. If you want to use an extractor, select DataSources / Extractors as the ODP context and provide the name in the ODP Name field:

To expose a CDS View, we need to identify the SQL Name. I found it the easiest to use the View Browser and check the SQLViewName annotation:

Then in the transaction SEGW create a new project and follow the exact same steps as for exposing extractors. The only difference is the Context, which should be set to ABAP Core Data Services.

Further steps are the same, no matter if you work with an extractor or CDS view. Click Next. The wizard automatically creates the data model and OData service, and you only have to provide the description.

Click Next again to confirm. In the pop-up window select all artefacts and click Finish.

The last step is to Generate Runtime Object which you can do from the menu: Project -> Generate. Confirm model definition and after a minute your OData service will be ready for registration.

Open the Activate and Maintain Services report (/n/iwfnd/maint_service) to activate created OData services. Click Add button and provide the SEGW project name as Technical Service Name:

Click Add Selected Services and confirm your input. You should see a popup window saying the OData service was created successfully. Verify the system alias is correctly assigned and the ICF node is active:

OData service is now published and we can start testing it.
EXTRACTING DATA FROM DELTA-ENABLED ODATA SERVICES
Let’s take a closer look at how does data extraction works in delta-enabled OData service.
You have probably noticed during the service creation, that extractors and CDS views give you two entities to use:
- Representing the data source model, with the name starting with EntityOf<objectName>, FactsOf<objectName> or AttrOf<objectName> depending on the type of extractor or view
- Exposing information about current and past delta tokens, with the name starting with DeltaLinksOf<objectName>
By default, if you send a request to the first service, you will retrieve a full dataset. Just like you’d work with any other OData services we covered in previous episodes. The magic happens if you add a special request header:
Prefer: odata.track-changes
It tells the system that you want it to keep track of delta changes for this OData source. Then, as a result, in the response content, together with the initial full dataset, you can find an additional field __delta with the link you can use to retrieve only new and changed information.

The additional header subscribes you to the delta queue, which tracks data changes. If you follow the __delta link, which is basically the OData URL with extra query parameter !deltatoken, you will retrieve only updated information and not the full data set.

In the SAP system, there is a transaction ODQMON that lets you monitor and manage subscriptions to the delta queue.

You can query the second entity, with the name starting with DeltaLinksOf<EntityName>, to receive a list of the current and past delta tokens.

We will use both entities to implement a pipeline in Synapse. Firstly, we will check if there are already open subscriptions. If not, then we’ll proceed with the initial full data extraction. Otherwise, we will use the latest delta token to retrieve changes made since the previous extraction.
IMPLEMENTATION
Open Synapse Studio and create a new pipeline. It will be triggered by the metadata one based on the ExtractionType field. Previously we have used the keywords Delta and Full to distinguish which pipeline should be started. We will use the same logic, but we’ll define a new keyword Deltatoken to distinguish delta-enabled OData services.
I have added both exposed OData services to the metadata store together with the entity name. We won’t implement any additional selection or filtering here (and I’m sure you know how to do it if you need it), so you can leave the fields Select and Filter empty. Don’t forget to enter the batch size, as it’s going to be helpful in the case of large datasets.

Excellent. As I mentioned earlier, to subscribe to the delta queue, we have to pass an additional request header. Unfortunately, we can’t do it at the dataset level (like we would do for REST type connection), but there is a workaround we can use. When you define an OData linked service, you have an option of passing additional authentication headers. The main purpose of this functionality is to provide API Key for services that require this sort of authentication. But it doesn’t stop us from re-using this functionality to pass our custom headers.
There is just one tiny inconvenience that you should know. As the field should store an authentication key, the value is protected against unauthorized access. It means that every time you edit the linked service, you have to retype the header value, exactly the same as you would do with the password. Therefore if you ever have to edit the Linked Service again, remember to provide the header value again.
Let’s make changes to the Linked Service. We need to create a parameter that we will use to pass the header value:
"Header": {
	"type": "String"
}
Then to define authentication header add the following code under the typeProperties:
"authHeaders": {
    "Prefer": {
        "type": "SecureString",
        "value": "@{linkedService().Header}"
    }
},
For reference, below, you can find the full definition of my OData linked service.
{
    "name": "ls_odata_sap",
    "type": "Microsoft.Synapse/workspaces/linkedservices",
    "properties": {
        "type": "OData",
        "annotations": [],
        "parameters": {
            "ODataURL": {
                "type": "String"
            },
            "Header": {
                "type": "String"
            }
        },
        "typeProperties": {
            "url": "@{linkedService().ODataURL}",
            "authenticationType": "Basic",
            "userName": "bjarkowski",
            "authHeaders": {
                "Prefer": {
                    "type": "SecureString",
                    "value": "@{linkedService().Header}"
                }
            },
            "password": {
                "type": "AzureKeyVaultSecret",
                "store": {
                    "referenceName": "ls_keyvault",
                    "type": "LinkedServiceReference"
                },
                "secretName": "s4hana"
            }
        },
        "connectVia": {
            "referenceName": "SH-IR",
            "type": "IntegrationRuntimeReference"
        }
    }
}
The above change requires us to provide the header every time we use the linked service. Therefore we need to create a new parameter in the OData dataset to pass the value. Then we can reference it using an expression:


In Synapse, every parameter is mandatory, and we can’t make them optional. As we use the same dataset in every pipeline, we have to provide the parameter value in every activity that uses the dataset. I use the following expression to pass an empty string.
@coalesce(null)
Once we enhanced the linked service and make corrections to all activities that use the affected dataset it’s time to add Lookup activity to the new pipeline. We will use it to check if there are any open subscriptions in the delta queue. The request should be sent to the DeltaLinksOf entity. Provide following expressions:
ODataURL: @concat(pipeline().parameters.URL, pipeline().parameters.ODataService, '/')
Entity: @concat('DeltaLinksOf', pipeline().parameters.Entity)
Header: @coalesce(null)

To get the OData service name to read delta tokens I concatenate ‘DeltaLinkOf’ with the entity name that’s defined in the metadata store.
Ideally, to retrieve the latest delta token, we would pass the $orderby query parameter to sort the dataset by the CreatedAt field. But surprisingly, it is not supported in this OData service. Instead, we’ll pull all records and use an expression to read the most recent delta token.
Create a new variable in the pipeline and add Set Variable activity. The below expression checks if there are any delta tokens available and then assigns the latest one to the variable.

Add the Copy Data activity to the pipeline. The ODataURL and Entity parameters on the Source tab use the same expression as in other pipelines, so you can copy them and I won’t repeat it here. As we want to enable the delta capabilities, provide the following value as the header:
odata.track-changes
Change the Use Query setting to Query. The following expression checks the content of the deltatoken variable. If it’s not empty, its value is concatenated with the !deltatoken query parameter and passed to the SAP system. Simple and working!
@if(empty(variables('deltatoken')), '', concat('!deltatoken=''', variables('deltatoken'), ''''))

Don’t forget to configure the target datastore in the Sink tab. You can copy all settings from one of the other pipelines – they are all the same.
We’re almost done! The last thing is to add another case in the Switch activity on the metadata pipeline to trigger the newly created flow whenever it finds delta token value in the metadata store.

We could finish here and start testing. But there is one more awesome thing I want to show you!
The fourth part of the series focuses on paging. To deal with very large datasets, we implemented a special routine to split requests into smaller chunks. With SAP extractors and CDS views exposed as OData, we don’t have to implement a similar architecture. They support server-side pagination and we just have to pass another header value to enable it.
Currently, in the Copy Data activity, we’re sending odata.track-chages as the header value. To enable server-side paging we have to extend it with odata.maxpagesize=<batch_size>.
Let’s make the correction in the Copy Data activity. Replace the Header parameter with the following expression:
@concat('odata.track-changes, odata.maxpagesize=', pipeline().parameters.Batch)

Server-side pagination is a great improvement comparing with the solution I described in episode four.
EXECUTION AND MONITORING
I will run two tests to verify the solution works as expected. Firstly, after ensuring there are no open subscriptions in the delta queue, I will extract all records and initialize the delta load. Then I’ll change a couple of sales order line items and run the extraction process again.
Let’s check it!

The first extraction went fine. Out of 6 child OData services, two were processed by the pipeline supporting delta token. That fits what I have defined in the database. Let’s take a closer look at the extraction details. I fetched 379 sales order line items and 23 316 general ledger line items, which seems to be the correct amount.

In the ODQMON transaction, I can see two open delta queue subscriptions for both objects, which proves the request header was attached to the request. I changed one sales order line item and added an extra one. Let’s see if the pipeline picks them up.

Wait! Three records? How is that possible if I only made two changes?
Some delta-enabled OData services provide the functionality not only to track new items but also records deleted information. That’s especially useful in the case of sales orders. Unlike a posted accounting document, which can be only ‘removed’ by reversal posting, a sales order is open for changes much longer. Therefore, to have consistent data in the lake, we should also include deleted information.
But still, why did I extract three changes if I only made two changes? Because that’s how this extractor works. Instead of only sending the updated row, it firstly marks the whole row for deletion and then creates a new one with the correct data.

So the only thing left is the validation of the server-side paging. And I have to admit it was a struggle as I couldn’t find a place in Synapse Pipelines to verify the number of chunks. Eventually, I had to use ICM Monitor to check logs at the SAP application servers. I found there an entry suggesting the paging actually took place – can you see the !skiptoken query parameter received by the SAP system?

Do you remember that when you run delta-enabled extraction, there is an additional field __delta with a link to the next set of data? Server-side paging works in a very similar way. At the end of each response, there is an extra field __skip with the link to the next chunk of data. Both solutions use tokens passed as the query parameters. As we can see, the URL contains the token, which proves Synapse used server-side pagination to read all data.
It seems everything is working fine! Great job!
EPILOGUE
Next week there won’t be another episode of the OData extraction series. During the last seven weeks, I covered all topics I considered essential to create a reliable data extraction process using OData services. Initially, we built a simple pipeline that could only process a single (and not containing much data) OData service per execution. It worked well but was quite annoying. Whenever we wanted to extract data from a couple of services, we had to modify the pipeline. Not an ideal solution.
But I would be lying if I said we didn’t improve! Things got much better over time. In the second episode, we introduced pipeline parameters that eliminated the need for manual changes. Then, another episode brought metadata store to manage all services from a single place. The next two episodes focus on performance. I introduced the concept of paging to deal with large datasets, and we also discussed selects and filters to reduce the amount of data to replicate. The last two parts were all about delta extraction. I especially wanted to cover delta processing using extractors and CDS views as I think it’s powerful, yet not commonly known.
Of course, the series doesn’t cover all aspects of data extraction. But I hope this blog series gives you a strong foundation to find solutions and improvements on your own. I had a great time writing the series, and I learnt a lot! Thank you!


 7.8.png")
 7.9.png")
 8.5.png")


Recent Comments