Queue overflow management keeps customers happy during peak demand
This article is contributed. See the original author and article here.
As the world started unwinding from the pandemic, Sarah joined thousands of travelers in booking flights for a long-planned vacation. Realizing she forgot to add her food preferences, she immediately opened a chat on the airline portal. After a long wait, the virtual agent told her to try again later. All the human support agents were busy. She returned after a few hours and started another chat, but she was too late. The chat service had ended for the day. Super upset and frustrated, she left the chat giving the lowest rating.
Busy queues often lead to lower CSAT
Service delivery organizations dread scenarios like Sarah’s, where the customer must wait a long time in the queue, abandons the attempt with a low satisfaction rating, orworst of allboth. Managing workloads effectively during periods of peak demand is a frequent problem for all businesses. Service organizations face the additional challenge of support requests that arrive outside of business hours. Companies are looking for ways to enhance their customers’ experience to drive higher CSAT. Efficient queue overflow management is an essential part.
Introducing queue overflow management in Microsoft Dynamics 365 Customer Service
With queue overflow management, businesses can proactively manage overflow when callers are experiencing abnormally long wait times or a queue has many unassigned work items.
Corrective actions are specific to service channels or modalities. During peak demand, organizations can transfer calls to a different queue or to voicemail or offer to call the customer back later. Similarly, conversations and records can be transferred from an overflowing queue to a different queue.
How to set up queue overflow management
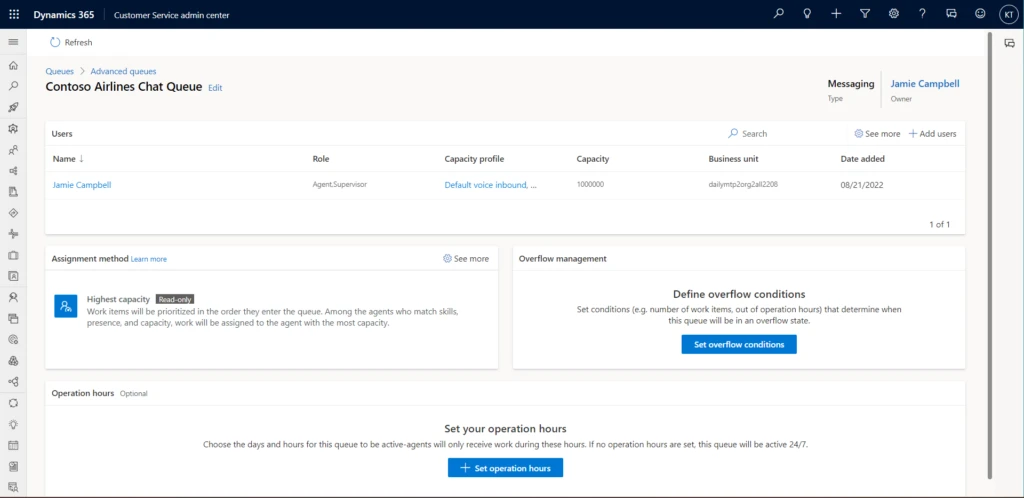
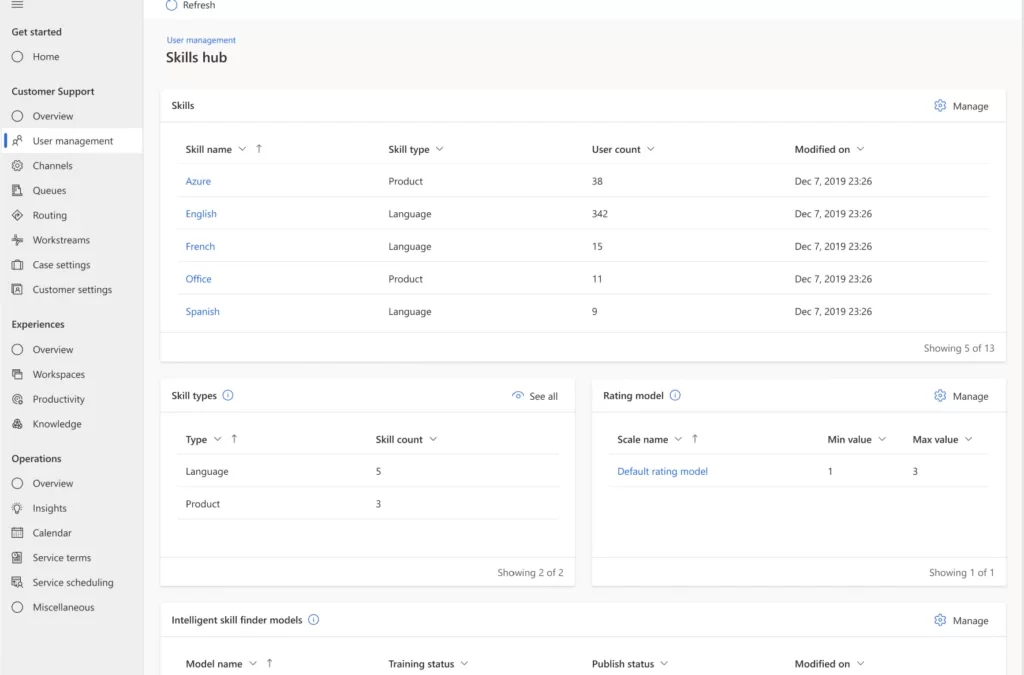
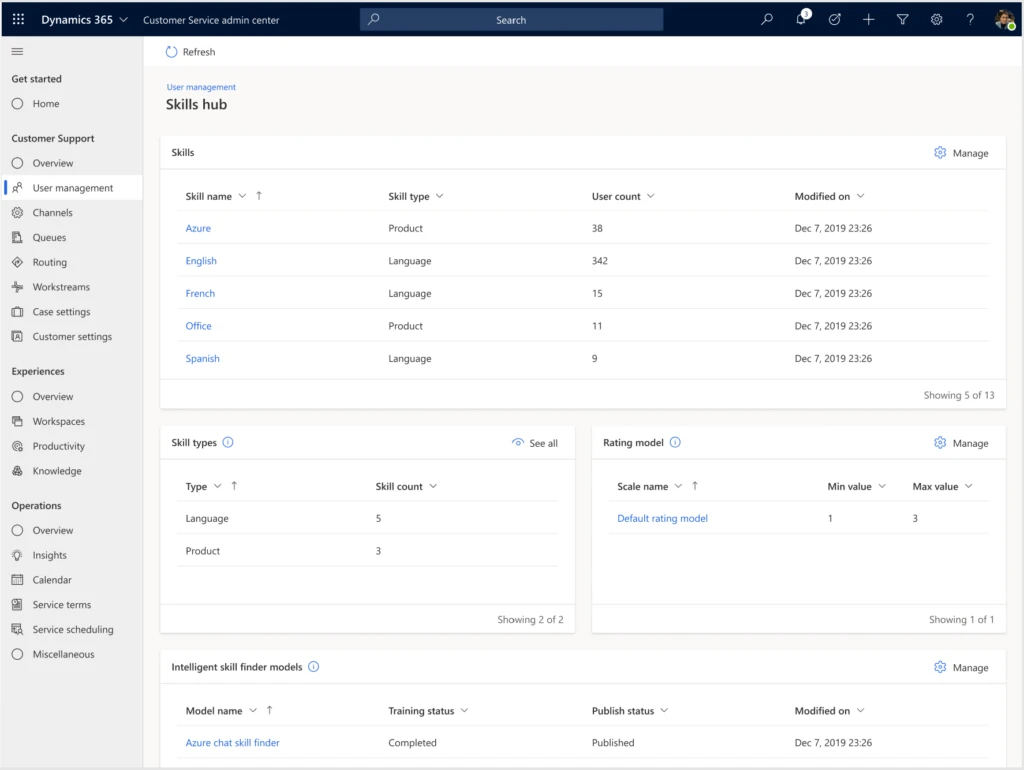
In the Customer Service admin center, select Queues > Advanced queues. Select Set overflow conditions in the Overflow management tile.
Then define the conditions that will determine whether the queue is overflowing and what action to take if it is.
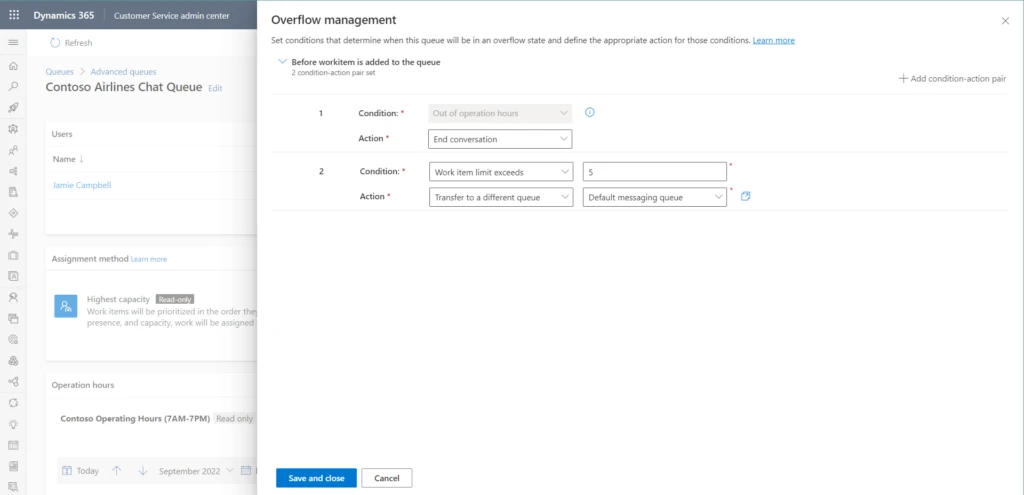
Overflow evaluation happens before a work item is added to the queue. You can think of it as a sort of “pre-queueing” step.
How queue overflow management would make Sarah a happy customer
Let’s return to our excited traveler Sarah to learn how queue overflow management would help the airline avoid a dissatisfied customer. She’s bought her tickets and initiated a chat to add a meal preference to her reservation. The airline now has two queues for customer chats. With customers already holding in one, queue overflow management automatically routes Sarah to the other, where there’s no wait.
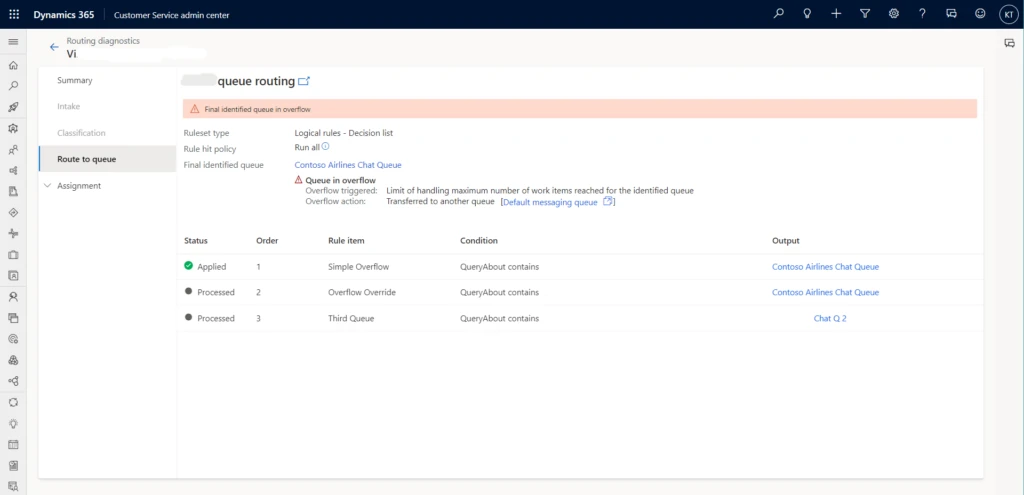
Investigate queue overflow events with routing diagnostics
Dynamics 365 Customer Service captures information about queue overflow events in routing diagnostics. Admins can use the information to understand failure scenarios and plan their business workflows accordingly.
Prepare better to serve better
It’s hard to predict peak demand events. Queue overflow management can help. Admins and supervisors are better prepared for contingencies, and customers like Sarah get a faster resolution to their issues.
Learn more
To find out more about queue overflow management in Customer Service, read the documentation: Manage overflow of work items in queues
This blog post is part of a series of deep dives that will help you deploy and use unified routing at your organization. See other posts in the series to learn more.
The post Queue overflow management keeps customers happy during peak demand appeared first on Microsoft Dynamics 365 Blog.
Brought to you by Dr. Ware, Microsoft Office 365 Silver Partner, Charleston SC.

Recent Comments