Microsoft is named a Leader in 2022 Gartner® Magic Quadrant™ for Field Service Management
This article is contributed. See the original author and article here.
From automating work orders to leveraging mixed reality, Microsoft Dynamics 365 Field Service continues to evolve to meet the growing changes of field operations and support seamless collaboration. Quality service is crucial to organizations remaining resilient despite uncertainty. Employees are working from remote or distributed locations, reducing the amount of personalized interaction. Customers are demanding self-service options that empower them to resolve issues.
As assets grow in complexity, remote monitoring of Internet of Things (IoT) devices continues to transform service from a cost center to a revenue generator. Changes in technologies that personalize the service experience, increase worker productivity, and optimize service operations elevate the frontline worker effectiveness and increase customer experience. These differentiators propelled Dynamics 365 Field Service.
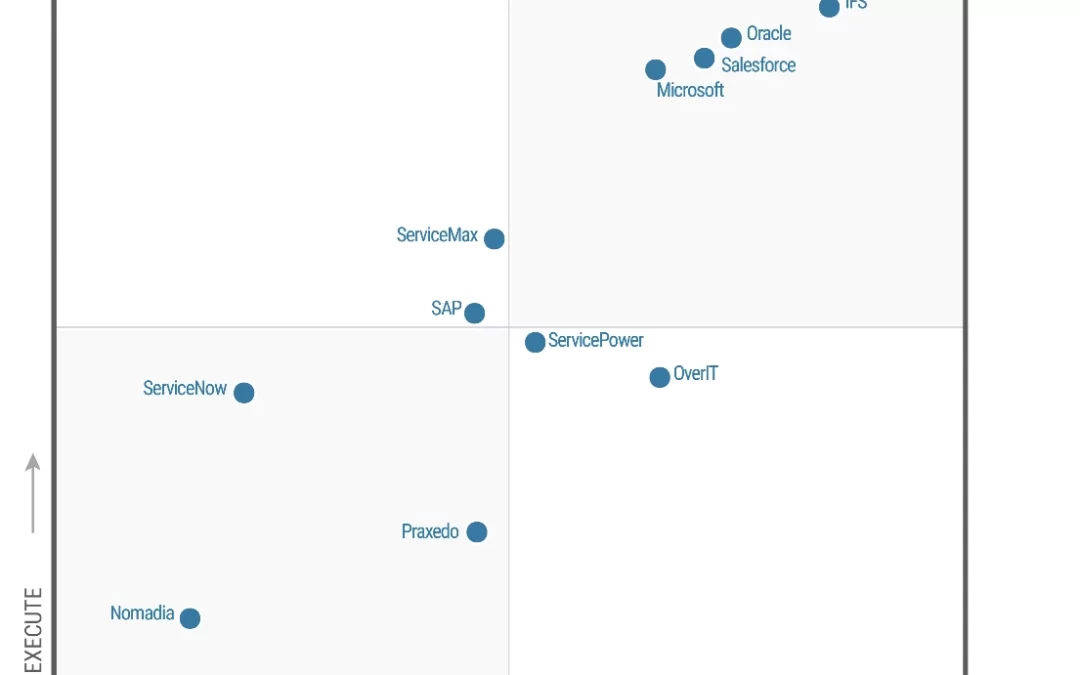
It is with great pride that Microsoft shares its position as a Leader within the 2022 Gartner Magic Quadrant for Field Service Management* for the third consecutive year.
We believe this placement recognizes Microsoft’s continuous investment and authority across our service solution and cloud functionality.
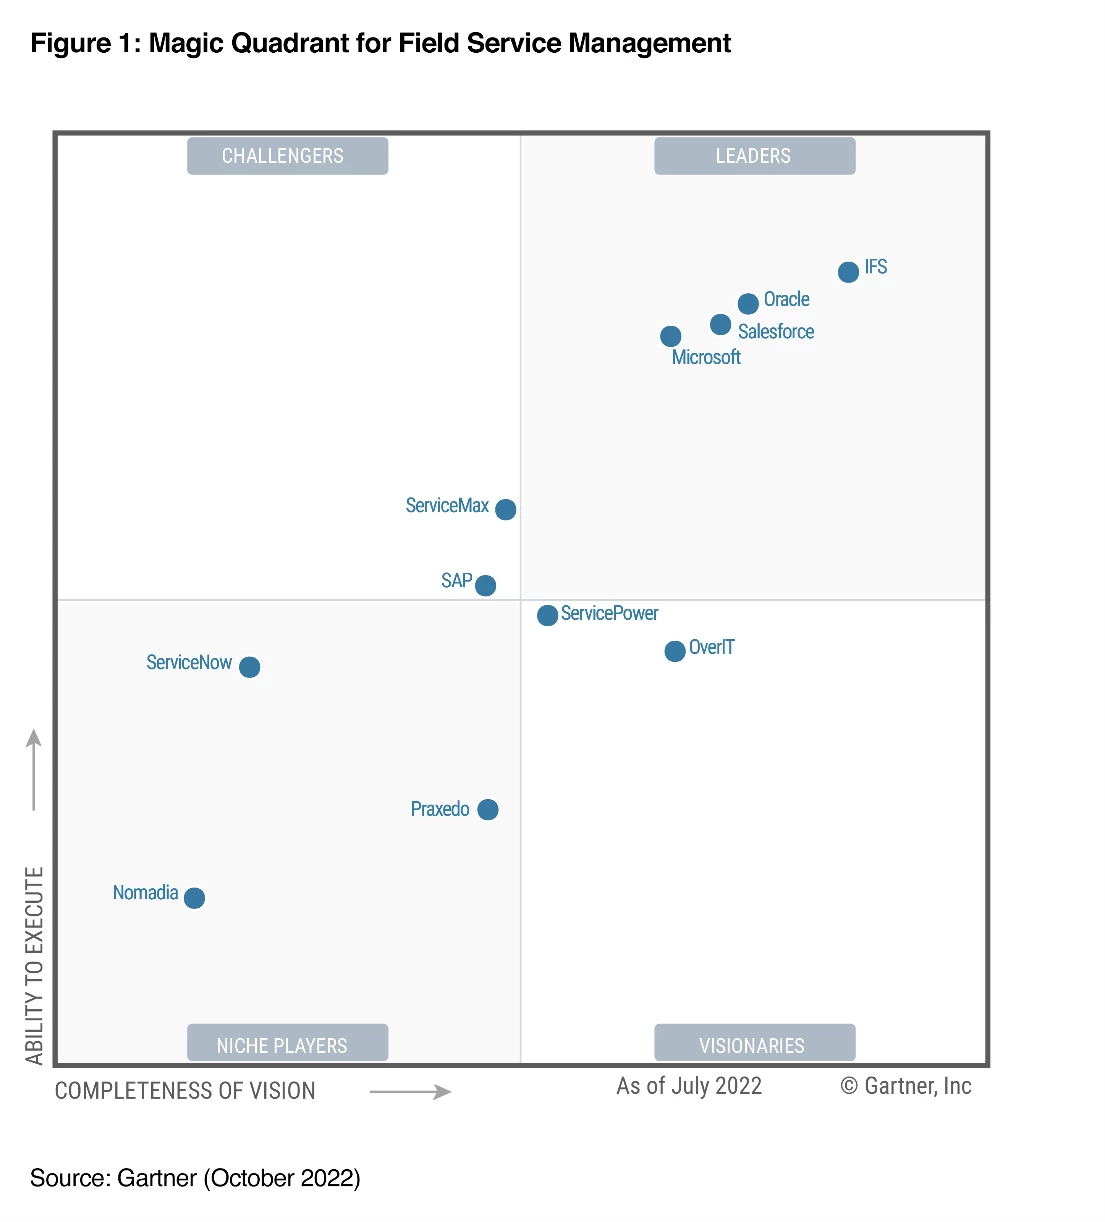
Gartner defines field service management (FSM) as a discrete market within the broader customer service and support software market. FSM suites support field service providers (FSPs) whose technicians travel to customer locations to provide installation, repair, and maintenance services for equipment and systems (consumer, commercial, or industrial). FSPs may also manage, maintain, and monitor these assets under a predefined service or maintenance contract.
What is Connected Field Service?
By using the power of IoT and cloud services, Connected Field Service enables organizations to transform the way they provide service from a costly break/fix model to a proactive, predictive service model. Organizations can respond faster through a combination of IoT diagnostics, scheduling, asset maintenance, and inventory on the same platform.
Through remote monitoring, technicians can quickly identify the equipment and the issueoften before the customer is even aware. IoT devices communicate with the field service management system, sending alerts to technicians about anomalies with the device. Remote field service technicians can quickly isolate the issue and sometimes resolve the problem by sending device commands or resetting the device without ever stepping foot on the customer’s site.
Clean Energy reaps value from Connected Field Service
Take, for example, Clean Energy,one of the largest providers of renewable natural gas. The company offers renewable natural gas as a transportation fuel, significantly reducing pollution and greenhouse gas caused by diesel and gasoline. It owns, operates, and maintains 550 stations across the United States and Canada. Clean Energy also develops renewable natural gas production facilities.
Reducing pollution is important to Clean Energy. Not to mention, the extensiveness of Clean Energy’s operation along with siloed data and applications created the need for specialized systems. Overcoming silos and meeting their pollution-reduction goal hinges on internal efficiency, anchored by a collaborative, well-integrated infrastructure. The company began its journey with Microsoft Dynamics 365 and now manages its environment using Dynamics 365. It also takes in and analyzes sensor data from its automated fuel stations using Microsoft Azure IoT and equipped its technicians with Microsoft Dynamics 365 Remote Assist.
Technicians are now empowered with data and can pull up information about their teams and the stations they’re managing. The analysis performed by Microsoft Azure IoT Central results in a request to generate a work order to Dynamics 365 Field Service. That data is then sent to the company’s Azure Data Lake for use in management reportingand eventually, to create the base for predictive analytics. And because the IoT sensors transmit status data, those technicians no longer get up in the middle of the night to drive long distances to inspect stations that don’t need ita contribution to greater job satisfaction.
With Connected Field Service, Clean Energy is achieving its efficiency and cost savings goals. During the past couple of years, it pivoted seamlessly to remote work, reducing travel with virtual training and supporta win for the planet.
Clean Energy is just one of many organizations that has reaped value from Connected Field Service and is harnessing its capabilities to build stronger, more collaborative, and proactive service delivery.

The bottom line
Many service organizations consist of dispatchers answering service calls, putting customers on hold, asking the same questions repeatedly, while searching for the next available technician to dispatch. This process is inefficient, costly, and unsatisfying to the customer.
The world of field service is changing. Today, service organizations are evolving into profit centers, redefining business models, and creating powerful and fulfilling customer experiencesall supported by global edge solutions like Dynamics 365 Field Service.
We’re excited to be positioned as a Leader in the Gartner Magic Quadrant and are committed to bringing you the best and most featured field service application available. Depend on the multidimensional capabilities of Dynamics 365 Field Service to help you better personalize customer engagements, improve employee effectiveness, and optimize service operations now and tomorrow.
Read the 2022 Gartner Magic Quadrant for Field Service Management report.
Learn more about:
Source: Gartner, Magic Quadrant for Field Service Management, Jim Robinson, Leif-Olof Wallin, 24 October 2022
*Gartner and Magic Quadrant are registered trademarks and service marks of Gartner, Inc. and/or its affiliates in the U.S. and internationally and are used herein with permission. All rights reserved.
**This graphic was published by Gartner, Inc. as part of a larger research document and should be evaluated in the context of the entire document. The Gartner document is available upon request from Microsoft.
Gartner does not endorse any vendor, product or service depicted in its research publications, and does not advise technology users to select only those vendors with the highest ratings or other designation. Gartner research publications consist of the opinions of Gartner’s research organization and should not be construed as statements of fact. Gartner disclaims all warranties, expressed or implied, with respect to this research, including any warranties of merchantability or fitness for a particular purpose.
The post Microsoft is named a Leader in 2022 Gartner® Magic Quadrant™ for Field Service Management appeared first on Microsoft Dynamics 365 Blog.
Brought to you by Dr. Ware, Microsoft Office 365 Silver Partner, Charleston SC.


Recent Comments