This article is contributed. See the original author and article here.
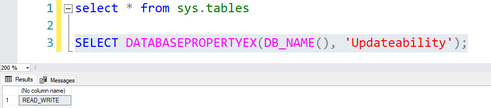
Today, we got a question where our customer asked that if using ApplicationIntent=ReadWrite with an user with db_datareader permision, the results of DATABASEPROPERTYEX(DB_NAME(), ‘Updateability’) will be affected or not.
In this situation, let’s try to create a business critical database with readscale out enabled and create the following user. Right now, the answer is not affected.
create user UserName with password = 'PasswordX2X3X1!'
alter role db_datareader add member UserName
Once we have established the connection using SQL SERVER Management Studio using this user and execute the query
This article is contributed. See the original author and article here.
Today, we’re announcing all of Yammer will become Microsoft Viva Engage. We’ll continue to enhance Viva Engage with new capabilities that encourage leadership engagement, authentic expression, and knowledge discovery, including new experiences rolling out today.
This article is contributed. See the original author and article here.
In this article we will learn how to setup Azure container registry. As you know we use container registry stores and manages private container images and other artifacts, like the way Docker Hub stores public Docker container images. Let’s create a container in Visual Studio that we can push to GitHub and then deploy to Azure Container Registry. If you want to follow along on your local computer, you’ll need Docker Desktop installed. This allows you to run containers locally before pushing them to a remote hosting environment, like Azure App Service, or a more complex orchestration environment, like Azure Kubernetes Service. You can download the Docker Desktop installed from this link. Before we move to next step I believe that Docker Desktop is successfully setup at your workstation.
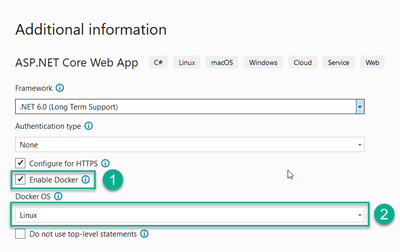
Let’s start by opening Visual Studio and creating a new project. I’ll choose the ASP.NET Core template. Click Next, give the project a name, and then let’s enable Docker. This will create the Dockerfile and configure the project to run locally on Docker Desktop. You can choose whether to create a Linux or a Windows container as shown in below screenshots. Let’s just leave Linux. Once the project is created, you can see there’s a Dockerfile here, and it shows that the ASP.NET 5 image from Microsoft is being used as the base and the SDK image is being used for the build.
Let’s close this file and let’s change this to the name of the image that will be getting built and let’s run this project (Click on Docker run button). The container’s window opens at the bottom, and then the browser shows the code running in the container.
Now let’s close this and go to the Git menu and create a Git repository. I’m already logged into GitHub, and it’s going to create a local repo, as well as the remote repo in GitHub with the same name. I’ll leave these defaults, and let’s create this. Let’s go back to the browser and refresh the homepage here. And there’s the repo that got created. The code has been uploaded, and you can see there is the Dockerfile.
Now let’s create the Azure Container Registry and the credentials needed for GitHub actions to push this container to the registry.
I have the Azure portal open here, and I’m logged in as an administrator. I’m going to open up the Azure Cloud Shell, so we’ll have a Bash Shell here where we can run commands.
You can do this from your desktop, too, but you’ll need the Azure CLI installed locally. Everything is already configured in the Cloud Shell, and I don’t need to log into the CLI, either. Now, I’m going to be running commands, and they’ll be using variables, so you’ll be able to just copy the following standard variables (required during setup the Azure container registry) into new script file called variables.sh.
But these variables need to be set up front. So rather than type them in individually, I’m going to upload a file to Azure, and the Cloud Shell is backed by your own file share (as shown in below screenshot), which makes this possible. I have this file called variables.sh. Let’s upload this.
And now if I click on this Edit button, there’s the files on the left, and the uploaded file is at the bottom. Click on it, and you can edit it right here in the browser. Change the values of these variables to whatever you want the resources to be called. We’ll need a resource group, a name for the Azure Container Registry instance that we’ll be creating, and this needs to be unique across Azure. Then, a service principal name, and this is just a security account that we’ll be granting privileges to for GitHub to use for deployments. And finally, an Azure region for the location. I’ll use East US. Now let’s save this file.
And we can run this file by typing a period, a space, and then the file name. This allows these variables to be available within the current Bash context. If I echo out the value of one of these variables, you can see that it’s available.
Okay, let’s run our first command. First, let’s create a resource group. We’ll use the name and location variables, and this will give us a container that we can keep everything in and delete it all as a group later. Next, let’s get the ID of the resource group using this az group show with a query for the ID. And I forgot to preface the variable name with a dollar sign. Okay, there it is.
az group create --name $RG_NAME --location $RG_LOCATION
RG_ID=$(az group show --name $RG_NAME --query id --output tsv)
Now let’s create the service principal that GitHub will use to deploy the container. We’re using az ad sp create for rbac, scoping it to just the resource group, and adding this sdk auth parameter. This will output the result in a file format that we can paste into a GitHub secret and use for authentication within a GitHub action later. I just masked the values for security reasons. This gives us back info about the service principal, including the password, and it’s called a client secret here. You won’t be able to see this password again, and we’re going to need all this later. So let’s copy it and open up Notepad and paste the service principal information here.
az ad sp create-for-rbac --name $SP_NAME --scope $RG_ID --role Contributor --sdk-auth
Okay, now rather than copy the client ID, let’s do a query to store it in a variable because we’ll need it for other commands. I’ll just echo this out to make sure it’s the same. Good. Okay, now we’re ready to create the Azure Container Registry instance. We do that with a az acr create. With a resource group name, a name for the registry, and a SKU, we can just use the basic pricing tier for testing. Let’s run this, and I’ll close this editor. When it completes, we get the resource info back and the login server URL is listed here. Let’s go to All services and search for Container and open up the Container registries. It can take a few seconds to show up. I’ll just refresh this.
SP_ID=$(az ad sp list --display-name $SP_NAME --query "[].appId" --output tsv)
And there’s the new registry. Now let’s go back to the Cloud Shell at the bottom of the browser window here, and let’s run this command to get the ID of the container registry. I’ll just print that out. Okay, now we need to assign a permission to the service principal that will allow GitHub to push containers into the registry using this credential.
We do that with az role assignment, and the role we’re assigning to the service principal is the AcrPush role. Okay, now we have the resource created and the permissions we need. The next step is to create the GitHub actions workflow to build and push the container image, and we’ll configure GitHub secrets for the service principal values that the workflow will need. Let’s do that next.
az acr create --resource-group $RG_NAME --name $ACR_NAME --sku Basic
ACR_ID=$(az acr show --name $ACR_NAME --query id --output tsv)
az role assignment create --assignee $SP_ID --scope $ACR_ID --role AcrPush
This article is contributed. See the original author and article here.
Azure DevOps email notifications are great, sometimes project team members doesn’t want to get notified for each and every state change in a User Story, Tasks and Bug and only a specific few want to get to notified whenever a bug is created or closed (skipping the intermediate states). And some team members ask for all the fields in the email body they want additional fields instead of the fields that were changed. I have also seen the customer requirement where they want to be notified only specific date and time in a week with summarized work items(e.g. send email of all tasks are in close state under a particular user story).
Though the 1st one is easily achievable using notification settings filter but the still the email will go out to the entire team and the second and third cases are bit tricky, so I decided to implement this solution using Power Automate. Power Automate is a public cloud service to help individuals and teams to set up automated workflows between their favorite apps and services to synchronize, get notifications, collect data, and more.
Before deep dive into Power Automate we should know about it’s license cost. As announced in August, Power Automate is now a fundamental part of the Office 365 suite. Three months after this announcement Power Automate was enabled as a service as a part of all existing Office 365 SKU’s. As users everywhere in the world can now use Power Automate, it has appeared in the app launcher for them.
The Power Automate Free license is used only for tracking purposes. Enabling or disabling it has no effect on a user’s ability to create flows. If you disable the Power Automate Free license, it becomes enabled again when a user logs in. This is the expected behavior.
Lets start work on following requirement – Requirement: Send an Email notification every Friday 11:00 AM with consolidated details e.g. User Story and Tasks. This email should be trigger when all tasks are in closed state (User story ready to close).
As I explained in previous paragraphs that we are going to use Power Automate workflow for Azure DevOps email notification customization. This tool is very helpful doing more with less by streamlining repetitive tasks and business processes—increasing efficiency and reducing costs—with Microsoft Power Automate. We can also use Azure Logic Apps for this purpose and all the required connectors are available there also.
Below are some standard steps to implement the workflow.
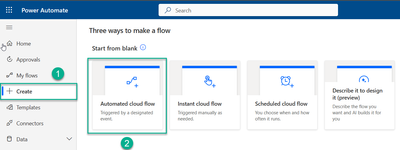
Step 1: Go to link – Microsoft Flow to setup new workflow.
Step 2: Go to create option to setup new workflow using automate cloud flow option.
Step 3: In next screen give appropriate name to flow and skip.
Step 4: At next screen, find the “recurrence” trigger to add in our workflow. This trigger will help us to schedule our workflow to be triggered on particular date and time.
In my case I scheduled it for every day for 11:00 AM EST, you can customize it as per your requirement.
Step 5: Click on new step button
Step 6: Search next action “Get Query Result” as part of next step and configure it as shown in below screenshot. In this configuration you have to point you Azure DevOps organization, project name and query saved under Shared Queries section.
Note: I assume you already have the query to fetch the details of parent and child items you want to put in email notifications. If not please create work item query in Azure DevOps.
Here is example of sample nested query – This query will fetch the User Story and all the child tasks associate with it in any state. We can modify it as per our requirement and reference in our “Get Query Result” workflow.
Step 7: Click on new step button
Step 8: This step almost the repetition of step 6 because we have to reference another work item query for apply condition – “write a query that will only send that email if all tasks under one User Story become a certain status”. In my example I want to trigger email when all tasks under user story in “Closed” state. Even a single task in “Active” don’t send an email.
Here is the example of second query – this query will return the result set if any task under user story in Active step. We can modify or customized for other states as well like – New, In progress etc.
Step 9: Click on new step button
Step 10: Search for new action “Condition” and configure it like below conditions. We can add expression “length(body(‘Query_-_Condition’)?[‘value’])” to check the result of previous step query result set value. This condition tells use that trigger email only when all tasks are in “Closed” state and there is no active tasks under User Story.
Step 11: Condition action has two parts “If yes” and “If No”. We have to extend our workflow “if yes” condition meet. So click on “Add an action” button and find for “Create HTML Table” and configure it as shown in below screenshot. Use “Dynamic Content” option to add details in HTML report. Dynamic content section will show the result of all filed values coming from Work item queries we created in previous states. You can add as much as field details you want to show in your email body.
Step 12: Click on “Add an action” button under “If Yes” block and search for “Send an email” action. Configure this task as shown in below screenshot.
To: Your target team email group e.g. team-developers@xyz.com
Subject: [Your choice]
Body: You can design your HTML body template as per your requirement OR alternatively can put simple text with the message you want to send to team with result set of work item query.
The import part is you have to insert the result of work item query (e.g. previous step HTML report output) in email body as shown in below screenshot. You can use “Add Dynamic Content” and click on Output.
Step 13: We have almost done and now the workflow is ready for “Save” and “Test”. It should be look like the below screenshots as per our all the previous steps we have gone through in this guidance document.
Step: 14: Click on “Save” button located a top right section.
Step 15: Click on “Test” button to test your workflow working as expected or not. You can select manual.
Step 16: On successful run you will see the configuration box and an email should be delivered in your inbox with result set. You can see sample email with User Story and Tasks detail with their current state.
This article is contributed. See the original author and article here.
Companies that operate in more than one channel or region must fulfill orders over networks of ever-increasing complexity. When supply shortages happenand they willhow do you make the best use of limited stock across your most important channels, customer groups, regions, and promotions? And once you decide that, how do you make sure the allocated stock is protected from any other use? With inventory allocation, a new capability of the Microsoft Dynamics 365 Supply Chain Management Inventory Visibility service.
Inventory allocation allows you to virtually apportion your on-hand stock as part of the sales operational planning process before any actual sales are made. It has two purposes:
Inventory protection (ring fencing): Protecting the allocated inventory from other allocations, reservations, or sales demands.
Oversell control: Restricting allocated quantities so that the receiving party doesn’t over-consume them when the actual sales transaction takes place.
Incorporate inventory allocation into your sales planning
First, let’s define a few terms:
Allocation group: The group that owns the allocation, such as a sales channel or a customer group.
Allocation group value: The value of each allocation group. For example, “store” might be the value of the sales channel allocation group, and “VIP” might be the value of the customer allocation group.
Allocation hierarchy: A combination of allocation groups in a hierarchy that determines how inventory is allocated to each group.
Virtual common pool: The quantity of inventory that’s available to allocate.
Now let’s do a case study to see how a company might include inventory allocation in its sales planning process to optimize the distribution and fulfillment flow of limited stock.
Inventory allocation case study
Contoso sells laptops both online and in-store in several countries. Supply chain disruptions severely affected manufacturing capacity of a popular model. The company needs to balance its fulfillment capability between its online and in-store channels in Australia and New Zealand.
First, Contoso determines allocation groups and allocation hierarchies in accordance with the company’s distribution strategy. The allocation is virtual based on current stock numbers. It doesn’t necessarily entail moving physical inventory. Contoso does the initial segmentation and planning of allocation quantities in its planning system, but they could also do it manually based on historical experience. They decide to allocate first by regions (Australia, New Zealand) and then by sales channels (online, store).
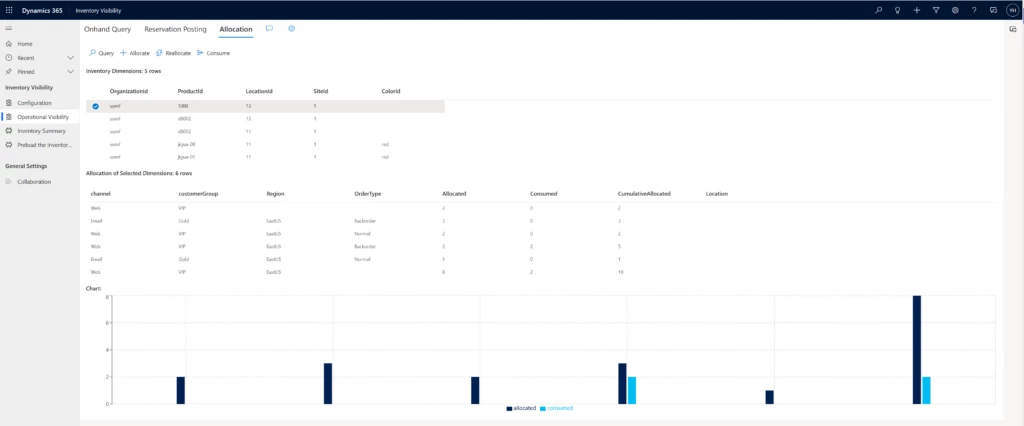
Next, Contoso executes the allocation in the Inventory Visibility service to ring-fence each group’s allotted quantity. An allocation can’t be used by another group unless a reallocation adjustment is made. The Australia group is allotted 5,000 laptops and the New Zealand group gets 3,000, leaving 2,000 as contingency in the virtual common pool. Of Australia’s 5,000, 3,000 is allotted to its online sales channel group. No stock transfer is needed yet, since the actual sales transactions and fulfillment haven’t taken place.
Next, the company fills its regional and channel demands through physical or soft consumption, ensuring that orders from allocation groups use their allocation. A customer visits Contoso’s Australia website and purchases a laptop. The website checks the Inventory Visibility service, confirms that enough of the Australia allocation for the online sales channel is available to fill the order, and allows the order to be processed. The consumed quantity can either be a soft reservation, as in this case, which deducts from the available stock level without affecting physical inventory quantity; or a deduction from physical stock, as in a “cash and carry” transaction in which the store inventory is directly consumed.
Contoso processes and ships the customer’s order as usual.
You can easily incorporate inventory allocation into your order fulfillment process. You’ll have more control over and visibility into your distribution and fulfillment network so that you can make better use of your on-hand stock. Inventory allocation goes beyond planning right through to the execution phase, ensuring allocated stock is protected and helping you keep your promises to sales channels, customer groups, and business partners.


Recent Comments