This article is contributed. See the original author and article here.
Microsoft Defender External Attack Surface Management (EASM) continuously discovers a large amount of up-to-the-minute attack surface data, helping organizations know where their internet-facing assets lie. Connecting and automating this data flow to all our customers’ mission-critical systems that keep their organizations secure is essential to understanding the data holistically and gaining new insights, so organizations can make informed, data-driven decisions.
In June, we released the new Data Connections feature within Defender EASM, which enables seamless integration into Azure Log Analytics and Azure Data Explorer, helping users supplement existing workflows to gain new insights as the data flows from Defender EASM into the other tools. The new capability is currently available in public preview for Defender EASM customers.
Why use data connections?
The data connectors for Log Analytics and Azure Data Explorer can easily augment existing workflows by automating recurring exports of all asset inventory data and the set of potential security issues flagged as insights to specified destinations to keep other tools continually updated with the latest findings from Defender EASM. Benefits of this feature include:
Users have the option to build custom dashboards and queries to enhance security intelligence. This allows for easy visualization of attack surface data, to then go and perform data analysis.
Custom reporting enables users to leverage tools such as Power BI. Defender EASM data connections will allow the creation of custom reports that can be sent to CISOs and highlight security focus areas.
Data connections enable users to easily access their environment for policy compliance.
Defender EASM’s data connectors significantly enrich existing data to be better utilized for threat hunting and incident handling.
Data connectors for Log Analytics and Azure Data Explorer enable organizations to integrate Defender EASM workflows into the local systems for improved monitoring, alerting, and remediation.
In what situations could the data connections be used?
While there are many reasons to enable data connections, below are a few common use cases and scenarios you may find useful.
The feature allows users to push asset data or insights to Log Analytics to create alerts based on custom asset or insight data queries. For example, a query that returns new High Severity vulnerability records detected on Approved inventory can be used to trigger an email alert, giving details and remediation steps to the appropriate stakeholders. The ingested logs and Alerts generated by Log Analytics can also be visualized within tools like Workbooks or Microsoft Sentinel.
Users can push asset data or insights to Azure Data Explorer/Kusto to generate custom reports or dashboards via Workbooks or Power BI. For example, a custom-developed dashboard that shows all of a customer’s approved Hosts with recent/current expired SSL Certificates that can be used for directing and assigning the appropriate stakeholders in your organization for remediation.
Users can include asset data or insights in a data lake or other automated workflows. For example, generating trends on new asset creation and attack surface composition or discovering unknown cloud assets that return 200 response codes.
How do I get started with Data Connections?
We invite all Microsoft Defender EASM users to participate in using the data connections to Log Analytics and/or Azure Data Explorer so you can experience the enhanced value it can bring to your data, and thus, your security insights.
Step 1) Ensure your organization meets the preview prerequisites
Aspect
Details
Required/Preferred
Environmental Requirements
Defender EASM resource must be created and contain an Attack Surface footprint. Must have Log Analytics and/or Azure Data Explorer/ Kusto
Required Roles & Permissions
– Must have a tenant with Defender EASM created (or be willing to create one). This provisions the EASM API service principal.
– User and Ingestor roles assigned to EASM API (Azure Data Explorer)
Step 2) Access the Data Connections
Users can access Data Connections from the Manage section of the left-hand navigation pane (shown below) within their Defender EASM resource blade. This page displays the data connectors for both Log Analytics and Azure Data Explorer, listing any current connections and providing the option to add, edit or remove connections.
Connection prerequisites: To successfully create a data connection, users must first ensure that they have completed the required steps to grant Defender EASM permission for the tool of their choice. This process enables the application to ingest our exported data and provides the authentication credentials needed to configure the connection.
Step 3: Configure Permissions for Log Analytics and/or Azure Data Explorer
Log Analytics:
Open the Log Analytics workspace that will ingest your Defender EASM data or create a new workspace.
On the leftmost pane, under Settings, select Agents.
Azure Data Explorer:
Expand the Log Analytics agent instructions section to view your workspace ID and primary key. These values are used to set up your data connection.
Open the Azure Data Explorer cluster that will ingest your Defender EASM data or create a new cluster.
Select Databases in the Data section of the left-hand navigation menu.
Select + Add Database to create a database to house your Defender EASM data.
4. Name your database, configure retention and cache periods, then select Create.
5. Once your Defender EASM database has been created, click on the database name to open the details page. Select Permissions from the Overview section of the left-hand navigation menu.
To successfully export Defender EASM data to Data Explorer, users must create two new permissions for the EASM API: user and ingestor.
6. First, select + Add and create a user. Search for “EASM API,” select the value, then click Select.
7. Select + Add to create an ingestor. Follow the same steps outlined above to add the EASM API as an ingestor.
8. Your database is now ready to connect to Defender EASM.
Step 4: Add data connections for Log Analytics and/or Azure Data Explorer
Log Analytics:
Users can connect their Defender EASM data to either Log Analytics or Azure Data Explorer. To do so, select “Add connection” from the Data Connections page for the appropriate tool. The Log Analytics connection addition is covered below.
A configuration pane will open on the right-hand side of the Data Connections screen as shown below. The following fields are required:
Name: enter a name for this data connection.
Workspace ID For Log Analytics, users enter the Workspace ID and the coinciding API key associated with their account.
Api key Log Analytics users enter the API key associated with their account
Content: users can select to integrate asset data, attack surface insights, or both datasets.
Frequency: select the frequency that the Defender EASM connection sends updated data to the tool of your choice. Available options are daily, weekly, and monthly.
Azure Data Explorer:
The Azure Data Explorer connection addition is covered below.
A configuration pane will open on the right-hand side of the Data Connections screen as shown below. The following fields are required:
Name: enter a name for this data connection.
Cluster name:
Region: The region associated with Azure Data explorer
Database: The database associated with the Azure Data explorer
Content: users can select to integrate asset data, attack surface insights, or both datasets.
Frequency: select the frequency that the Defender EASM connection sends updated data to the tool of your choice. Available options are daily, weekly, and monthly.
Step 5: View data and gain security insights
To view the ingested Defender EASM asset and attack surface insight data, you can use the query editor available by selecting the ”Logs” option from the left hand menu of the Azure Log Analytics Workspace you created earlier. These tables are also updated at the Data Connection configuration record frequency.
Extending Defender EASM Asset and Insights data, via these two new data connectors, into Azure ecosystem tools like Log Analytics and Data Explorer enables customers to orchestrate the creation of contextualized data views that can be operationalized into existing workflows and provides the facility and toolsets for analysts to investigate and develop new methods of applicative Attack Surface Management.
This article is contributed. See the original author and article here.
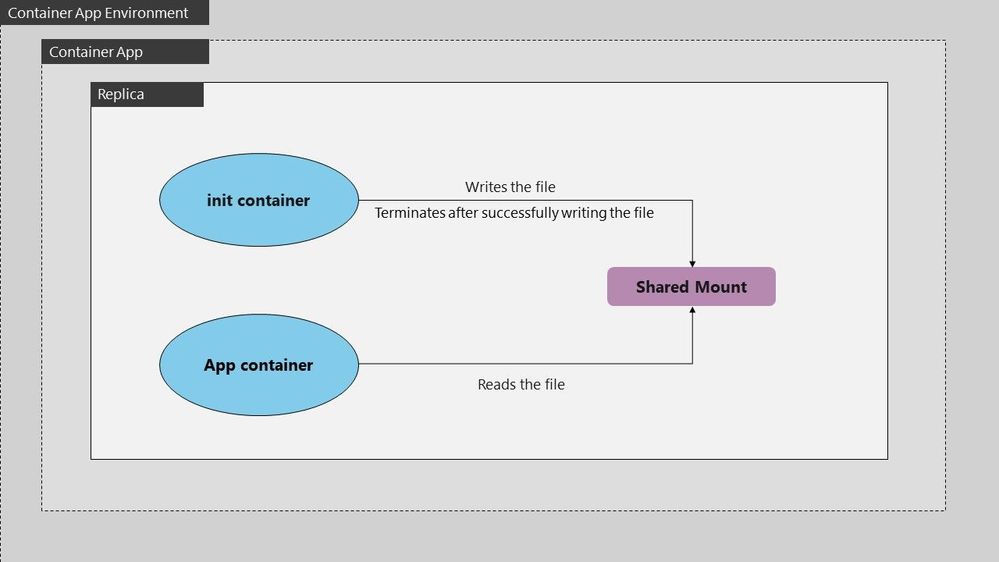
In some scenarios, you might need to preprocess files before they’re used by your application. For instance, you’re deploying a machine learning model that relies on precomputed data files. An Init Container can download, extract, or preprocess these files, ensuring they are ready for the main application container. This approach simplifies the deployment process and ensures that your application always has access to the required data.
The below example defines a simple Pod that has an init container which downloads a file from some resource to a file share which is shared between the init and main app container. The main app container is running a php-apache image and serves the landing page using the index.php file downloaded into the shared file space.
The init container mounts the shared volume at /mydir , and the main application container mounts the shared volume at /var/www/html. The init container runs the following command to download the file and then terminates: wget -O /mydir/index.phphttp://info.cern.ch.
This article is contributed. See the original author and article here.
We got a new issue when our customer found provisioning aSync Group named ‘XXX’ failed with error: Database re-provisioning failed with the exception ‘SqlException ID: XX-900f-42a5-9852-XXX, Error Code: -2146232060 – SqlError Number:229, Message: SQL error with code 229.’. Following I would like to share some details what is the error and the solution to fix it.
Let’s break this down:
Sync Group Issue: The Sync Group ‘XXX’ is experiencing a problem.
Database re-provisioning failed: The attempt to reset or reprovision the database in this group failed.
SqlException ID: A unique identifier associated with this particular SQL exception.
Error Code -2146232060: The error code associated with this exception.
SqlError Number 229: This points to the error number from the SQL Server. In SQL Server, error 229 is related to a “Permission Denied” error.
Root Cause
The SqlError Number 229, “Permission Denied,” is the most telling part of the error message. It means that the process trying to perform the action doesn’t have adequate permissions to carry out its task.
In the context of Sync Groups, several operations occur behind the scenes to ensure data is kept consistent across all nodes. These operations include accessing metadata tables, system-created tracking tables, and executing certain stored procedures. If any part of this chain lacks the necessary permissions, the entire sync process could fail.
Solution
The error was ultimately resolved by granting SELECT, INSERT, UPDATE, and DELETE permissions on sync metadata and system-created tracking tables. Moreover, EXECUTE permission was granted on stored procedures created by the service.
Here’s a more detailed breakdown:
SELECT, INSERT, UPDATE, and DELETE Permissions: These CRUD (Create, Read, Update, Delete) permissions ensure that all basic operations can be performed on the relevant tables. Without these, data synchronization is impossible, as the system can’t read from the source, update the destination, or handle discrepancies.
EXECUTE Permission on Stored Procedures: Stored procedures are sets of precompiled queries that might be executed during the sync process. Without permission to execute these procedures, the sync process might be hindered.
Conclusion
Errors like the “SqlException ID” are more than just roadblocks; they’re opportunities for us to delve deep into our systems, understand their intricacies, and make them more robust. By understanding permissions and ensuring that all processes have the access they need, we can create a more seamless and error-free synchronization experience. Always remember to regularly audit permissions, especially after updates or system changes, to prevent such issues in the future
If you need more information how DataSync works at database level, enabling SQL Profiler (using, for, example, the plugin of SQL Profiler in Azure Data Studio) for you could see a lot of internal details.
Build, innovate, and HackTogether! It’s time to get started building solutions with AI in the Power Platform! HackTogether is your playground for experimenting with the new Copilot and AI features in the Power Platform. With mentorship from Microsoft experts and access to the latest tech, you will learn how to build solutions in Power Platform by leveraging AI. The possibilities are endless for what you can create… plus you can submit your hack for a chance to win exciting prizes! ?
Power Apps Copilots for building and editing desktop and mobile applications
Power Automate Copilot for creating and editing automations
Power Virtual Agents Copilot and conversation booster for creating intelligent chatbots
Power Pages Copilot for creating business websites
You’ll get a high level overview of what you can do with these Copilots and get live demos of them in action! Please visit here for more details: https://aka.ms/hacktogether/powerplatform-ai
WHO IS IT AIMED AT?
This session is for anyone who likes to get into the weeds building apps and automations and are interesting in learning a skill that can accelerate their career. If you’re interested in how AI can help you build solutions faster and with more intelligence in the Power Platform then this session is for you!
WHY SHOULD MEMBERS ATTEND?
Build, innovate, and HackTogether! It’s time to get started building solutions with AI in the Power Platform! HackTogether is your playground for experimenting with the new Copilot and AI features in the Power Platform. With mentorship from Microsoft experts and access to the latest tech, you will learn how to build solutions in Power Platform by leveraging AI. The possibilities are endless for what you can create… plus you can submit your hack for a chance to win exciting prizes!
To view all the required environment setup, click here: https://aka.ms/hacktogether/powerplatform-ai and setup a Microsoft Developer Account and Power Platform Developer Account. This will give you access to all the services and Licenses you will need to follow along and build your own solution.
This article is contributed. See the original author and article here.
This is a continuation of an earlier blog post on unified environment management options in Power Platform admin center.
Customers of finance and operations apps have historically had two choices for deploying their development workloads: self-hosted as a virtual machine on-premises or hosted on a customer-provided Azure subscription. Both of these models have been available through the Dynamics Lifecycle Services (LCS) admin center and have been heavily used by more than 99% of customers. This speaks to the extensibility requirements that enterprise customers have to enrich the products, creating competitive advantage and tackling unique circumstances.
Over the last couple of years, customers have been increasingly seeking faster and low-code extensibility options to complement their core Dynamics 365 business software. To that end, Microsoft is announcing the public preview of unified, developer environments that IT administrators can deploy directly from Power Platform admin center.
New environment templates in Power Platform
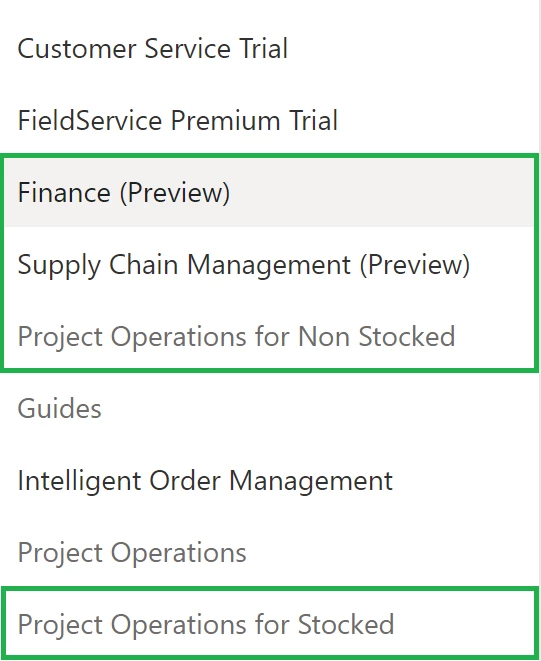
Customers who have purchased Dynamics 365 customer engagement have been able to enjoy a concept in Power Platform known as environment templates, which allow for faster creation of new sandbox environments that include Microsoft Dataverse, their Dynamics 365 application of choice, and several other related apps in a single deployment workflow. Now, finance and operations apps customers will find new templates available to them in Power Platform admin center for Finance (Preview), Supply Chain Management (Preview), and Project Operations for ERP (Preview). This will include Dataverse, the finance and operations core enterprise resource planning (ERP) application, and related apps for dual-write, virtual tables, and business events pre-installed and configured so that they are ready for immediate use.
How to deploy these new templates
If you want to simply try the deployment process for free, you can read about signing up for a no-cost, subscription-based, trial offer. After which, you will see templates such as these when you deploy a new trial environment via Power Platform:
Trial subscriptions are limited to 30 days, and you can only deploy up to 3 trial environments at the same time. During preview, we will not support converting the trial to a sandbox environment. However, this restriction will eventually be removed.
For the unified developer environments, during the preview these are limited to deployment via Power Platform for administrators PowerShell. For more information, see the step-by-step tutorial.
Storage-based provisioning model
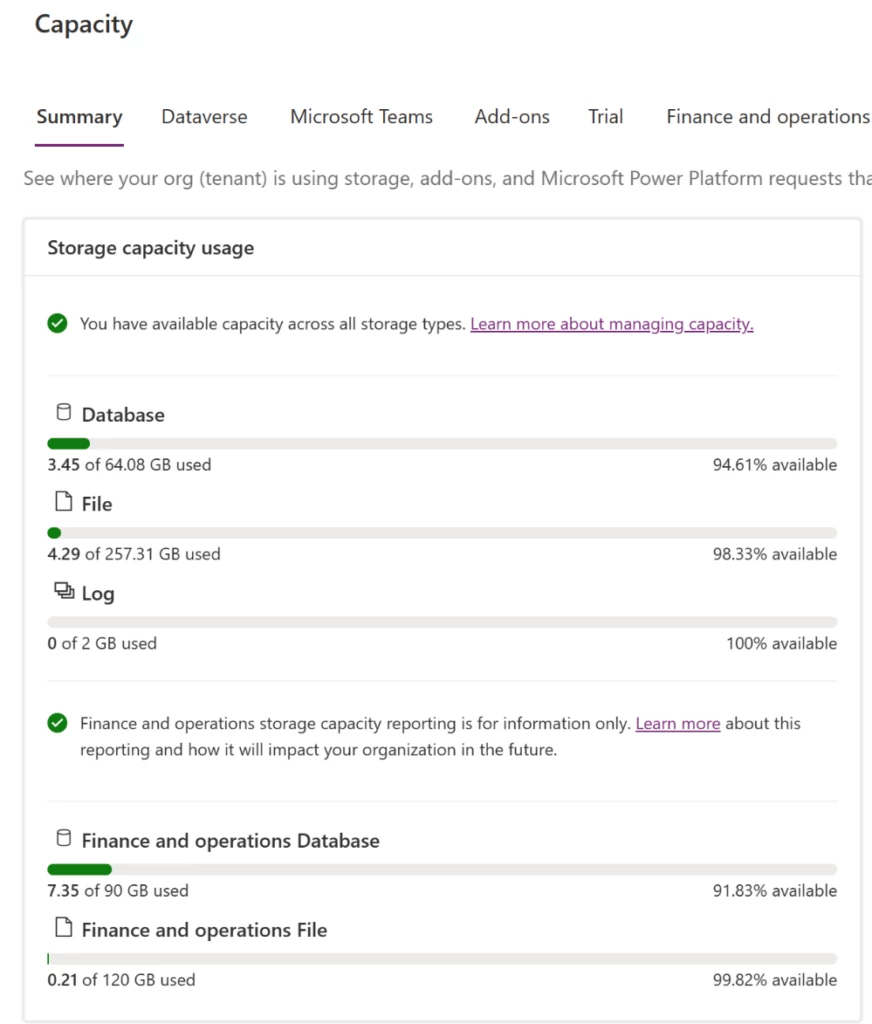
As part of this preview, the new unified, developer environments will utilize the storage-based provisioning model that other Dynamics 365 applications rely upon today. For finance and operations apps customers, they will have two main categories of storage to manage: Dataverse database and Finance and operations database:
Every new environment requires at least 1 gigabyte (GB) of available storage for both Dataverse and Operations database capacity to deploy. Capacity is granted from finance and operations apps user licenses, sandbox add-on purchases, as well as add-on capacity packs. For more information on storage, as it relates to finance and operations apps, see the documentation.
Customers, partners, and ISVs can leverage this storage-based capacity model, and it will not bill to your Azure subscription.
More capabilities for admins and developers
Historically administrators for finance and operations apps have needed to manage time-consuming and complex tasks on behalf of the development teams they support. Such examples include backing up and restoring copies of production data over to the developer VMs hosted on-premises or in Azure, manually deploying new environments and assigning remote desktop credentials to a developer, and managing virtual machine uptime schedules to reduce cost.
Now administrators can:
Deploy environments at scale using admin tools like PowerShell or the Power Platform API.
Copy Lifecycle Services-based production or sandbox environments directly to the new, unified, developer environments both via the new admin center or via admin tools.
Add developers in Dataverse to give them permissions to deploy X++ to the new environment.
Add microservice add-ins to the developer environments such as Planning Optimization, and Export to Data Lake.
Enable customer-managed keys (CMK) for Dataverse and finance and operations apps together.
And more capabilities are coming! For developers, they can enjoy a simpler way of writing and deploying X++ alongside Dataverse solutions. For more information, see the related Unified Developer blog post.
Call to action
Ready to get started? Check out the Unified admin experience for finance and operations apps article to learn about this new way of provisioning developer and trial workloads. If you have any questions or feedback, please join our community in Viva Engage. We look forward to hearing from you!


Recent Comments