This article is contributed. See the original author and article here.
One of the best practices for securing your organization’s data is to follow the principle of least privilege, which means granting users the minimum level of permissions they need to perform their tasks. Microsoft Entra ID helps you apply this principle by offering a wide range of built-in roles as well as allowing you to create custom roles and assign them to users or groups based on their responsibilities and access needs. You can also use Entra ID to review and revoke any role assignments that are no longer needed or appropriate.
It can be easy to lose track of role assignments if admin activities are not carefully audited and monitored. Routine checks of role assignments and generating alerts on new role assignments are one way to track and manage privileged role assignment.
Chances are that when a user with privileged roles is approached, they’ll say they need the role. This may be true; however, many times users will unknowingly say they need those permissions to carry out certain tasks when they could be assigned a role with lower permissions. For example, a user will be able to reset user passwords as a Global Administrator, but that does not mean they can’t do that with another role with far less permissions.
Defining privileged permissions
Privileged permissions in Entra ID can be defined as “permissions that can be used to delegate management of directory resources to other users, modify credentials, authentication or authorization policies, or access restricted data.” Entra ID roles each have a list of permissions defined to them. When an identity is granted the role, the identity also inherits the permissions defined in the role.
It’s important to check the permissions of these roles. The permissions defined in all built-in roles can be found here. For example, there are a few permissions that are different for the Privileged Authentication Administrator role than the Authentication Administrator role, giving the former more permissions in Entra ID. The differences between the authentication roles can be viewed here.
Another example of having differences between similar roles is for the end user administration roles. The differences and nuances between these roles are outlined in detail here.
Auditing activity
To decide if a user really needs a role, it’s crucial to monitor their activities and find the role with the least privilege that allows them to carry out their work. You’ll need Entra ID audit logs for this. Entra ID audit logs can either be sent to a Log Analytics Workspace or connected to a Sentinel instance.
There are two methods that can be used to get the events of carried out by admin accounts. The first will make use of the IdentityInfo table, which is only available in Sentinel after enabling User and Entity Behavior Analytics (UEBA). If you aren’t using UEBA in Sentinel or if you’re querying a Log Analytics Workspace, then you’ll need to use the second method in the next heading.
Using Microsoft Sentinel
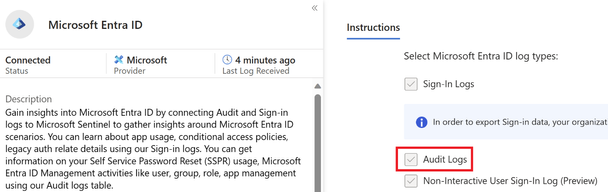
To ingest Entra ID audit logs into Microsoft Sentinel, the Microsoft Entra ID data connector must be enabled, and the Audit Logs must be ticked as seen below.
Figure 1 Entra ID data connector in Sentinel with Audit logs enabled
The IdentityInfo table stores user information gathered by UEBA. Therefore, it also includes the Entra ID roles a user has been assigned. This makes it very simple to get a list of accounts that have been assigned privileged roles.
The query below will give a unique list of activities an account has taken, as well as which roles the account has been assigned:
This will give results for all accounts that carried out tasks in Entra ID and may generate too many operations that were not privileged. To filter for specific Entra ID roles, the following query can be run where the roles are defined in a list. Three roles have been added as examples, but this list can and should be expanded to include more roles:
let PrivilegedRoles = dynamic(["Global Administrator",
                               "Security Administrator",
                               "Compliance Administrator"
                              ]);
AuditLogs
| where TimeGenerated > ago(90d)
| extend ActorName = iif(
                         isnotempty(tostring(InitiatedBy["user"])),
                         tostring(InitiatedBy["user"]["userPrincipalName"]),
                         tostring(InitiatedBy["app"]["displayName"])
                     )
| extend ActorID = iif(
                       isnotempty(tostring(InitiatedBy["user"])),
                       tostring(InitiatedBy["user"]["id"]),
                       tostring(InitiatedBy["app"]["id"])
                   )
| where isnotempty(ActorName)
| join (IdentityInfo
    | where TimeGenerated > ago(7d)
    | where strlen(tostring(AssignedRoles)) > 2
    | summarize arg_max(TimeGenerated, *) by AccountUPN
    | project AccountObjectId, AssignedRoles)
    on $left.ActorID == $right.AccountObjectId
| where AssignedRoles has_any (PrivilegedRoles)
| summarize Operations = make_set(OperationName) by ActorName, ActorID, Identity, tostring(AssignedRoles)
| extend OperationsCount = array_length(Operations)
| project ActorName, AssignedRoles, Operations, OperationsCount, ActorID, Identity
| sort by OperationsCount desc
Once the query is run, the results will give insights into the activities performed in your Entra ID tenant and what roles those accounts have. In the example below, the top two results don’t pose any problems. However, the third row contains a user that has the Global Administrator role and has created a service principal. The permissions needed to create a service principal can be found in roles less privileged than the Global Administrator role. Therefore, this user can be given a less privileged role. To find out which role can be granted, check this list, which contains the least privileged role required to carry out specific tasks in Entra ID.
Figure 2 Actions taken by users in Entra ID
Using Log Analytics Workspace
Figure 3 Configuring the forwarding of Entra ID Audit logs to a Log Analytics Workspace
To ingest Entra ID audit logs into a Log Analytics Workspace follow these steps.
Because there is no table that contains the roles an identity has been granted, you’ll need to add the list of users to the query and filter them. There are multiple ways to get a list of users who have been assigned a specific Entra ID role. A quick way to do this is to go to Entra ID and then select Roles and administrators. From there, select the role and export the identities that have been assigned to it. It’s important to have the User Principal Names (UPNs) of the privileged users. You’ll need to add these UPNs, along with the roles the user has, to the query. Some examples have been given in the query itself. If the user has more than one role, then all roles must be added to the query.
Once you run the query, the results will give insights into the activities performed in your Entra ID tenant by the users you have filtered for. In the example below, the top two results can cause problems. Both have the Global Administrator role, but their operations don’t necessitate to have that role. The permissions needed for these operations can be found in roles less privileged than the Global Administrator role. Therefore, these users can be given a less privileged role. To find out which role can be granted, check this list, which contains the least privileged role required to carry out specific tasks in Entra ID.
Figure 4 Actions taken by users in Entra ID
If this user still requires the Global Administrator role then the Security Administrator role will become redundant as the Global Administrator contains more permissions than the Security Administrator role.
Conclusion
Keeping accounts with privileges that are not required is keeping your attack surface greater than it needs to be. By ingesting Entra ID Audit logs, you can query and identify users who have unnecessary and over-privileged roles. You can then find a suitable alternative role for them.
This article is contributed. See the original author and article here.
Overview
Azure Video Indexer (AVI) offers a comprehensive suite of models that extract diverse insights from the audio, transcript, and visuals of videos. Recognizing the boundless potential of AI models and the unique requirements of different domains, AVI now enables integration of custom models. This enhances video analysis, providing a seamless experience both in the user interface and through API integrations.
The Bring Your Own (BYO) capability enables the process of integrating custom models. Users can provide AVI with the API for calling their model, define the input via an Azure Function, and specify the integration type. Detailed instructions are available here.
Demonstrating this functionality, a specific example involves the automotive industry: Users with numerous car videos can now detect various car types more effectively. Utilizing AVI’s Object Detection insight, particularly the Car class, the system has been expanded to recognize new sub-classes: Jeep and Family Car. This enhancement employs a model developed in Azure AI Vision Studio using Florence, based on a few-shots learning technique. This method, leveraging the foundational Florence Vision model, enables training for new classes with a minimal set of examples – approximately 15 images per class.
The BYO capability in AVI allows users to efficiently and accurately generate new insights by building on and expanding existing insights such as object detection and tracking. Instead of starting from scratch, users can begin with a well-established list of cars that have already been detected and tracked along the video, each with a representative image. Users can then use only numerous requests for the new Florence-based model to differentiate between the cars according to their model.
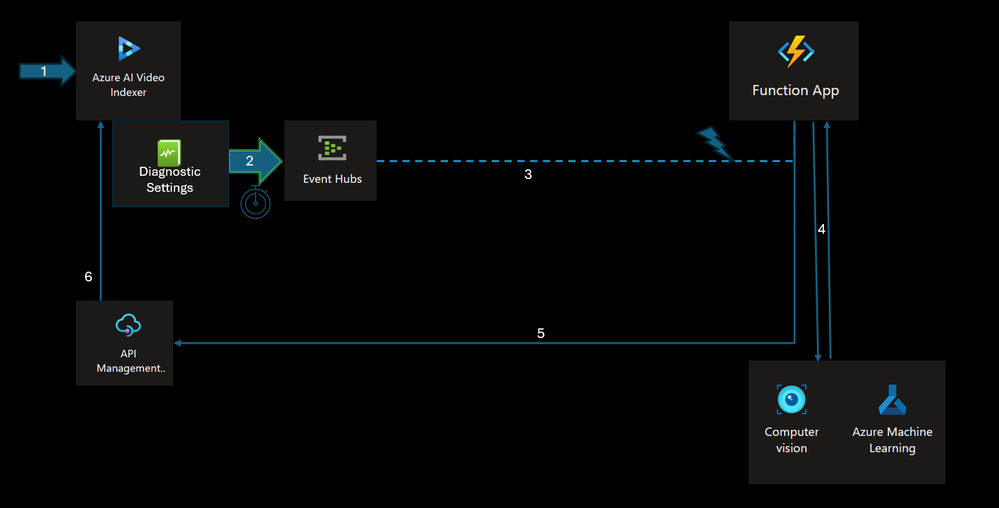
To demonstrate the usage of building customized AI pipeline, we will be using the following pipeline that leverages several key aspects of Video Indexer components and integrations:
1. Users employ their existing Azure Video Indexer account on Azure to index a video, either through the Azure Video Indexer Portal or the Azure Video Indexer API.
2. The Video Indexer account integrates with a Log Analytics workspace, enabling the publication of Audit and Events Data into a selected stream. For additional details on video index collection options, refer to: Monitor Azure Video Indexer | Microsoft Learn.
3. Indexing operation events (such as “Video Uploaded,” “Video Indexed,” and “Video Re-Indexed”) are streamed to Azure Event Hubs. Azure Event Hubs enhances the reliability and persistence of event processing and supports multiple consumers through “Consumer Groups.”
4. A dedicated Azure Function, created within the customer’s Azure Subscription, activates upon receiving events from the EventHub. This function specifically waits for the “Indexing-Complete” event to process video frames based on criteria like object detection, cropped images, and insights. The compute layer then forwards selected frames to the custom model via Cognitive Services Vision API and receives the classification results.In this example it sends the crops of the representative image for each tracked car in the video.
Note: The integration process involves strategic selection of video frames for analysis, leveraging AVI’s car detection and tracking capabilities, to only process representative cropped images of each tracked car in the custom model.
5. The compute layer (Azure Function) then transmits the aggregated results from the custom model back to the Azure API to update the existing indexing data using the Update Video IndexAPI Call.
6. The enriched insights are subsequently displayed on the Video Indexer Portal. The ID in the custom model matches the ID in the original insights JSON.
Figure 2: New Insight widget in AVI for the custom model results
Note: for more in-depth step-by-step tutorialaccomplished with code sample, please consult the official Azure Video Indexer GitHub Sampleunder the “Bring-Your-Own” Section.
Result Analysis
The outcome is a novel insight displayed in the user interface, revealing the outcomes from the custom model. This application allowed for the detection of a new subclass of objects, enhancing the video with additional, user-specific insights. In the examples provided below, each car is distinctly classified: for instance, the white car is identified as a family car (Figure 3), whereas the red car is categorized as a jeep (Figure 4).
Figure 3: Azure Video Indexer with the new custom insight for the white car classified as family car.
Figure 4: Azure Video Indexer with the new custom insight for the red car classified as family jeep.
Conclusions
With only a handful of API calls to the bespoke model, the system effectively conducts a thorough analysis of every car featured in the video. This method, which involves the selective use of certain images for the custom model combined with insights from AVI, not only reduces expenses but also boosts overall efficiency. It delivers a holistic analysis tool to users, paving the way for endless customization and AI integration opportunities.
This article is contributed. See the original author and article here.
Dapr and Service Meshes are more and more usual suspects in Cloud native architectures. However, I noticed that there is still some confusion about their purpose, especially because of some overlapping features. People sometimes wonder how to choose between Dapr and a Service Mesh or even if both should be enabled at the same time.
The purpose of this post is to highlight the differences, especially on the way they handle mTLS, as well as the impact on the application code itself. You can already find a summary about how Dapr and Service Meshes differ on the Dapr web site but the explanations are not deep enough to really understand the differences. This blog post is an attempt to dive deeper and give you a real clue on what’s going on behind the scenes. Let me first start with what Dapr and Service Meshes have in common.
Things that Dapr and Service Meshes have in common
Secure service-to-service communication with mTLS encryption
Service-to-service metric collection
Service-to-service distributed tracing
Resiliency through retries
Yes, this is the exact same list as the one documented on the Dapr web site! However, I will later focus on the mTLS bits because you might think that these are equivalent, overlapping features but the way Dapr and Service Meshes enforce mTLS is not the same. I’ll show some concrete examples with Dapr and the Linkerd Service Mesh to illustrate the use cases.
On top of the above list, I’d add:
They both leverage the sidecar pattern, although the Istio Service Mesh is exploring the Ambient Mesh, which is sidecar free, but the sidecar approach is still mainstream today. Here again, the role of the sidecars and what happens during the injection is completely different between Dapr and Service Meshes.
They both allow you to define fine-grained authorization policies
They both help deal with distributed architectures
Before diving into the meat of it, let us see how they totally differ.
Differences between Dapr and Service Meshes
Applications are Mesh-agnostic, while they must explicitly be Dapr-aware to leverage the Dapr capabilities. Dapr infuses the application code. Being Dapr-aware does not mean that you must use a specific SDK. Every programming language that has an HTTP client and/or gRPC client can benefit from the great Dapr features. However, the application must comply to some Dapr pre-requisites, as it must expose an API to initialize Dapr’s app channel.
Meshes can deal with both layer-4 (TCP) and layer-7 traffic, while Dapr is focused on layer-7 only protocols such as HTTP, gRPC, AMQP, etc.
Meshes serve infrastructure purposes while Dapr serves application purposes
Meshes typically have smart load balancing algorithms
Meshes typically let you define dynamic routes across multiple versions of a given web site/API
Some meshes ship with extra OAuth validation features
Some meshes let you stress your applications through Chaos Engineering techniques, by injecting faults, artificial latency, etc.
Meshes typically incur a steep learning curve while Dapr is much smoother to learn. On the contrary, Dapr even eases the development of distributed architectures.
Dapr provides trueservice discovery, not meshes
Dapr is designed from the ground up to deal with distributed and microservice architectures, while meshes can help with anyarchitecture style, but prove to be a good ally for microservices.
Demo material
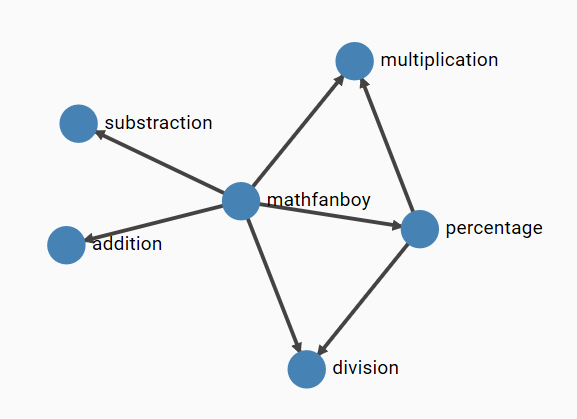
I will reuse one demo app that I developed 4 years ago (time flies), which is a Linkerd Calculator. The below figure illustrates it:
Some services talking together. MathFanBoy, a console app randomly talking to the arithmetic operations, while the percentage operation also calls multiplication and division. The goal of this app was to generate traffic and show how Linkerd helped us see in near real time what’s going on. I also purposely introduced exceptions by performing divisions by zero…to also demo how Linkerd (or any other mesh) helps spot errors. Feel free to clone the repo and try it out on your end if you want to test what is later described in this post. I have now created the exact same app, using Dapr, which is made available here. Let us now dive into the technical details.
Diving into the technical differences
Invisible to the application code vs code awareness
As stated earlier, an application is agnostic to the fact that it is injected or not by a Service Mesh. If you look at the applicationcode of the Linkerd Calculator, you won’t find anything related to Linkerd. The magic happens at deployment time where we annotate our K8s deployment to make sure the application gets injected by the Mesh. On the other hand, the application code of the Dapr calculator is directly impacted in multiple ways:
– While I could use a mere .NET Console App for the Linkerd Calculator, I had to turn MathFanBoy into a web host, to comply with the Dapr app initialization channel. However, because MathFanBoy generates activity by calling random operations, I could not just turn it as an API, so I had to run different tasks in parallel. Here are the most important bits:
class Program
{
static string[] endpoints = null;
static string[] apis = new string[5] { "addition", "division", "multiplication", "substraction", "percentage" };
static string[] operations = new string[5] { "addition/add", "division/divide", "multiplication/multiply", "substraction/substract", "percentage/percentage" };
static async Task Main(string[] args)
{
var host = CreateHostBuilder(args).Build();
var runHostTask = host.RunAsync();
var loopTask = Task.Run(async () =>
{
while (true)
{
var pos = new Random().Next(0, 5);
using var client = new DaprClientBuilder().Build();
var operation = new Operation { op1 = 10, op2 = 2 };
try
{
var response = await client.InvokeMethodAsync
Lines 9 and 10 create the web host. Between lines 13 and 35, I generate random calls to the operations, but here again we have another difference as the application is using the Dapr Client’s InvokeMethodAsync to perform the calls. As you might have noticed, the application does not need to know the URL of these services. Dapr will discover where the services are located, thanks to its Service Discovery feature. The only thing we need to provide is the App ID and the operation that we want to call. With the Linkerd calculator, I had to know the endpoints of the target services, so they were injected through environment variables during the deployment. The same principles apply to the percentage operation, which is a true API. I had to inject the Dapr client through Dependency Injection:
public void ConfigureServices(IServiceCollection services)
        {
            services.AddControllers().AddDapr();
        }
In order to to get an instance through the controller’s constructor:
and use that instance to call the division and multiplication operations from within another controller operation, using again the Invoke method as for MathFanBoy. As you can see, the application code is explicitly using Dapr and must comply to some Dapr requirements. Dapr has many features other than Service Discovery but I’ll stick to that since the point is made that a Dapr-injected Application must be Dapr-aware while it is completely agnostic of a Service Mesh.
mTLS
Now things will get a bit more complicated. While both Service Meshes and Dapr implement mTLS as well as fine-grained authorization policies based on the client certificate presented by the caller to the callee, the level of protection of Dapr-injected services is not quite the same as the one from Mesh-injected services.
Roughly, you might think that you end up with something like this:
A very comparable way of working between Dapr and Linkerd. This is correct but only to some extents. If we take the happy path, meaning every pod is injected by Linkerd or Dapr, we should end up in the above situation. However, in a K8s cluster, not every pod is injected by Dapr nor Linkerd. The typical reason why you enable mTLS is to make sure injected services are protected from the outside world. By outside world, I mean anything that is not either Dapr-injected, either Mesh-injected. However, with Dapr, nothing prevents the following situation:
The blue path is taking the Dapr route and is both encrypted and authenticated using mTLS. However, the green paths from both a Dapr-injected pod and a non-Dapr pod still goes through in plain text and anonymously. How come is that possible?
For the blue path, the application is going through the Dapr route ==> http://localhost:3500/ this is the port that the Daprd sidecar listens to. In that case, the sidecar will find out the location of the target and will talk to the target service’s sidecar. However, because Dapr does not intercept network calls, nothing prevents you from taking a direct route, from both a Dapr-injected pod and a non-Dapr one (green paths). So, you might end up in a situation where you enforce a strict authorization policy as shown below:
where you only allow MathFanBoy and Percentage to call the multiplication operation, and yet have other pods bypass the Dapr sidecar, which ultimately defeats the policy itself. Make no mistake, the reason why we define such policies is to enforce a certain behavior and I don’t have peace of mind if I know that other routes are still possible.
So, in summary, Dapr’s mTLS and policies are only effective if you take the Dapr route but nothing prevents you from taking another route.
Let us see how this works with Linkerd. As stated on their web site, Linkerd also does not enforce mTLS by default and has added this to their backlog. However, with Linkerd (same and even easier with Istio), we can make sure that only authorized services can talk to meshed ones. So, with Linkerd, we would not end up in the same situation:
First thing to notice, we simply use the service name to contact our target because there is no such Dapr route in this case nor any service discovery feature. However, because Linkerd leverages the Ambassador pattern, which intercepts all network calls coming in and going outside of a pod. Therefore, when the application container of a Linkerd-injected pod tries to connect to another service, Linkerd’s sidecar performs the call to the target, which lands onto the other sidecar (if the target is well a Linkerd-injected service of course). In this case no issue. Of course, as for Dapr, nothing prevents us from directly calling the pod IP of the target. Yet, from an injected pod, the Linkerd sidecar will intercept that call. From a non-injected pod, there is no such outbound sidecar, but our target’s sidecar will still tackle inbound calls, so you can’t bypass it. By default, because Linkerd does not enforce mTLS, it will let it go, unless you define fine-grained authorizations as shown below:
In this case, only MathFanBoy and and Percentage will be allowed to call the multiplication operation. In other words, Linkerd allows us to enforce mTLS, whatever route is taken. With Istio, it’s even easier since you can simply enforce mTLS through the global mesh config. You do not even need to specify explicit authorization policies (although it is a best practice). Just to illustrate the above diagrams, here are some screenshots showing these routes in action:
I’m first calling the multiplication operation from the addition pod, while we told Dapr that only MathFanboy and Percentage could call multiplication. As you can see, the Dapr policy kicks in and forbids the call as expected.
but while this policy is defined, I can still call the multiplication using a direct route (pod IP):
and the same applies to non-injected pods of course.
While, with the Linkerd policy in place, there will be no way to call multiplication other than from MathFanBoy and Percentage. For sake of brevity, I won’t show you the screenshots but trust me, you will be blocked if you try.
Let us now focus on the injection process which will clarify what is going on behind the scenes.
Injection process Dapr vs Service Mesh
Both Dapr and Service Meshes will inject application pods according to annotations. They both have controllers in charge of injecting their victims. However, when looking at the lifecycle of a Dapr-injected pod as well as a Linkerd-injected pod, we can see noticeable differences.
When injecting Linkerd to an application, in plain Kubenet (not using the CNI plugin), we notice that Linkerd injects not only the sidecar but also an Init Container:
When looking more closely at the init container, we can see that it requires a few capabilities such as NET_ADMIN and NET_RAW, and that is because the init container will rewrite IP tables to make sure network traffic entering and leaving the pod is captured by Linkerd’s sidecar. When using Linkerd together with a CNI, the same principle applies but route tables are not rewritten by the init container. No matter how you use Linkerd, all traffic is redirected to its sidecar. This means that the sidecar cannotbe bypassed.
When injecting Dapr, we see that there is no Init Container and only the daprd container (sidecar) is injected:
There is no rewrite of any IP table, meaning that the sidecar can be bypassed without any problem, thus bypass Dapr routes and Dapr policies. In other words, we can easily escape the Dapr world.
Wrapping up
As stated initially, I mostly focused on the impact of Dapr or a Service Mesh on the application itself and how the overall protection given by mTLS varies according to whether you use Dapr or a Service Mesh. I hope it is clear by now that Dapr is definitely an application framework that infuses the application code, while a Service Mesh is completely transparent for the application. Note that the latter is only true when using a decent Service Mesh. By decent, I mean something stable, performant and reliable. I have been recently confronted to a Mesh that I will not name here, but this was a true nightmare for the application and it kept breaking it.
Although Dapr & Service Meshes seem to have overlapping features, they are not equally covering the workloads. With regards to the initial question about when to use Dapr or a Service Mesh, I would take the following elements into account:
– For distributed architectures that are also heavily event-driven, Dapr is a no brainer because Dapr brings many features on the table to interact with message and event brokers, as well as state stores. Yet, Service Meshes could still help measure performance, spot issues and load balance traffic by understanding protocols such as HTTP/2, gRPC, etc. Meshes would also help in the release process of the different services, splitting traffic across versions, etc.
– For heterogeneous workloads, with a mix of APIs, self-hosted databases, self-hosted message brokers (such as Rabbit MQ), etc., I would go for Service Meshes.
– If the trigger of choosing a solution is more security-centric, I would go for a Service Mesh
– If you need to satisfy all of the above, I would combine Dapr and a Service Mesh for microservices, while using Service Mesh only for the other types of workloads. However, when combining, you must consider the following aspects:
– Disable Dapr’s mTLS and let the Service Mesh manage this, including fine-grained authorization policies. Beware that doing so, you would loose some Dapr functionality such as defining ACLs on the components
– Evaluate the impact on the overall performance as you would have two sidecars instead of one. From that perspective, I would not mix Istio & Dapr together, unless Istio’s performance dramatically improves over time.
– Evaluate the impact on the running costs because each sidecar will consume a certain amount of CPU and memory, which you will have to pay for.
– Assess whether your Mesh goes well with Dapr. While an application is agnostic to a mesh, Dapr is not, because Dapr also manipulates K8s objects such as K8s services, ports, etc. There might be conflicts between what the mesh is doing and what Dapr is doing. I have seen Dapr and Linkerd be used together without any issues, but I’ve also seen some Istio features being broken because of Dapr naming its ports dapr-http instead of http. I reported this problem to the Dapr team 2 years ago but they didn’t change anything.
This article is contributed. See the original author and article here.
A well-orchestrated workforce is the backbone of any successful customer service endeavor. This requires a systematic and holistic approach to Workforce Management (WFM), taking into account the diverse needs of customers, the fluctuating demands of the market, and the ever-changing nature of business operations.
WFM holds together the intricate machinery of customer support, ensuring operational efficiency and exceptional customer experiences. In a dynamic environment, where seamless interactions are critical, workforce management goes beyond the simple task of staffing and extends to the strategic alignment of resources, skills, and time.
Businesses choose a workforce management solution based on their unique challenges, such as compliance with labor laws. Microsoft understands that customer scenarios vary, and hence offers an open approach to incorporating the right WFM solutions. This gives customers unparalleled flexibility and efficiency in managing their workforce when using Dynamics 365 Customer Service.
WFM adapter from TTEC Digital for Dynamics 365 Customer Service
As a first step, Microsoft has partnered with TTEC Digital to offer an enhanced adapter that connects Dynamics 365 Customer Service with four leading WFM providers: Calabrio, Verint, NICE and Alvaria. The adapter is bidirectional, enabling seamless data transfer between the systems. It offers features such as real-time adherence reporting and historical reporting. Users can forecast demand on supported channels, namely inbound voice, SMS, email, chat and digital messaging, and staff accordingly.
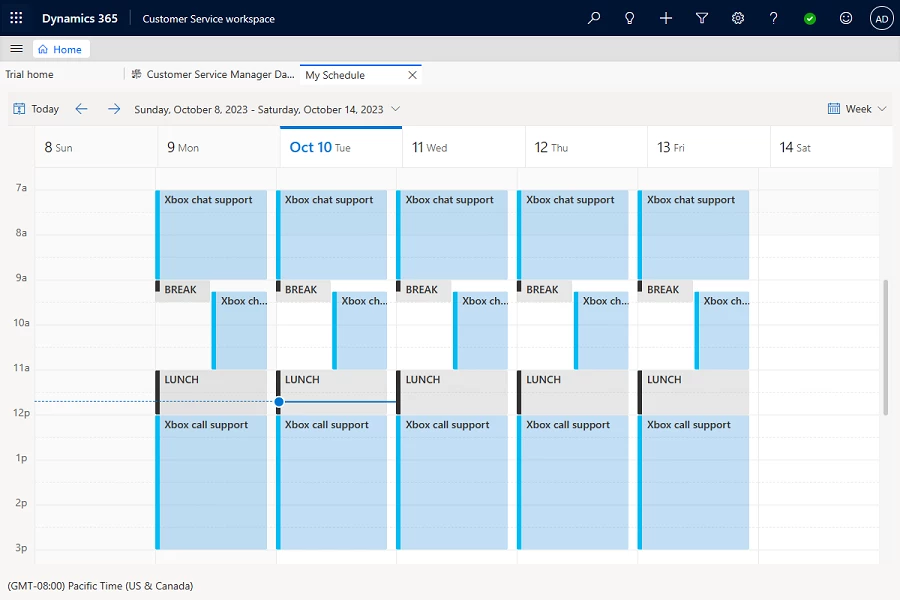
With the enhanced adapter, organizations can use the schedule sync feature to seamlessly import schedules created in the WFM system directly into the agent calendar in Dynamics 365 Customer Service. This functionality empowers agents to conveniently review their daily schedules including breaks, training sessions, and other activities directly in Dynamics 365 Customer Service, eliminating the need to navigate to an external WFM system. This not only boosts individual performance but also contributes to overall team efficiency.
Currently, Schedule Sync is supported when using the adapter with Calabrio’s WFM system. Microsoft plans to expand support for other WFM providers.
Connect any third-party WFM with Dynamics 365 Customer Service
The extensible nature of the Dynamics 365 platform gives organizations a publicly consumable Dataverse API. It offers maximum flexibility and customization for connecting WFM solutions with Dynamics 365 Customer Service.
For a detailed understanding including design architecture, entity details, and API specifications, please refer to this guide. Sample codes are available in the GitHub repository to expedite your journey.
What’s next
Microsoft is committed to an open and flexible approach to bringing more WFM adapters to Microsoft AppSource and enhancing the existing adapter from TTEC. Microsoft expects to offer continued API enhancements to support any third-party WFM connections.
Dynamics 365 Customer Service offers a native forecasting capability, currently in public preview. The feature empowers customers to predict both volume and demand for contact centers. We plan to enhance and expand on this capability with additional advancements, providing customers with more powerful tools for forecasting.
Stay tuned as Dynamics 365 Customer Service continues to evolve and deliver cutting-edge capabilities in WFM that anticipate and meet the ever-changing demands of the modern business landscape. Your journey to enhanced workforce management with Dynamics 365 Customer Service has just begun.
This article is contributed. See the original author and article here.
We’re excited to announce that Forms now supports practice mode, enhancing students’ learning process by offering a new way to review, test, and reinforce their knowledge. Practice mode is only available for quizzes. You can also try out practice mode from this template.
Practice mode
Instant feedback after answering each question In practice mode, questions will be displayed one at a time. Students will promptly receive feedback after answering each question, indicating whether their answer is right or wrong.
Instant feedback after answering each question
Try multiple times for the correct answer If students provide an incorrect answer, they will be given the opportunity to reconsider and make another attempt until they arrive at the correct one, allowing for immediate re-learning, and consequently strengthening their grasp of specific knowledge.
Try multiple times to get the correct answer
Encouragement and autonomy during practice Whether students answer a question correctly or not, they will receive an encouraging message, giving them a positive practice experience. And they have the autonomy to learn at their own pace. If they answer a question incorrectly, they can choose to retry, view the correct answer, or skip this question.
Encouragement message and other options
Recap questions Once students finish the practice, they can recap all the questions, along with the correct answers, providing a comprehensive overview to help gauge their overall performance.
Recap questions
Enter practice mode Practice mode is only available for quizzes. You can turn it on in the “…” icon in the upper-right corner. Once you distribute the quiz recipients will automatically enter practice mode. Try out practice mode from this template now!


Recent Comments