by Contributed | Nov 27, 2021 | Technology
This article is contributed. See the original author and article here.
Before implementing data extraction from SAP systems please always verify your licensing agreement. |
Welcome to the third episode of this mini blog series, where I show you how to deal with OData extraction from the SAP system using Synapse Pipelines. In the first episode, we’ve built a simple pipeline that extracts data from a selected OData service and saves it to the data lake. Then, a week later, we enhanced the design to support parameters, which eliminated some of the hardcoded values. It allows us to change the OData service we want to use without modifying the pipeline or resources.
It was a great improvement, but the process still has two main disadvantages. The extraction job can only extract a single OData service at a time, and we still have to provide parameter values manually. If we want to extract data from many services, we have to start the pipeline multiple times, each time providing the OData service name, entity and host. Not the most effective approach.
But what if we could provide all OData services upfront in an external datastore? That’s the plan for today. Let’s further enhance our pipeline and make it even more agile!
THE METADATA STORE
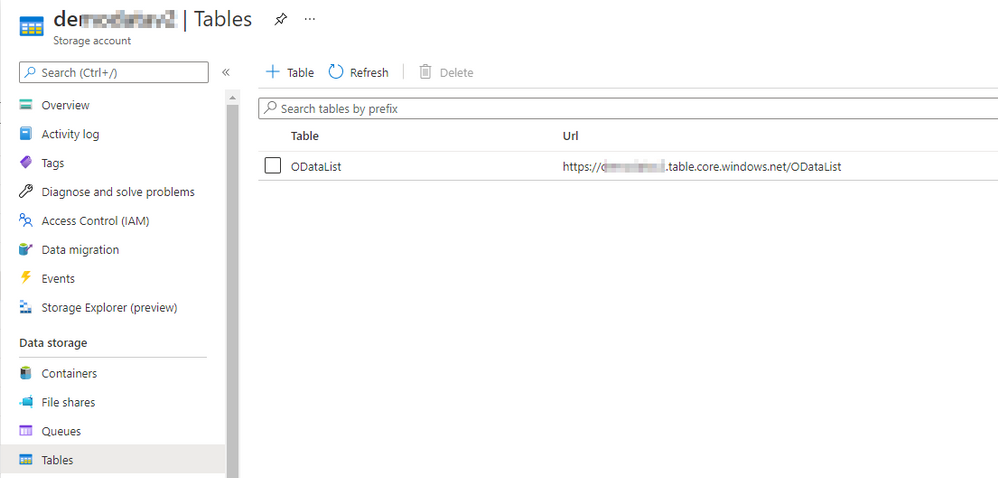
To store information about OData services, we need a service, that is easy to provision and maintain. We could use a SQL database, which meets many of our goals, but it is quite a heavy service. Instead, use Azure Table Storage which seems to offer exactly the functionality we need. It can be part of the same storage account that we use for data lake, it’s simple to deploy, and it doesn’t require any maintenance. And, as we store small amounts of data, the cost will be minimal.
To create a Table in Azure Storage, open the Storage Account blade in Azure Portal and choose Tables from the menu. Click the plus button, provide the table name and click OK to confirm. That couldn’t be more straightforward.
You can use Storage Explorer to add entries to the table. Select the table that you’ve just created and click the plus button to add an entry. By default, each Azure Table has two properties: PartitionKey and RowID, that together form the primary key. You can add more properties if needed. In the PartitionKey I store the OData service name and the RowID keeps the Entity name. In the pipeline, we’ve defined three parameters so we have to create an additional property for the Host information.
I add two previously used OData services to the table.

The metadata table is now ready!
READING METADATA FROM THE PIPELINE
To access the metadata table from the pipeline we have to create resources in Synapse Studio. There is a dedicated connector that allows us to consume data from Azure Table. Create the Linked Service and a dataset as we did in previously in this series.

To read the metadata table, we will create another pipeline that will fetch information about OData services to process and then, one by one, it will trigger the child pipeline responsible for the extraction. The child pipeline is the one that we’ve been working on during previous episodes.
Create a new pipeline and add the Lookup activity. On the Settings tab, choose the dataset associated with the Azure Table. Uncheck the option First Row only as we want to read all data from the table.

The Lookup activity reads all records from the table and exposes them as an array in the pipeline, which we can pass to subsequent activities. Each OData defined in the table should trigger the child pipeline. To achieve that, we will use the ForEach loop that goes through the array, and each record starts the pipeline that we’ve created in previous episodes.
Add ForEach loop to the pipeline. Connect the Lookup activity with the loop. Open the Settings tab and provide the following expression in the Items field to pass the array to the ForEach loop.
@activity('l_metadata').output.value

Great! The ForEach loop iterates through all elements of the array. Click on the small pencil button to define actions contained in the loop. On the new screen, add the Execute Pipeline activity and select the pipeline with the Copy Data process that we’ve created in previous episodes. You’ll notice three input boxes that correspond to the pipeline parameters. We will use them to pass information from the metadata table about the current OData service to process. Referencing items from the loop is quite simple:
URL: @item().Host
ODataService: @item().PartitionKey
Entity: @item().RowKey

Each record stored in the metadata table will trigger the pipeline with Copy Data activity. Values stored in the table are passed to the child pipeline as parameters. Using the external metadata store allows maintaining the list of OData services independently of the pipeline. To add a new record, we don’t have to launch Synapse Studio. It’s enough to add an entry to the table.
EXECUTION AND MONITORING
There is one important setting in the ForEach loop, that I haven’t mentioned earlier. You can decide to run the loop sequentially, or in parallel, which is the default behavior. This setting has a significant influence on job performance. Triggering multiple parallel extraction processes can decrease the overall time required to extract data, but at the same time, it increases the load on the application server. As long as we’re working with one or two OData services it should not cause any troubles. But if you plan to run the extraction on a larger scale, I’d recommend defining the maximum number of concurrent jobs in the Batch Count field.
We’ve created two entries in the metadata table – one for the sales order and one for the business partner.

You can immediately spot the difference. This time we can see three pipelines executed instead of one! One for the parent pipeline that read values from the Azure Table, and then triggered two child pipelines that run the extraction. The number of child pipelines is directly related to the number of OData services defined in the metadata table.
Adding a new OData service doesn’t require any changes in the Synapse Studio. Instead, you can define it directly in the Azure Table Storage. Whenever you run the extraction, the job automatically picks up all entries and process them in parallel.
So far, I haven’t explained how to deal with large data volumes. My test system contains only a couple hundred sales orders. In real life, you probably have to deal with millions of records, which can cause serious troubles. In the next episode, I’ll focus on extracting a large amount of data – it’s easier than you think!
by Contributed | Nov 26, 2021 | Technology
This article is contributed. See the original author and article here.
Microsoft 365 Patterns and Practices (PnP) Community November 2021 update is out with a summary of the latest guidance, samples, and solutions from Microsoft or from the community for the community. This article is a summary of all the different areas and topics around the community work we do around Microsoft 365 ecosystem during the past month. Thank you for being part of this success.
Sharing is caring! ?
What is Microsoft 365 Community (PnP)
Microsoft 365 PnP is a nick-name for Microsoft 365 platform community activities coordinated by numerous teams inside of the Microsoft 365 engineering organizations. PnP is a community-driven open source initiative where Microsoft and external community members are sharing their learning’s around implementation practices for Microsoft 365.
Topics vary from Microsoft Viva, Microsoft Graph, Microsoft Teams, Power Platform, OneDrive and SharePoint. Active development and contributions happen in GitHub by providing contributions to the samples, reusable components, and documentation for different areas. PnP is owned and coordinated by Microsoft engineering, but this is work done by the community for the community.
The initiative is facilitated by Microsoft, but we have multiple community members as part of the PnP team (see team details in end of the article) and we are always looking to extend the PnP team with more community members. Notice that since this is open source community initiative, so there’s no SLAs for the support for the samples provided through GitHub. Obviously, all officially released components and libraries are under official support from Microsoft.
Main resources around Microsoft 365 Community:
✍ Latest Dev Blog posts
Here are the latest blog posts and announcements around Microsoft 365 development topics from https://developer.microsoft.com/en-us/microsoft-365/blogs.
Latest community posts at https://aka.ms/m365pnp/community/blog
Community call recording blog posts:
- 18th of November – Viva Connections & SharePoint Framework Community Call – 18th of November, 2021
- 16th of November – Microsoft 365 Platform Call – 16th of November, 2021
- 11th of November – Microsoft 365 Developer Community Call recording – 11th of November, 2021
- 10th of November – Adaptive Cards community call – October 2021
- 10th of November – Microsoft 365 Platform Call – 9th of November, 2021
- 5th of November – Microsoft 365 Platform Call – 2nd of November, 2021 – Microsoft Ignite 2021 watch party
- 4th of November – SharePoint Framework Community Call – 4th of November, 2021 – Microsoft Tech Community
- 28th of October – Microsoft 365 Developer Community Call recording – 28th of October, 2021
- 26th of October – Microsoft 365 Platform Call – 26th of October, 2021
- 25th of October – Power Apps Community Call – October 2021
- 22nd of October – Office Add-ins community call – October 13, 2021
- 21st of October – SharePoint Framework Community Call – 21st of October, 2021
Microsoft 365 Developer Podcasts
Microsoft 365 PnP Weekly Podcasts and vlogs
Community Calls
There are numerous different community calls on different areas. All calls are being recorded and published either from Microsoft 365 Developer or Microsoft 365 Community (PnP) YouTube channels. Recordings are typically released within the following 24 hours after the call. You can find a detailed agenda and links to specific covered topics on blog post articles at the Microsoft 365 developer blog when the videos are published.
- Microsoft 365 Platform Call – https://aka.ms/m365-dev-call – Updates and demos from Microsoft as weekly call on Tuesdays – topics vary from Microsoft Teams, Microsoft Graph, Power Platform, SharePoint, OneDrive and more
- Adaptive Cards https://aka.ms/adaptivecardscommunitycall – Updates and news around Adaptive Cards with live demos
- Microsoft identity platform https://aka.ms/IDDevCommunityCalendar – Latest on the identity side
- Office Add-ins https://aka.ms/officeaddinscommunitycall – News and community work around Office add-ins with live demos
- PowerApps https://aka.ms/PowerAppsMonthlyCall – Monthly summary on PowerApps community with live demos
- M365 Community Call https://aka.ms/spdev-sig-call – Bi-weekly – General topics on Microsoft 365 Dev from various aspects – Microsoft Teams, Microsoft Graph Toolkit, Provisioning, Automation, Scripting, Power Automate, Solution design
- SharePoint Framework Community call https://aka.ms/spdev-spfx-call – Bi-weekly – Consists of topics around SharePoint Framework and JavaScript-based development in the Microsoft Teams and in SharePoint platform.
If you are interested in doing a live demo of your solution or sample in these calls, please do reach out to the PnP Team members (contacts later in this post) and they are able to help with the right setup. These are great opportunities to gain visibility for example for existing MVPs, for community members who would like to be MVPs in the future or any community member who’d like to share some of their learnings.
Microsoft 365 Community (PnP) Ecosystem in GitHub
Most of the community driven repositories are in the PnP GitHub organization as samples are not product specifics as they can contain numerous different solutions or the solution works in multiple different applications.
- Microsoft Graph Toolkit – Repository and project on Microsoft Graph Toolkit controls – welcomes community contributors
- PnPjs – PnPjs Framework repository
- CLI Microsoft 365 – Cross-OS command line interface to manage Office 365 tenant settings
- generator-spfx – Open-source Yeoman generator which extends the out-of-the-box Yeoman generator for SharePoint with additional capabilities
- generator-teams – Open-source Microsoft Teams Yeoman generator – Bots, Messaging Extensions, Tabs, Connectors, Outgoing Web hooks and more
- teams-dev-samples – Microsoft Teams targeted samples from community and Microsoft engineering
- script-samples – Scripting samples for automating operations in Microsoft 365 with PowerShell modules or CLIs
- Sharing is Caring – Getting started on learning how to contribute and be active on the community from GitHub perspective.
- pnpcore – The PnP Core SDK is an SDK designed to work against Microsoft 365 with Microsoft Graph API first approach
- powershell – PnP PowerShell module which is PowerShell Core module targeted for Microsoft 365
- pnpframework – PnP Framework is a .Net Standard 2.0 library targeting Microsoft 365 containing the PnP Provisioning engine and a ton of other useful extensions
- spfx-reference-scenarios – Samples for the Microsoft Teams and Viva Connections, implemented using SharePoint Framework
- sp-dev-fx-aces – Samples on the Adaptive Card Extensions for Microsoft Viva
- sp-dev-fx-webparts – Client-side web part samples from community and Microsoft engineering
- sp-dev-fx-extensions – Samples and tutorial code around SharePoint Framework Extensions
- sp-dev-fx-library-components – Samples and tutorial code around the SharePoint Framework library components
- sp-starter-kit – Starter kit solution for SharePoint modern experiences
- sp-dev-build-extensions – Different build extensions like gulp tasks and gulp plugins from the community and engineering around SharePoint development
- sp-dev-solutions – Repository for more polished and fine-tuned reusable solutions build with SharePoint Framework
- sp-dev-samples – Repository for other samples related on the SharePoint development topics – WebHooks etc.
- sp-dev-fx-controls-react – Reusable content controls for SharePoint Framework solutions build with React
- sp-dev-fx-property-controls – Reusable property pane controls to be used in web parts
- list-formatting – Open-source community-driven repository for the column and view formatting JSON definitions
- sp-dev-site-scripts – Open-source community-driven repository for community Site Designs and Site Scripts
- sp-dev-modernization – Tooling and guidance around modernizing SharePoint from classic to modern
- sp-power-platform-solutions – Solution and sample code for SharePoint Power Platform solutions
- powerfx-samples – Samples that demonstrate different usage patterns for the Power Fx low-code programming language
- powerapps-samples – Samples that demonstrate different usage patterns for Power Apps
- powerautomate-samples – Samples that demonstrate different usage patterns for Power Automate
- powerva-samples – Samples that demonstrate different usage patterns for Power Virtual Agents
All SharePoint specific repositories or services supported directly by Microsoft are located in the SharePoint GitHub organization
Classic PnP named repositories – older tooling
- PnP-Tools – Tools and scripts targeted more for IT Pro’s and for on-premises for SP2013 and SP2016
- PnP-Provisioning-Schema – PnP Provisioning engine schema repository
Repositories in the GitHub Microsoft Search organization controlled by the PnP initiative
Other related resources from GitHub
What’s supportability story around the community tooling and assets?
Following statements apply across all of the community lead and contributed samples and solutions, including samples, core component(s) and solutions, like SharePoint Starter Kit, yo teams or PnP PowerShell. All Microsoft released SDKs and tools are supported based on the specific tool policies.
- PnP guidance and samples are created by Microsoft & by the Community
- PnP guidance and samples are maintained by Microsoft & community
- PnP uses supported and recommended techniques
- PnP is an open-source initiative by the community – people who work on the initiative for the benefit of others, have their normal day job as well
- PnP is NOT a product and therefore it’s not supported by Premier Support or other official support channels
- PnP is supported in similar ways as other open source projects done by Microsoft with support from the community by the community
- There are numerous partners that utilize PnP within their solutions for customers. Support for this is provided by the Partner. When PnP material is used in deployments, we recommend being clear with your customer/deployment owner on the support model
Please see the specifics on the supportability on the tool, SDK or component repository or download page.
Microsoft 365 PnP team model

In April 2020 we announced our new Microsoft 365 PnP team model and grew the MVP team quite significantly. PnP model exists for having more efficient engagement between Microsoft engineering and community members. Let’s build things together. Your contributions and feedback is always welcome! During August, we also crew the team with 5 new members. PnP Team coordinates and leads the different open-source and community efforts we execute in the Microsoft 365 platform.
We welcome all community members to get involved on the community and open-source efforts. Your input do matter!
- New Microsoft 365 Patterns and Practices (PnP) team members – November 2021 – Geetha Sivasailam (Artis Consulting) | @GSiVed, Natalie Pienkowska (Microsoft) | @NataliePienkow1, Derek Cash-Peterson (Sympraxis Consulting) | @spdcp, João J. Mendes (Valo) | @joaojmendes, Joel Rodrigues (Storm Technology) | @JoelFMRodrigues, Rick Van Rousselt (Advantive) | @RickVanRousselt, Stephan Bisser (Solvion) | @stephanbisser, Tetsuya Kawahara | @techan_k, and Thomas Gölles (Solvion) | @thomyg
- New Microsoft 365 Patterns and Practices (PnP) team members – May 2021 – Gautam Sheth (Valo) and Patrick Lamber (Experts Inside AG)
- New Microsoft 365 Patterns and Practices (PnP) team members – February 2021 – April Dunnam (Microsoft), Emily Mancini (Sympraxis Consulting) and Veronique Lengelle (CPS)
- New Microsoft 365 Patterns and Practices (PnP) team members – December 2020 – Luise Freese and Sébastien Levert
- New Microsoft 365 Patterns and Practices (PnP) team members – August 2020 – Albert-Jan Schot (BLIS Digital), Koen Zomers (Microsoft), Paul Bullock (CaPa Creative), Rabia Williams (Microsoft) and Yannick Plenevaux (PVX Solutions)
Got feedback, suggestions or ideas? – Please let us know. Everything we do in this program is for your benefit. Feedback and ideas are more than welcome so that we can adjust the process for benefitting you even more.
Microsoft 365 PnP Recognition Program

We are excited to announce new community contributor program for all the active community members. Through this program you can get officially acknowledged with the a Credly badge around your work on our open-source and community channels. See more from
https://aka.ms/m365pnp-recognition. Thank you for being part of this journey with us.
⚙ Area-specific updates
These are different areas which are closely involved on the community work across the PnP initiative. Some are lead and coordinated by engineering organizations, some are coordinated by the community and MVPs.
Microsoft Graph Toolkit

Microsoft Graph Toolkit is engineering lead initiative, which works closely with the community on the open-source areas. The Microsoft Graph Toolkit is a collection of reusable, framework-agnostic web components and helpers for accessing and working with Microsoft Graph. The components are fully functional right of out of the box, with built in providers that authenticate with and fetch data from Microsoft Graph.
All the latest updates on the Microsoft Graph Toolkit is being presented in our bi-weekly Microsoft 365 Generic Dev community call, including the latest community contributors.
Microsoft 365 Community docs

Community docs model was announced in the April 2020 and it’s great to see the interest for community to help each other by providing new guidance on the non-dev areas. See more on the announcement from the SharePoint blog – Announcing the Microsoft 365 Community Docs. We do welcome contributions from the community – our objective is to build a valuable location for articles from Microsoft and community together.
Have ideas for articles or want to contribute yourself? – Get involved! Here are also some additional resources explaining the model more detailed.
SharePoint Framework development samples

These are the updated SharePoint Framework samples which are available from the the different repositories.
How to find what’s relevant for you? Take advantage of our SharePoint Framework web part and extension sample galleries – includes also solutions which work in Microsoft Teams
Microsoft Teams community samples

These are samples which have been contributed on the community samples since last summary. We do welcome all Microsoft Teams samples to this gallery. They can be implemented using in any technology.
- New sample tab-sso-graph-upload-as-pdf by Markus Möller (Avanade) | @Moeller2_0 to enable users to upload files via drag n drop and convert the file to a PDF using the current channel as a folder name
If you are interested on Microsoft Teams samples, we have just released also new Microsoft Teams sample gallery. Contributions to Microsoft Teams samples is also more than welcome. This gallery already surfaces all Microsoft samples, Microsoft Teams app templates and community samples.
Power Platform samples

There was numerous smaller updates on the different Power Platforms samples. See more details on available samples from following location:
If you have any existing samples which you’d be willing to share with others – please submit a pull request or contact the PnP team members to get started on getting more closely involved on this initiative. Here to help.
Microsoft 365 Script Samples

We have released new Microsoft 365 Script Sample gallery within past month. We welcome all scripts on Microsoft 365 automation to this centralized repository, targeted to help to manage and automate day-to-day operations.
Here are the latest updates on the Script Samples
If you have any existing scripts which you’d be willing to share with others – please submit a pull request or contact the PnP team members to get started on getting more closely involved on this initiative.
Independent Connectors Program

Microsoft Power Platform comes with a huge variety of already built-in connectors and also provides you with the ability of creating your own custom connectors. As of July 2021, anyone can submit the connectors they built to Microsoft Power Platform so that they can be used by others as well. Previously, only API owners could publish their connectors. The Independent Publisher Connector Program’s mission is to bring the best together: the best people, connecting great ideas to data, apps, and flows. We want to make it easier for connector developers to collaborate on connectors.
For more information, you can watch this video on Publish a connector to the Publish a connector to the Power Platform with Independent Publisher Connector Program gram and check out Microsoft Power Platform Connectors on GitHub
These are the latest connectors:
Sharing is Caring initiative

The “Sharing Is Caring” imitative is targeted for learning the basics around making changes in Microsoft Docs, in GitHub, submitting pull requests to the PnP repositories and in GitHub in general. Take advantage of this instructor lead training for learning how to contribute to docs or to open-source solutions. Everyone is welcome to learn how to get started on contributing to open-source docs or code!
- See more from the guidance documentation – including all upcoming instructor lead sessions which you can participate!
✍ Different Microsoft 365 related open-source initiatives build together with the community
See exact details on the latest updates from the specific open-source project release notes. You can also follow up on the project updates from our community calls. There are numerous active projects which are releasing new versions with the community even on weekly basis. Get involved!
- Microsoft Look Book – Discover the modern experiences you can build with SharePoint in Microsoft 365. Look book provides design examples for SharePoint Online which can be automatically provisioned to any tenant in the world. See more from https://lookbook.microsoft.com. This service is also provided as open-source solution sample from GitHub.
- yo teams – Open-source Yeoman generator for Microsoft Teams extensibility. Supports creation of bots, messaging extensions, tabs (with SSO), connectors and outgoing Webhooks. See more from https://aka.ms/yoteams.
- PnP Framework – .NET Standard 2.0 SDK containing the classic PnP Sites Core features for SharePoint Online. More around this package from GitHub.
- PnP Core SDK – The PnP Core SDK is an SDK designed to work for Microsoft 365 with Graph API first approach. It provides a unified object model for working with SharePoint Online and Teams which is agnostic to the underlying API’s being called. See more around the SDK from documentation.
- PnP PowerShell – PnP PowerShell is a .NET Core 3.1 / .NET Framework 4.6.1 based PowerShell Module providing over 400 cmdlets that work with Microsoft 365 environments and more specifically SharePoint Online and Microsoft Teams. See more details from documentation.
- Reusable SharePoint Framework controls – Reusable controls for SharePoint Framework web part and extension development. Separate projects for React content controls and Property Pane controls for web parts. These controls are using Office UI Fabric React controls under the covers and they are SharePoint aware to increase the productivity of developers.
- Office 365 CLI – Using the Office 365 CLI, you can manage your Microsoft Office 365 tenant and SharePoint Framework projects on any platform. See release notes for the latest updates.
- PnPJs – PnPJs encapsulates SharePoint REST APIs and provides a fluent and easily usable interface for querying data from SharePoint sites. It’s a replacement of already deprecated pnp-js-core library. See changelog for the latest updates.
- PnP Provisioning Engine and PnP CSOM Core – PnP provisioning engine is part of the PnP CSOM extension. They encapsulate complex business driven operations behind easily usable API surface, which extends out-of-the-box CSOM NuGet packages. See changelog for the latest updates.
- PnP PowerShell – PnP PowerShell cmdlets are open-source complement for the SharePoint Online cmdlets. There are more than 300 different cmdlets to use and you can use them to manage tenant settings or to manipulate actual SharePoint sites. They See changelog for the latest updates.
- PnP Modern Search solution – The PnP ‘Modern Search’ solution is a set of SharePoint Online modern Web Parts allowing SharePoint super users, webmasters and developers to create highly flexible and personalized search based experiences in minutes. See more details on the different supported capabilities from https://aka.ms/pnp-search.
- Modernization tooling – All tools and guidance on helping you to transform you SharePoint to modern experiences from http://aka.ms/sppnp-modernize.
- SharePoint Starter Kit v2 – Building modern experiences with Microsoft Teams flavors for SharePoint Online and SharePoint 2019 – reference solution in GitHub.
- List formatting definitions – Community contributed samples around the column and view formatting in GitHub.
- Site Designs and Site Scripts – Community contributed samples around SharePoint Site Designs and Site Scripts in GitHub.
- DevOps tooling and scripts – Community contributed scripts and tooling automation around DevOps topics (CI/CD) in GitHub.
- Teams provisioning solution – Set of open-source Azure Functions for Microsoft Teams provisioning. See more details from GitHub.
✍ Documentation updates
Please see all the Microsoft 365 development documentation updates from the related documentation sets and repositories as listed below:
? Microsoft 365 Developer and Microsoft 365 Community YouTube video channels
You can find all Microsoft 365 related videos on our YouTube Channel at http://aka.ms/m365pnp/videos or at Microsoft 365 Dev. These channels contains already a significant amount of detailed training material, demo videos, and community call recordings.
Here are the new Microsoft demo or guidance videos released since the last monthly summary:
Community demos as following:
Key contributors to the November2021 update
Here’s the list of active contributors (in alphabetical order) since last release details in GitHub repositories or community channels. PnP is really about building tooling and knowledge together with the community for the community, so your contributions are highly valued across the Microsoft 365 customers, partners and obviously also at Microsoft.
Thank you for your assistance and contributions on behalf of the community. You are truly making a difference! If we missed someone, please let us know.
Companies: Here’s the companies, which provided support the community initiative for this month by allowing their employees working for the benefit of others in the community. There were also people who contributed from other companies during last month, but we did not get their logos and approval to show them in time for these communications. If you still want your logo for this month’s release, please let us know and share the logo with us. Thx.

Microsoft people: Here’s the list of Microsoft people who have been closely involved with the PnP work during last month.
MVP Community team
MVP Community team (PnP Team) manages the PnP community work in the GitHub and also coordinates different open-source projects around Microsoft 365 topics. PnP Team members have a significant impact on driving adoption of Microsoft 365 topics. They have shown their commitment to the open-source and community-driven work by constantly contributing to the benefit of the others in the community.
Thank you for all that you do!
Here are the Microsoft Internal PnP Core team members:
Next steps
See all of the available community calls, tools, components and other assets from https://aka.ms/m365pnp. Get involved!
Got ideas or feedback on the topics to cover, additional partnerships, product feature capabilities? – let us know. Your input is important for us, so that we can support your journey in Microsoft 365.
“Sharing is caring” ?
Microsoft 365 Community (PnP) – November 26th 2021
by Contributed | Nov 25, 2021 | Technology
This article is contributed. See the original author and article here.
Introduction
The role of the Data Analyst supports businesses to maximize their competitiveness through gaining insights into data assets. Data Analysts are responsible for designing and building scalable data models, cleaning, and transforming data, and enabling advanced analytic capabilities. The outcomes of which provide meaningful insights that can drive key business decisions and processes. As well as preparing and querying data, Data Analysts will also design and implement data-driven visualisations and dashboard that add business value and designed for a range of stakeholders.
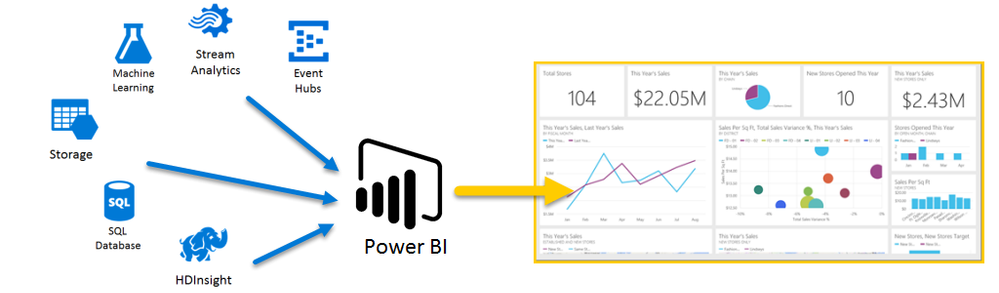
Microsoft Azure and Power BI are powerful tools for businesses to derive business insights and provide large scale analytics capability from a range of datastores. Microsoft’s DA-100 Analysing Data with Microsoft Power BI course and exam gives students the opportunity to develop data analytical skills by using Azure and Power BI. The course is suitable for students at both undergraduate and postgraduate levels and can be run either as an extra-curricular course or integrated as part of a degree programme for academic credit. Below is an example of the types of cloud data stores that Power BI can connect to and drive visualisations. It can also connect to local data stores and files such as Excel and csv files, offering flexibility for students.
This blog post will discuss case studies of how DA-100 is being delivered at two institutions: University of Lincoln (UK) and Nanyang Polytechnic (Singapore), covering:
- Teaching approaches for DA-100 learning materials and official exam
- Academic assessment/capstone strategy
This will cover teaching at both undergraduate and postgraduate levels and as part of different types of programmes, demonstrating the flexibility that implementing DA-100 offers. The DA-100 course includes a Microsoft certification exam, however it is recognised that many educators will also want to develop an academic assessment strategy that compliments the DA-100 exam. For example, a typical course/module in the UK is normally run over a 12-week period. A Data Analytics module could integrate the DA-100 learning materials and exam in the first 6 weeks of the module with the remaining 6 weeks dedicated to an academic assessment/capstone project.
The use of both the DA-100 certification exam and academic capstone assessment gives students the opportunity to demonstrate data analytics competencies across the Azure data stack and Power BI. In particular, the capstone provides the space for students to design and deploy a Power BI solution of their own design to meet the requirements of a given scenario.
Overview of DA-100: Analyzing Data with Microsoft Power BI
For those of you who are unfamiliar, this learning path and exam is at the heart of building fundamental skills for preparing, modelling, visualising, and analysing data. Desirable skills for data analysts, they could equally extend beyond this to serve those looking to build new desirable foundational knowledge or for those who want some experience using Azure’s suite of data tools including Power BI. To state these as desirable would be an understatement. Combined with machine learning, automation, and cloud technologies, it has never been more accessible to build dynamic enterprise intelligence layer data and analytics solutions. Even if we consider our everyday use, organisations are increasingly democratising access to analytics and dashboards to instil cultures and capabilities among those teams. As recognised in Forbes, these give rise to frontline workers, regardless of industry and background, to translate insights into business impact and promote data-driven decision-making more broadly.
Data analytics tops McKinsey’s business area with the greatest need to address potential skills gap, and Gartner’s TalentNeuron analysis for digital skills in demand beyond tech companies and outside of IT. Not only are data science degrees on the rise, but apprenticeship standards in these areas also continue to be developed, supporting the need for these skills in industry right now. It has the power to accomplish many things in today’s climate. Where big data through sophisticated techniques has the potential to create value, there is no denying the ability for business analytics to illuminate deep data insights that can lead to more confident decision-making and real-time action.
Microsoft Learn for Educators – Access to DA-100 Course Materials
All Microsoft Learn Educators now have access to select Microsoft Advanced Role-Based Microsoft curriculum and teaching materials including DA-100. Courses with Advanced Role Based content enable your students to deepen their technical skills and enhance their readiness for employability with industry-recognised certifications.
Member of the Microsoft Learn Educator Ambassador community can find Advanced Role Based curriculum in the Learning Download Center (LDC). Additional teaching materials, like course datasheets, educator guides, and assessment guides are also available.
|
Case Study – University of Lincoln and DA-100
The University of Lincoln (UoL) recently developed a new MSc Cloud Computing programme that aims to provide students with cutting-edge cloud skills and certification opportunities across a range of cloud competencies including cloud data, networking, compute, and development. Below is a programme map for the MSc, and of interest for this blog post is cloud data component of the programme, a 12-week module was developed named Cloud Data Platforms and Tools:

Cloud Data Platforms and Tools – Module Overview
The CDPT (Cloud Data Platforms & Tools) module includes the DA-100 course materials and exam as part of the module learning materials. The module synopsis is as follows:
“Data storage is a fundamental component of IT systems, applications, and devices, with the volume of data generated increasing significantly every year. Cloud storage platforms provide a means to store and process vast volumes of structured and unstructured data that enable large scale analytics for insights. This module will explore and critique cloud-based relational and non-relational databases, and how data is managed, analysed, and processed, such as transactional processing, batch, and streaming data processing. Students will have the opportunity to design and deploy a cloud data storage and analytics solution.”
The module compliments the cloud technology pillars of cloud compute and cloud networking that are embedded in the MSc programme so that cloud data, compute, and networking are robustly covered. Students will learn about a range of cloud data storage approaches, processing, analytics, and visualisation:
- Database management systems
- On-premise vs. Cloud data platforms and tools
- Cloud data storage – blobs/buckets
- Relational data
- Non-relational data
- High-availability and disaster recovery
- Bigdata concepts
- Data encryption and security
- Data policies and governance
- Transactional, batch, and stream processing
- Data analytics
- Data visualisation
The CDPT module runs for 12 weeks with the first six weeks of the module dedicated to delivering the DA-100 course materials, consisting of 13 modules. Each week is comprised of block delivery for DA-100 module slides and associated labs. Students will then be able to take the DA-100 certification exam as part of the CDPT module assessment strategy for academic credit. Essentially this is the first assessment of two for the module.
The next six weeks of delivery for the module will be focused on academic concepts of data storage, distributed systems, and security, building on and complimenting the DA-100 materials. The overall approach is that students will have developed cloud data knowledge and understanding, as well as skills competencies for designing and deploying a data solution that includes an analytics and visualisation component. This is where the proposed DA-100 capstone project fits the module.
The second academic assessment of the module will be a version of the DA-100 capstone project that is presented and attached to this blog. As the capstone allows students to design and develop their own data solution, it satisfies the academic learning outcomes of the CPDT modules as the data solution will be submitted with a technical report. The report will require students to present a critical discussion on aspects of their data solution, including decisions made and future work developments.
Overall, the combination of the DA-100 course materials/certification exam delivered alongside academic materials and the capstone project provides a compelling structure for the CPDT module for students to learn from.
Nanyang Polytechnic and DA-100
NYP Professional Competency Model (NYP-PCM) is a competency-based model that mirrors workplace practices and has been endorsed by our industry partners. A distinctive feature of NYP-PCM is that it allows related Competency Units (CmUs) to be grouped, with a Work-Integration-Unit (WIU), to form Competency Canvases (CCVs). While CmUs develop specific competencies, WIUs enable learners to synthesise competencies developed through related CmUs within a CCV to perform significant tasks expected by the industry.

Competency Learning Map of Diploma in Business Intelligence & Analytics
In NYP-PCM, industry partners may collaborate with NYP to co-certify learners in recognition of the competencies they have acquired in one or more CmUs, WIUs or CCVs. Microsoft is NYP’s long-standing partner and has collaborated with the School of Information Technology in various initiatives. As a global Tech Leader, Microsoft enjoys a strong community presence in the area of Analytics, with its data visualization and business intelligence tool, Microsoft Power BI.
NYP’s Visual Analytics Canvas aims to develop Visual Analytics competencies in our learners. Upon the completion of this canvas, learners are expected to perform data retrieval and data manipulation task using Extract-Transform-Load (ETL) techniques, analyse data using statistical techniques and develop dashboards to communicate business data insights effectively to the key stakeholders.
There are 4 CmUs and 1 WIU in the Visual Analytics Canvas (See Table 1).
Type
|
Name
|
CmU
|
Business Needs Analysis
|
CmU
|
Data Visualisation
|
CmU
|
Data Storage Administration
|
CmU
|
Decision Analysis
|
WIU
|
Visual Analytics Project
|
Table 1 – CmUs and WIU in Visual Analytics Canvas
NYP will co-develop the Visual Analytics Canvas with Microsoft by infusing the Microsoft Certified: Data Analyst Associate curriculum into the Visual Analytics Canvas. Details of the canvas co-development are as shown in Table 2.
CmU/WIU
|
Co-development Details
|
Data Visualisation
|
· Infuse with Microsoft Certified: Data Analyst Associate Curriculum
· Microsoft’s professional certification exam DA-100: Analyzing Data with Microsoft Power BI as part of the Data Visualisation CmU’s ICA. Refer to Skills Measured in DA-100: Analyzing Data with Microsoft Power BI Exam
|
Visual Analytics Project
|
· Infuse with Microsoft Certified: Data Analyst Associate Curriculum and Capstone Project
· Leverage Microsoft Power BI tool for dashboard development in the project
|
Table 2 – NYP-Microsoft Visual Analytics Canvas Collaboration
To be awarded the Certificate of Competency in Visual Analytics jointly issued by NYP and Microsoft, learners are expected to pass all the CmUs and WIU in the Visual Analytics Canvas. In addition, learners are also expected to pass Microsoft’s professional certification exam (DA-100: Analysing Data with Microsoft Power BI), which constitutes part of Data Visualisation CmU’s In-Course Assessment.
Learners who are awarded the co-certificate would also receive the Microsoft professional certificate (Microsoft Certified: Data Analyst Associate).
Developing a Capstone Project
Capstone projects are designed to consolidate learning and to apply skills. This could easily be used as part of formal assessment, or as an enrichment opportunity, e.g., theme for hackathon and/or competition. Unlike an exam, the skills developed as part of a capstone project ensure students’ gather practical experience and are able to think more widely about real-world problems faced. It is no surprise that when as academics we came together, the desire to develop a capstone project to put new knowledge into practice was sought after. In as much as demonstrating learning and applied skills are invaluable, capstone projects also offer students a wide range of opportunities to develop critical thinking, problem solving, and presentation of their findings. It is through these experiences that students have the capacity to improve confidence, create a safe space for asking questions, and curate a series of activities for discussion at interview and/or for adding to their CV and resume.
Our Capstone project for DA-100 has been developed to assess learner’s skills in designing a PowerBI solution, creating/implementing a cloud infrastructure diagram using Azure services, and presenting their own cloud data solution. To achieve this, practitioners and learners are provided with a scenario where they take on the role of a city planner responsible for the design and development of urban areas that support community needs and developing short- and long-term plans. Their task is to develop a dashboard that can be readily accessible and used by a variety of different audiences. Learners are encouraged to go one step further to identify ways of improving city services, using data to provide insights into how the city’s population could become more sustainable and bring better understanding of the city’s overall performance.
Microsoft Learn for Educators – Access to DA-100 Capstone Project
Check out the Learning Download Center (LDC) for full access to the Educator and Student guide (with access to recommended activities/tasks, client scenario and rubric) for assessment.
|
Conclusion
Community of practice, or simply the coming together of like-minded academics, whatever you choose to call us, this blog and the newly designed Capstone Project serve as examples of the different types of output that can be achieved from bringing together experiences, course development, coupled with a handful of determined practitioners. With the help of Microsoft’s Technical Experts. We have been able to draw on our strengths to develop something which each of us and our institutions can use in practice. Not even geography could divide us, as we worked across three time zones and put aside each of our institutional requirements to create a global version of a project that took the best of DA-100 and Microsoft’s learning philosophy.
Once we collectively realised what we wanted to achieve, we gave ourselves license to operate and grow. Assessments were not new to any of us but designing a tangible tool with practitioners and students in mind that we wanted to make accessible for those of all backgrounds was to be no mean feat. We sourced relevant global access to data sets, developed a scenario that could add value to real-world problems, and built a series of activities/tasks that could be adapted to allow all learners to truly demonstrate their new knowledge and skills in a purposeful way. From the ground up our Capstone project choices have intended to serve the wider community of educators.
Educators are increasingly looking for support on how to achieve these benefits in their own practice and, like us, keen to stretch and challenge learners to ensure they have the skills they need to achieve long-term success. Each of us are delighted with the work produced and could not recommend more the opportunities we have had available to us to network and develop our own craft through the sharing of good practice as members of the Microsoft Educator Ambassador community.
We would like to invite you to the following Microsoft Reactor Session where we will discuss these resources in more detail.
Webinar – Please join us on Dec 3rd 9.30am GMT
Date: December 03, 2021
Time: 09:30 AM – 10:30 AM (GMT)
Format: Livestream
Topic: Data Science and Machine Learning
Register

Interested in running a Data Analytics Capstone Project.
Capstone Overview
This guide features a single, end-of-course Capstone project in which each student creates and delivers a PowerBI data solution and presentation based on client requirements. The project draws upon the students’ understandings gained from all modules in the course and presents an opportunity to demonstrate their intellectual curiosity around the design, deployment and presentation of a scenario-based PowerBI data solution. It is designed to be flexible enough to be used in a variety of contexts for students of various technical levels.
The Capstone Project Student Guide can be copied and redistributed to students as standalone content, as it provides an example of a baseline project that could be tailored to fit the needs of various classes. You may choose to modify some of the content dependent on which parts of the Capstone are to be assessed and whether a real-world client or pre-defined scenario is used.
The Capstone Project Educator Guide section provides additional guidance for modifications that can be made to the capstone project, as well as comprehensive information on best practices in the preparation and development of the project.
The Capstone Project Rubric section provides additional information for students and teachers in using the project as a summative assessment. Students may use this document to guide them as they complete the activities, ensuring that their work reflects what they have learned in the course.
Overview and Objectives
This is the final activity for the course. The primary objective is to create an interactive PowerBI data solution and dashboard with accompanying presentation that summarizes and justifies an industry client’s needs and goals for a data driven PowerBI solution, along with a diagrammatic representation of the proposed solution. The presentation should also document the steps taken to prepare, model, and visualise the data and state how to deploy and maintain deliverables. This is an opportunity for students to reflect on what they have learned throughout the course, both about Microsoft PowerBI and the client. There is a specific focus on the Microsoft Dataverse, Data Analysis Expressions (DAX), and analytics services for the Capstone.
Capstone Modification Options
As you plan your course, you may choose to tailor the Capstone project to the unique needs of your students. This may be in response to particular learning goals or logistical constraints. Depending on the student cohort and the focus of their study program, you may want to consider changes to:
- The parts of the Capstone students will be assessed on.
- The use of either a real-world client or pre-defined client scenario.
- The rubric criteria
The Capstone can be completed individually or in groups and is modular to suit different student cohorts. You can select which parts of the Capstone project to deploy for assessment purposes.
To align with industry expectations and real-world application of cloud-driven data skills, the Capstone is primarily designed as a scenario-based project. In the baseline version of the project, students interact with a real-world industry client, allowing them to experience the requirements gathering phase and carry out research around configuring suitable data services and associated components. If this is not possible, you can develop a pre-defined industry scenario where students will make assumptions based upon the scenario content to develop an informed set of requirements. You can also ask students to research an existing company and develop a set of recommendations based on publicly available information.
The rubric criteria can easily be modified to reflect the priorities with your learners. You may choose to add or remove rows from the rubric or change the details of the scoring criteria.
Capstone Parts
The Capstone is split into three parts that offer some flexibility to adapt to student needs and their program of study:
- Part 1 – Design the requirements for the real-world client or pre-defined scenario with a proposal that frames how PowerBI offers the capability to design a solution to meet the client needs and goals.
- Part 2 – Create/implement a cloud infrastructure diagram for the selected Azure cloud data services. For more technical programs, you may also encourage the students to include a data model diagram as part of this activity.
- Part 3 – Present the cloud data solution utilising a choice of selected Azure services/technologies from the following list:
Azure Services/Technologies (select)
|
Data Formats (recommended)
|
Azure SQL
Azure Cosmos
Azure NoSQL
Azure Storage
Microsoft PowerBI
Azure Web Services
Microsoft SharePoint
Microsoft Teams
Microsoft Active Directory
DAX
Power Platform
|
.CSV
.TXT
.XLS
SQL
NonSQL
|
It may be more appropriate to assess students on less-technical programs against Part 1 only. Students on more technical programs may be assessed across Parts 1, 2 and 3. This is a judgement that you, as the instructor, are best equipped to make.
Part 1 – Design the requirements for the real-world client or pre-defined scenario with a proposal that frames how PowerBI offers the capability to design a solution to meet the client needs and goals.
Depending on how you deliver the course, students can use class sessions or independent study time to complete their Capstone work. This can also be facilitated through remote drop-in/support sessions.
Remind students to review the Capstone rubric so they understand the required tasks for Part 1 as listed below:
- A summary description of the client’s current situation, needs, and goals.
- Proposal of how Azure cloud data services provide the capabilities to design a data solution to meet the client goals.
- Expected costs – use the online Azure Pricing Calculator for this.
- Consideration of data security and access control to various data levels
- Benefits to their clients.
Part 2 – Create/implement a cloud infrastructure diagram for the selected Azure cloud services data services. For more technical programs, you may also encourage the students to include a data model diagram as part of this activity.
This part of the Capstone project is designed specifically for students in more technical programs. It involves taking the cloud services identified from Part 1 and integrating them in an interconnected architectural diagram. The diagram can be created in Microsoft PowerPoint or Microsoft Visio using the Microsoft Azure Icon Set.
Alternatively, there are several free to use web-based diagramming tools that are suitable for the task. An example diagram is presented in Appendix B that addresses the pre-defined client scenario for a company focused on a need for cloud data services.
Remind students to review the Capstone rubric so they understand the required tasks for Part 2 as listed below:
- Diagram: Visualize Azure cloud data services from the identified list of cloud services.
Part 3 – Present the cloud data solution utilising the following selected services (as listed/provided).
Students should select appropriate Azure services/technologies and recommended data format suggestions to prepare their cloud data solution.
Students can deliver their presentations either in-class or remotely. In terms of timings, approximately 10 minutes for the presentation followed by 5 minutes for questions should suffice. Consider the following options to decide the best format for your students to present their work to an audience:
- Whole-class presentations: Students share their presentations with the whole class, taking turns and following any time limits – this is only suitable for small class sizes.
- Small group presentations: Divide the class into small groups. Allow each student a set amount of time to present to the other students in the group.
- Invite the clients: If possible, inviting the clients to the presentations will provide the students with further feedback opportunities.
Students should be encouraged to discuss and justify why they selected specific cloud services to meet the client’s needs. You may want to ask students to respond to some or all of these reflection questions:
- Why did you choose a specific service over another?
- What benefits might the client customers expect?
- What was the most challenging part of the project?
- If you had more time, what improvements would you make?
- How are you defining and displaying business information in the dashboard?
- How are you using appropriate visualisations for appropriate data story telling?
- Does the data provide meaningful insights to the business?
Client Scenarios
In the baseline project as outlined in the student guide, students are assumed to have access to a real-world client. However, you may also choose to have students research information about a client or provide them with a pre-defined client scenario.
Real-world client
The benefits when using a real-world client are clear, it provides a measure of authenticity for the students and aligns with industry expectations. Generally, the instructor would be responsible for sourcing one or more clients with whom the students can have scheduled time with to understand their current business needs and goals. Ideally a session would be arranged with the client in the first instance where they can communicate their needs and goals to all students, followed by a Q & A session.
The instructor should guide the client to communicate the following information for the students to ensure students have all the information they need to begin their preparatory work:
- Company type
- Products
- Customer expectations
- Current technology resources
- Projected needs and goals
Researched client
If direct access to real-world clients is not available, you may choose to have students research a client using publicly available information. This allows for a sense of authenticity without the logistical challenges of managing client interactions. In this case, you may have students choose from a list of appropriate clients that you have pre-selected or allow each student to submit their own potential client for approval. Be sure to confirm that students can find the same information listed in the previous section from publicly available information when creating a list of appropriate clients and/or approving clients submitted by students.
Pre-defined client
If a client is not be available or if there are time constraints to deliver the course, you can also choose to give students a pre-defined client scenario. See below for a data analytics scenario that can be used as the pre-defined client scenario. You should feel free to modify the scenario or develop one of your own.
The client city planner is responsible for the design and development of urban areas, including community needs and developing short- or long- term plans. Urban planning is a valuable force for city leaders to achieve sustainable development and bringing about a difference to the communities it serves. The client city planner is looking for ways to improve the quality, performance, and safety of its existing eco-system. However, their primary focus is on finding ways to ensure optimal efficiency and increasing its use of technologies to inform its smarter cities strategic policy and agenda. Much of the data gathered by the client city planner is made available publicly including but not limited to transportation, environment, health, education, infrastructure, jobs, and economy. This data is stored in a variety of different formats that can be downloaded from:
The client city planner believes that a combination of both historical (meaning persistent data storage) and real time (meaning streamed from the source) data could be used to identify ways of improving city services and/or provide insights into how the city’s population could become more sustainable. They would also like to understand how different data sources come together to bring a better understanding of the city’s overall performance. They require a data dashboard that is capable of visualising multiple sources of data of the city’s eco-system. Also, they need a dashboard that is readily accessible to be used by a variety of different audiences.
The following information can be derived from the client scenario above, which is similar to the basic information that can be derived from a real-world client:
- Company type – Specializes in city planning
- Their products – Service-led, to develop and set policies and agenda for transport, the local economy, jobs, green infrastructure, renewable energy, climate change, etc.
- Their customers’ expectations – A city that is purposefully designed and built to serve its community.
- Their current situation and how they do things now – Currently, they collect data locally and then categorise data sets based on topics, trends, or themes for members of the public and/or organisations to use. They have access to the data but don’t have the capability to process, analyse and visualise it.
- Their projected needs and goals – The client city planner would like to find ways to bring data sources together and visualise data to create meaningful .
Preparing and Supporting Students
We recommend that you introduce the Capstone after Module 2 to allow students to start thinking about how they can apply what they are learning each week to the project. The end-of-module questions, particularly the questions with an open-ended format, lend themselves well to preparing your students to think independently about the processes to design a suitable cloud solution for the project. See the introduction to the Module Questions section for suggestions of how to encourage high student engagement with the Module Questions to help scaffold the process of designing a full-scale solution for the Capstone project.
If students have questions or are facing problems while completing the tasks, direct them to the following problem-solving strategies before asking you for help:
- Review the content in the Student Capstone Guide.
- Research the official Microsoft Azure Documentation.
- Ask peers for help.
- Review their client notes/pre-defined scenario document.
You may consider adding extra sessions as needed for the Capstone preparation and presentation delivery. This will give students dedicated collaborative time to work in groups and allow you to informally monitor their progress as they move through the various tasks.
Capstone Project – Student Guide
Overview
In this Capstone, you’ll create a presentation that summarizes your client’s current situation, needs, and goals; lists the services you’d recommend for your client; documents the expected costs; outlines an architectural diagram; and states the benefits for your client. This is an opportunity for you to reflect on what you have learned throughout the course about Microsoft Azure Data services and your client.
Preparing for the Capstone
To best prepare for the Capstone, consider the following:
- Start preparing early. Read this Capstone guide early in the course.
- Meet with your client and take notes. Take and keep thorough notes about your client and remember it’s better to get too much information from your client than not enough.
- Think about your client in each module. As you learn new concepts in each module, consider how they might apply to your client.
- Work on the presentation early and complete the end-of-module questions. Consider building your presentation throughout the course. The end-of-module questions are designed to help support your understanding of the Capstone tasks, so think about your project as your complete them.
- Refer to the rubric as you work. Use the Capstone rubric document to ensure you fully understand the requirements for the tasks presented below.
Capstone Tasks
Task 1 – Design a proposal that frames how PowerBI offers the capability to design a solution to meet a client’s needs and goals.
In the first phase of this project, you will be working to understand your client’s needs and using what you know about Azure data services to design a solution. By the end of this task, you should have a clear idea of what your client’s needs are and how your solution meets those needs. You will be using this information to create a presentation in Task 3, so be sure that you have all the following documented:
- A summary description of their client’s current situation, their needs, and their goals.
- Proposal of how Azure cloud data services provide the capabilities to design a data solution to meet the client goals.
- Expected costs – use the online Azure Pricing Calculator for this.
- Consideration of data security and access control to various data levels.
- Benefits to their clients.
Task 2 – Create/implement a cloud infrastructure diagram and/or data model diagram for the selected Azure cloud services data services.
Use the list of Azure services identified in Task 1 and integrate them in an interconnected architectural diagram. The diagram can be created in Microsoft PowerPoint or Microsoft Visio using the Microsoft Azure Icon Set. Alternatively, there are several free to use web-based diagramming tools that are suitable for the task.
Be sure to include the following in your diagram:
- Visualize core cloud data services from the identified list of cloud services.
- Correctly highlight relationships between Cloud data services and other services through connections.
- Identify each of the customer endpoints.
Your solution should demonstrate the following:
- Import a dataset to PowerBI by carrying out clean, transform, and load tasks.
- Visualise a range of meaningful insights from the processed data using suitable queries.
Task 3 – Present the cloud data solution utilising a choice of selected Azure services/technologies (as listed/provided).
In this phase, you will deliver a ten-minute presentation that describes the needs analysis, recommendations, and explanations that you documented earlier in the project. After the presentation, others will have an opportunity to ask you questions about your process and recommendations. Make sure you include clear evidence to support the decisions that you have made, based on the information that you gathered about your client, and that your presentation is organized and detailed enough for your audience to have a good understanding of the benefits of your recommendations.
Support and Resources
If you have questions or are facing problems while completing the tasks, use the following problem-solving strategies before asking your instructor for help:
- Review the content in the Student Capstone Guide.
- Research the official Microsoft Azure Documentation.
- Ask peers for help.
- Review their client notes/pre-defined scenario document.
Post-Project Reflection Questions
- Why did you choose a specific service over another?
- What benefits might the client customers expect?
- What was the most challenging part of the project?
- If you had more time, what improvements would you make?
- How are you defining and displaying business information in the dashboard?
- How are you using appropriate visualisations for appropriate data story telling?
- Does the data provide meaningful insights to the business?
DA-100 Appendix A – Capstone Rubric
Item
|
Approaches standard
|
Meets standard
|
Exceeds standard (Includes items in Meets Standard)
|
Summarize where & how you included this item
|
Task 1
|
Description of Solution
|
Description of solution does not specifically address the use of each tool.
|
Description of solution specifically addresses the use of each tool.
|
Description of solution includes an explanation of how security is administered.
|
|
Description of client’s current cloud situation, goals, and needs
|
Description of the client’s situation, goals, and needs aren’t clear and relevant.
|
Description of the client’s situation, goals, and needs are clear and relevant to the organization.
|
Description includes direct quotations from the client that provide details about their situation, goals, and needs and that are relevant to the organization.
|
|
Recommended Microsoft Azure service solutions for the client and reasoning
|
Not all recommendations fit the client, or cover all aspects of the course, or demonstrate an understanding of Azure products and services.
|
Recommendations fit clearly with an understanding of the client. Recommendations consider services and solutions from the course. Reasoning for recommendations demonstrates an understanding of Azure and cloud concepts.
|
Recommendations at times evidence critical thinking and explain products and services that weren’t chosen and a rationale as to why
|
|
Description of the costs expected for the client
|
Costs aren’t clearly explained or lack detail, or the costs don’t include support or a service level agreement (SLA).
|
Costs are clearly explained in a detailed way that’s easy to understand. All costs are considered, including support and SLAs.
|
All costs include supporting information that relates cost to the client’s specific needs.
|
|
Description of the benefits for the client
|
Client benefits aren’t clearly explained or lack detail, or a total cost of ownership (TCO) calculation isn’t included
|
Client benefits are clearly explained in a detailed way that’s easy to understand and includes a TCO calculation.
|
Benefits include supporting information that relates to the client’s current situation and potential needs in the future.
|
|
|
Description of solution does not specifically address the use of access control to data and general security
|
Description of solution clearly explains the use of access control to data in the solution.
|
Description of solution includes a robust explanation of how security and access control is administered.
|
|
Task 2
|
Visualize through a diagram core cloud data service from the identified list of cloud services/solutions from Task 1
|
|
|
|
|
Cloud services in diagram correctly highlight relationships / connections to other services
|
Some cloud services evidence interconnectivities but lacks cohesiveness and detail.
|
Cloud services interconnection and relationships are presented correctly and clearly
|
Cloud services interconnection is well-considered and detailed to a good standard for all services.
|
|
Create a dashboard using Power BI
|
Dashboard includes only one tile, or only one kind of visualization, or does not relate to the business described.
|
Dashboard includes two or more tiles, with different visualizations, and relates to the business described.
|
Dashboard includes three or more tiles with different visualizations.
|
|
Task 3
|
Presenter aids
|
Presenter does not describe how the Microsoft Power BI solution can add value to the client business.
|
Presenter describes several aspects of the Microsoft Power BI solution, referencing the architecture diagram, and explains how the solution adds value to the client business.
|
Presenter describes a flow, dashboard, and app as part of the Microsoft Power BI solution, referencing each in the architecture diagram and explaining how the work together to add value to the business.
|
|
Presentation aids
|
Not all materials are organized or easy to understand. Not all visual and/or audio elements help audience understanding, some might distract.
|
Materials are organized and clear. Visual or audio elements help audience understanding.
|
Materials are interesting, easy to understand, and include at least one way to gather audience responses beyond just asking if there are any questions.
|
|
Delivery of presentation
|
Presenter isn’t prepared or doesn’t engage with the audience.
|
Presenter is prepared and engaged with the presentation and the audience. Communication of ideas is mostly clear and effective.
|
Presenter communicates beyond just reading the words on the presentation materials. Communication of ideas is consistently clear and effective.
|
|
by Contributed | Nov 24, 2021 | Technology
This article is contributed. See the original author and article here.
Data warehouse, data integration, and big data analytics together are continuing to grow at planetary scale in enterprises. Azure Synapse Analytics provides limitless analytics services to query data using different compute engines and programming languages. Azure Synapse workspaces allow the data engineering, machine learning, and BI projects to coexist without creating silos in experiences, processes, and tools. As data continues to explode and be used, it’s more important than ever to fully govern the data.
The Azure Purview integration in Azure Synapse provides a comprehensive data governance solution with a single pane of glass for all analytics workloads. Organizations can run a variety of analytics projects and put data to work much more quickly, productively, and securely, generating insights from all data sources. The embedded data discovery experience in Azure Synapse powered by Azure Purview further increases data agility and time to insights.
In this blog, you will learn how to govern your Azure Synapse workspace by connecting to Azure Purview for automated data discovery and classifications in the Purview Data Map. You can further use the Purview Data Catalog to search enterprise data and use contextual gestures to build analytics workloads.
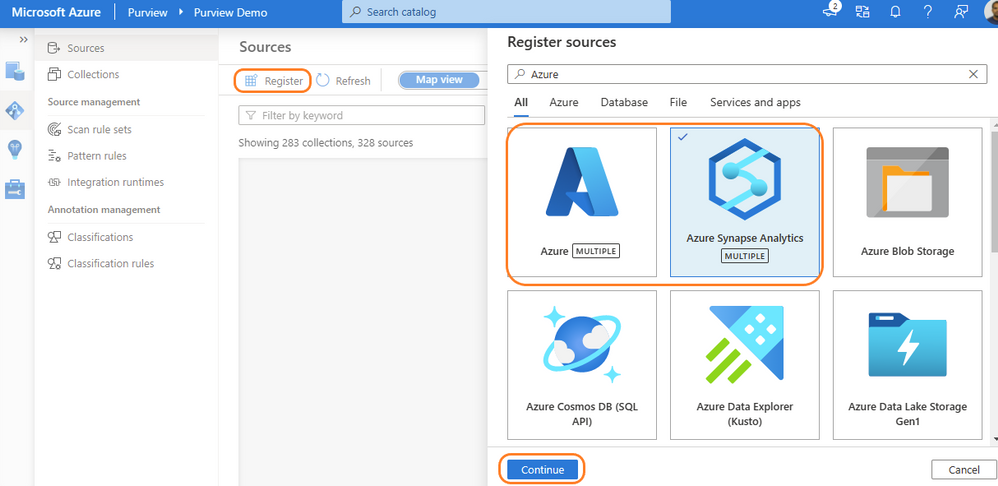
Register and scan in Azure Purview
Purview data source administrators can start by registering an Azure Synapse workspace under a collection of the Purview Data Map. Admins can choose to register individual workspaces or simply register the Azure Subscription containing all Azure Synapse workspaces. With a few clicks, a recurring scan can be set for automated data discovery of technical metadata and classifications. Azure Purview can support 200-plus classifications that look for sensitive and PII data while scanning. The admin can configure specific databases of a workspace and credentials managed in Azure Key vault for secured connection while scanning. Creating a private endpoint is supported for scanning Azure Synapse workspaces behind VNET. Read more details on how to register and scan Azure Synapse Analytics workspaces.
Register Azure Purview from Azure Synapse workspace
Azure Synapse contributors can register an Azure Purview account by navigating to Manage > External connections > Azure Purview. With a single click, the Azure Synapse workspace is integrated with Azure Purview for data governance. Azure Purview helps discover all data across your organization, track lineage of data, and create a business glossary wherever it is stored: on-premises, across clouds, in SaaS applications, and in Microsoft Power BI. Read step-by-step documentation to Connect Synapse workspace to Azure Purview.

Select a Purview account from the dropdown or enter the resource URI manually and click apply. To connect a Purview account behind VNET, read how to Access a secured Azure Purview account.

Once registration is complete, the connection and integration status are shown in the details section.

Search and use enterprise data
The search box in the Azure Synapse workspace menu bar is now powered by Azure Purview for the Data, Develop, and Integrate sections. Start typing the keyword in the search bar to let Purview’s intuitive search automatically complete and match the asset by relevance on name, classification, labels, contacts, and more.

Search results are displayed in a dedicated tab for Purview. The familiar search result page experience of Purview is retained inside the Azure Synapse workspace.

With a few clicks, narrow down the search results to exact assets in Purview.

Time to insights with contextual gestures
In the asset details page, Azure Synapse users can perform a variety of contextual gestures to connect for further analytics. Depending on the asset type discovered, users can use the following gestures:
- SQL Script experiences to query top 100 rows or create external table
- Notebook experiences to create a Spark table or load to DataFrame
- Data integration experiences such as new linked service, integration dataset, and development dataflows.


Data producers can directly edit the asset from the Azure Synapse workspace and curate by adding business glossary, description, classifications, and contact details.

Automated data lineage from Azure Synapse
Data lineage from Azure Synapse are automatically pushed to the connected Purview account for copy and data flow activity. Detailed documents are available for Metadata and lineage from Azure Synapse Analytics.
The lineage metadata is pushed to Purview in real time at the end of each pipeline run. It includes granular details such as column lineage, pipeline run status, row count, and additional metadata.

Lineage status is available from the pipeline run monitoring page of the Azure Synapse workspace.

Get started with Azure Purview today
- Quickly and easily create an Azure Preview account to try the generally available features.
- Read quick start documentation on how to connect an Azure Synapse workspace to an Azure Purview account

Recent Comments