by Contributed | Jun 1, 2021 | Technology
This article is contributed. See the original author and article here.
The product submissions must be tested using the Hardware Lab Kit (HLK) for Windows Server 2022 hardware and software testing. The kit is available at the Partner Center for Windows Hardware, https://docs.microsoft.com/en-us/windows-hardware/test/hlk/.
For information on how to make a submission, see https://docs.microsoft.com/en-us/windows-hardware/drivers/dashboard
Vendors may download the Windows Server 2022 Eval version of the operating system for testing purposes here, https://www.microsoft.com/en-us/evalcenter/evaluate-windows-server-2022-preview
Vendors may also download the Virtual Hardware Lab Kit (VHLK) here, https://docs.microsoft.com/en-us/windows-hardware/test/hlk/ . The VHLK is a complete pre-configured HLK test server on a Virtual Hard Disk (VHD). The VHLK VHD can be deployed and booted as a Virtual Machine (VM) with no installation or configuration of the HLK required.
The playlist for testing Windows Server 2022 hardware and software may also be downloaded at that location. For Windows Server 2022, the release playlist has been consolidated for both X64 and ARM64 architecture. The Playlist may be updated in the future, so it is best to check for new versions regularly.
Preview versions of the OS and HLK cannot be used for certification testing of products for Windows Server 2022.
Previous versions of the HLK to be used for testing previous Windows Server versions will continue to be available in accord with the Microsoft Product Lifecycle guidance.
by Contributed | Jun 1, 2021 | Technology
This article is contributed. See the original author and article here.
Scenario:
With RA-GRS redundancy, you can read the data using secondary endpoint. The document points at connecting to Blob Storage using secondary endpoint and read data ahead.
Actions:
We will be making use of connection string to connect to the secondary endpoint and follow the below steps:
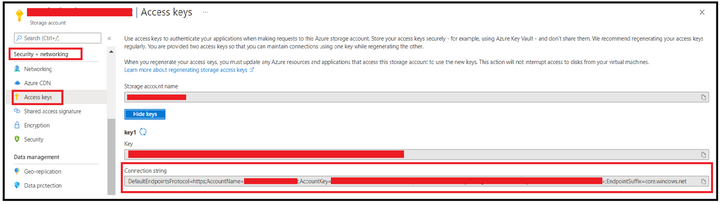
Step 1: Obtain the connection string.
We can obtain this from Azure Portal, from Access Keys section under Security & Networking Pane of Storage Account Blade.
Step 2: Editing connection string to use Secondary Endpoint.
Append the BlobEndpoint section pointing to secondary endpoint at the end of the connection string like the one given below:
DefaultEndpointsProtocol=https;AccountName=<StorageAccountName>;AccountKey=35tCZY3DXXXXXXXXXXXXXXXXXXXXXXXXXX==;EndpointSuffix=core.windows.net;BlobEndpoint=https://<StorageAccountName>–secondary.blob.core.windows.net
In case you want to leverage SAS, then you can edit the SAS URL to add secondary keyword after the account name and blob as endpoint. Below is one of the sample SAS URL:
https://<StorageAccountName>–secondary.blob.core.windows.net/?sv=2020-02-10&ss=bfqt&srt=sco&sp=rwdlacuptfx&se=2021-05-29T11:38:06Z&st=2021-05-29T03:38:06Z&spr=https&sig=XXXXXXXXXXXXXXXXXXXXXX
Step 3: Connecting to Storage Account using the connection string.
We will try connecting and accessing blobs using Azure Storage Explorer and via a powershell script. Let’s check for the process with first option.
When accessing via Azure Storage Explorer, you can follow the below steps of first selecting the resource type as Storage account.

Select the connection method as connection string and then provide the connection string created at step 2 along with the display name using which you want the connection to be displayed. Once done, click on the connect button.


At this point, the connection will get added under the Storage Accounts section of Local & Attached.
Step 4: Validations
To validate you are hitting the secondary endpoint only, you can configure fiddler as a proxy in the storage explorer and then try performing the operation of listing and reading (Get operation) while running the fiddler in the backend.

At the backend, you will see that you are hitting the secondary endpoint while trying to access the blobs.

In order to connect using Powershell, you can leverage below script to listing of the blobs inside a container.
$bMaxReturn = 100
$storageContext = New-AzStorageContext -ConnectionString “<String Generated at Step 2>”
do
{
# get a list of all of the blobs in the container
$listOfBlobs = Get-AzStorageBlob -Container “<Container Name>” -Context $storageContext -MaxCount $bMaxReturn -ContinuationToken $bToken
if($listOfBlobs.Length -le 0) { Break;}
foreach($blob in $listOfBlobs) {
write-host “Blob name:”
write-host $blob.Name
}
$bToken = $blob[$blob.Count -1].ContinuationToken;
}while ($bToken -ne $Null)
Disclaimer
By using the following materials or sample code you agree to be bound by the license terms below and the Microsoft Partner Program Agreement the terms of which are incorporated herein by this reference. These license terms are an agreement between Microsoft Corporation (or, if applicable based on where you are located, one of its affiliates) and you. Any materials (other than sample code) we provide to you are for your internal use only. Any sample code is provided for the purpose of illustration only and is not intended to be used in a production environment. We grant you a nonexclusive, royalty-free right to use and modify the sample code and to reproduce and distribute the object code form of the sample code, if you agree:
- to not use Microsoft’s name, logo, or trademarks to market your software product in which the sample code is embedded.
- (ii) to include a valid copyright notice on your software product in which the sample code is embedded.
- (iii) to provide on behalf of and for the benefit of your subcontractors a disclaimer of warranties, exclusion of liability for indirect and consequential damages and a reasonable limitation of liability; and
- (iv) to indemnify, hold harmless, and defend Microsoft, its affiliates and suppliers from and against any third-party claims or lawsuits, including attorney’s fees, that arise or result from the use or distribution of the sample code.”
For any information regarding data redundancy, you can check this link.
Hope this helps!
by Contributed | Jun 1, 2021 | Technology
This article is contributed. See the original author and article here.
The product submissions must be tested using the Hardware Lab Kit (HLK) for Windows Server 2022 hardware and software testing. The kit is available at the Partner Center for Windows Hardware, https://docs.microsoft.com/en-us/windows-hardware/test/hlk/.
For information on how to make a submission, see https://docs.microsoft.com/en-us/windows-hardware/drivers/dashboard
Vendors may download the Windows Server 2022 Eval version of the operating system for testing purposes here, https://www.microsoft.com/en-us/evalcenter/evaluate-windows-server-2022-preview
Vendors may also download the Virtual Hardware Lab Kit (VHLK) here, https://docs.microsoft.com/en-us/windows-hardware/test/hlk/. The VHLK is a complete pre-configured HLK test server on a Virtual Hard Disk (VHD). The VHLK VHD can be deployed and booted as a Virtual Machine (VM) with no installation or configuration of the HLK required.
The playlist for testing Windows Server 2022 hardware and software may also be downloaded at that location. For Windows Server 2022, the release playlist has been consolidated for both X64 and ARM64 architecture. The Playlist may be updated in the future, so it is best to check for new versions regularly.
Preview versions of the OS and HLK cannot be used for certification testing or products for Windows Server 2022.
Previous versions of the HLK to be used for testing previous Windows Server versions will continue to be available in accord with the Microsoft Product Lifecycle guidance.
by Contributed | Jun 1, 2021 | Technology
This article is contributed. See the original author and article here.
With the Azure Static Web Apps GA there was a sneaky little project that my colleague Wassim Chegham dropped, the Static Web Apps CLI.
The SWA CLI is a tool he’s been building for a while with the aim to make it easier to do local development, especially if you want to do an authenticated experience. I’ve been helping out on making sure it works on Windows and for Blazor/.NET apps.
It works by running as a proxy server in front of the web and API components, giving you a single endpoint that you access the site via, much like when it’s deployed to Azure. It also will inject a mock auth token if want to create an authenticated experience, and enforce the routing rules that are defined in the staticwebapp.config.json file. By default, it’ll want to serve static content from a folder, but my preference is to proxy the dev server from create-react-app, so I can get hot reloading and stuff working. Let’s take a look at how we can do that.
Using the cli with VS Code
With VS Code being my editor of choice, I wanted to work out the best way to work with it and the SWA CLI, so I can run a task and have it started. But as I prefer to use it as a proxy, this really requires me to run three tasks, one of the web app, one for the API and one for the CLI.
So, let’s start creating a tasks.json file:
{
    "version": "2.0.0",
    "tasks": [
        {
            "type": "npm",
            "script": "start",
            "label": "npm: start",
            "detail": "react-scripts start",
            "isBackground": true
        },
        {
            "type": "npm",
            "script": "start",
            "path": "api/",
            "label": "npm: start - api",
            "detail": "npm-run-all --parallel start:host watch",
            "isBackground": true
        },
        {
            "type": "shell",
            "command": "swa start http://localhost:3000 --api http://localhost:7071",
            "dependsOn": ["npm: start", "npm: start - api"],
            "label": "swa start",
            "problemMatcher": [],
            "dependsOrder": "parallel"
        }
    ]
}
The first two tasks will run npm start against the respective parts of the app, and you can see from the detail field what they are running. Both of these will run in the background of the shell (don’t need it to pop up to the foreground) but there’s a catch, they are running persistent commands, commands that don’t end and this has a problem.
When we want to run swa start, it’ll kick off the two other tasks but using dependent tasks in VS Code means it will wait until the task(s) in the dependsOn are completed. Now, this is fine if you run a task that has an end (like tsc), but if you’ve got a watch going (tsc -w), well, it’s not ending and the parent task can’t start.
Unblocking blocking processes
We need to run two blocking processes but trick VS Code into thinking they are completed so we can run the CLI. It turns out we can do that by customising the problemMatcher part of our task with a background section. The important part here is defining some endPattern regex’s. Let’s start with the web app, which in this case is going to be using create-react-app, and the last message it prints once the server is up and running is:
To create a production build, use npm run build.
Great, we’ll look for that in the output, and if it’s found, treat it as the command is done.
The API is a little trickier though, as it’s running two commands, func start and tsc -w, and it’s doing that in parallel, making our output stream a bit messy. We’re mostly interested on when the Azure Functions have started up, and if we look at the output the easiest message to regex is probably:
For detailed output, run func with –verbose flag.
It’s not the last thing that’s output, but it’s close to and appears after the Functions are running, so that’ll do.
Now that we know what to look for, let’s configure the problem matcher.
Updating our problem matchers
To do what we need to do we’re going to need to add a problemMatcher section to the task and it’ll need to implement a full problemMatcher. Here’s the updated task for the web app:
{
    "type": "npm",
    "script": "start",
    "problemMatcher": {
        "owner": "custom",
        "pattern": {
            "regexp": "^([^s].*)((d+|d+,d+|d+,d+,d+,d+)):s+(error|warning|info)s+(TSd+)s*:s*(.*)$",
            "file": 1,
            "location": 2,
            "severity": 3,
            "code": 4,
            "message": 5
        },
        "fileLocation": "relative",
        "background": {
            "activeOnStart": true,
            "beginsPattern": "^.*",
            "endsPattern": "^.*To create a production build, use npm run build."
        }
    },
    "label": "npm: start",
    "detail": "react-scripts start",
    "isBackground": true
}
Since create-react-app doesn’t have a standard problemMatcher in VS Code (as far as I can tell anyway) we’re going to set the owner as custom and then use the TypeScript pattern (which I shamelessly stole from the docs :rolling_on_the_floor_laughing:). You might need to tweak the regex to get the VS Code problems list to work properly, but this will do for now. With our basic problemMatcher defined, we can add a background section to it and specify the endsPattern to match the string we’re looking for. You’ll also have to provide a beginsPattern, to which I’m lazy and just matching on anything.
Let’s do a similar thing for the API task:
{
    "type": "npm",
    "script": "start",
    "path": "api/",
    "problemMatcher": {
        "owner": "typescript",
        "pattern": {
            "regexp": "^([^s].*)((d+|d+,d+|d+,d+,d+,d+)):s+(error|warning|info)s+(TSd+)s*:s*(.*)$",
            "file": 1,
            "location": 2,
            "severity": 3,
            "code": 4,
            "message": 5
        },
        "background": {
            "activeOnStart": true,
            "beginsPattern": "^.*",
            "endsPattern": ".*For detailed output, run func with --verbose flag..*"
        }
    },
    "label": "npm: start - api",
    "detail": "npm-run-all --parallel start:host watch",
    "isBackground": true
}
Now, we can run the swa start task and everything will launch for us!

Conclusion
Azure Static Web Apps just keeps getting better and better. With the CLI, it’s super easy to run a local environment and not have to worry about things like CORS, making it closer to how the deployed app operates. And combining it with these VS Code tasks means that with a few key presses you can get it up and running.
I’ve added these tasks to the GitHub repo of my Auth0 demo app from the post on using Auth0 with Static Web Apps.
by Contributed | Jun 1, 2021 | Technology
This article is contributed. See the original author and article here.
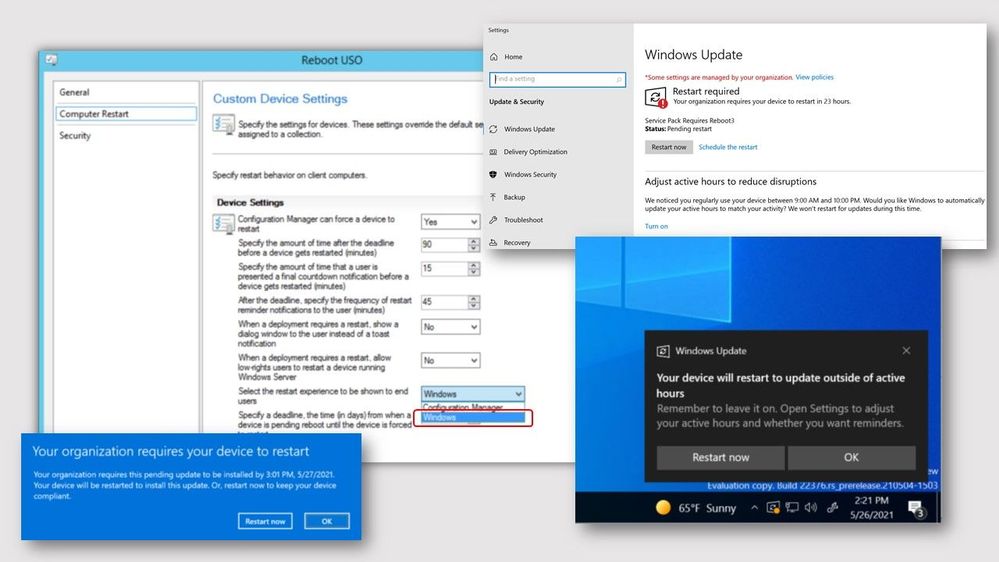
Update 2105.2 for the Technical Preview Branch of Microsoft Endpoint Configuration Manager has been released. When installing software updates from Configuration Manager, you can now choose to use the native Windows Update interface and restart experience. The client’s Windows Update Settings page will display the updates like they appear when using Windows Update for scanning. Restarts from software updates will also behave as though you’re using Windows Update.
screenshots of Windows native software update experience
To use this feature, client devices must be running Windows Insider build 21277 or later. To enable the Windows Update native experience:
- From the Administration workspace, select Client Settings in Configuration Manager.
- Select the Computer Restart group in Client Settings
- For the Select the restart experience to be shows to end users setting, choose the Windows option.
- If needed, you can change the number of days the device is allowed to be pending a restart before it’s forced using the following setting: Specify a deadline, the time (in days) from when a device is pending reboot until the device is forced to restart.
For more information, see Windows Update native experience for software updates.
This preview release also includes:
Send product feedback from error windows – Previously, if the Configuration Manager console reported an error in a separate window, you had to go back to the main console window to send feedback. In some cases, this action isn’t possible with other console windows open.
Starting in this release, error messages include a link to Report error to Microsoft. This action opens the standard “send a frown” window to provide feedback. It automatically includes details about the user interface and the error to better help Microsoft engineers diagnose the error. Aside from making it easier to send a frown, it also lets you include the full context of the error message when you share a screenshot.
Custom properties for devices – Many customers have other data that’s external to Configuration Manager but useful for deployment targeting, collection building, and reporting. This data is typically non-technical in nature, not discoverable on the client, and comes from a single external source. For example, a central IT Infrastructure Library (ITIL) system or asset database, which has some of the following device attributes:
- Physical location
- Organizational priority
- Category
- Cost center
- Department
Starting in this release, you can use the administration service to set this data on devices. You can then use the custom properties in Configuration Manager for reporting or to create collections.
Hardware inventory for client log settings – You can now inventory client log file settings such as log levels and size by enabling the new inventory class, Client Diagnostics (CCM_ClientDiagnostics). This behavior allows you to track settings that you change by the Client Diagnostics actions. This new inventory class isn’t enabled by default.
Simplified CMPivot permissions requirements – We’ve simplified the CMPivot permissions requirements. The new permissions are applicable for CMPivot standalone and CMPivot in the on-premises console. The following changes have been made:
- CMPivot no longer requires SMS Scripts read permission
- The default scope permission isn’t required.
Hierarchy approved console extensions don’t require signing – Starting in this technical preview, you can choose to allow unsigned hierarchy approved console extensions. You may need to allow unsigned console extensions due to an unsigned internally developed extension, or for testing your own custom extension in a lab.
Improvements to CMPivot – We’ve made the following improvements to CMPivot:
- Added a Key value to the Registry entity
- Added a new RegistryKey entity that returns all registry keys matching the given expression
- Added maxif and minif aggregators that can be used with the summarize operator
- Improvements to query autocomplete suggestions in the query editor
PowerShell release notes preview – These release notes summarize changes to the Configuration Manager PowerShell cmdlets in technical preview version 2105.2.
For more details and to view the full list of new features in this update, check out our Features in Configuration Manager technical preview version 2105.2 documentation.
Update 2105.2 for Technical Preview Branch is available in the Microsoft Endpoint Configuration Manager Technical Preview console. For new installations, the 2103 baseline version of Microsoft Endpoint Configuration Manager Technical Preview Branch is available on the Microsoft Evaluation Center. Technical Preview Branch releases give you an opportunity to try out new Configuration Manager features in a test environment before they are made generally available.
We would love to hear your thoughts about the latest Technical Preview! Send us feedback about product issues directly from the console and continue to share and vote on ideas about new features in Configuration Manager.
Thanks,
The Configuration Manager team
Configuration Manager Resources:
Documentation for Configuration Manager Technical Previews
Try the Configuration Manager Technical Preview Branch
Documentation for Configuration Manager
Configuration Manager Forums
Configuration Manager Support

Recent Comments