Azure CycleCloud – the simplest way to execute HPC on Azure

Azure CycleCloud – the simplest way to execute HPC on Azure

This article is contributed. See the original author and article here.

Accelerated computing.  Microsoft HPC continues to invest to deliver the broadest range of Accelerated and high-performance computing (HPC) capabilities in the public cloud. From InfiniBand-enabled Virtual Machine families for artificial intelligence and HPC, to Hyperscale services like Cray supercomputing, Azure enables customers to deliver the full spectrum of AI and machine learning applications.


Azure CycleCloud – the simplest way to execute HPC on Azure


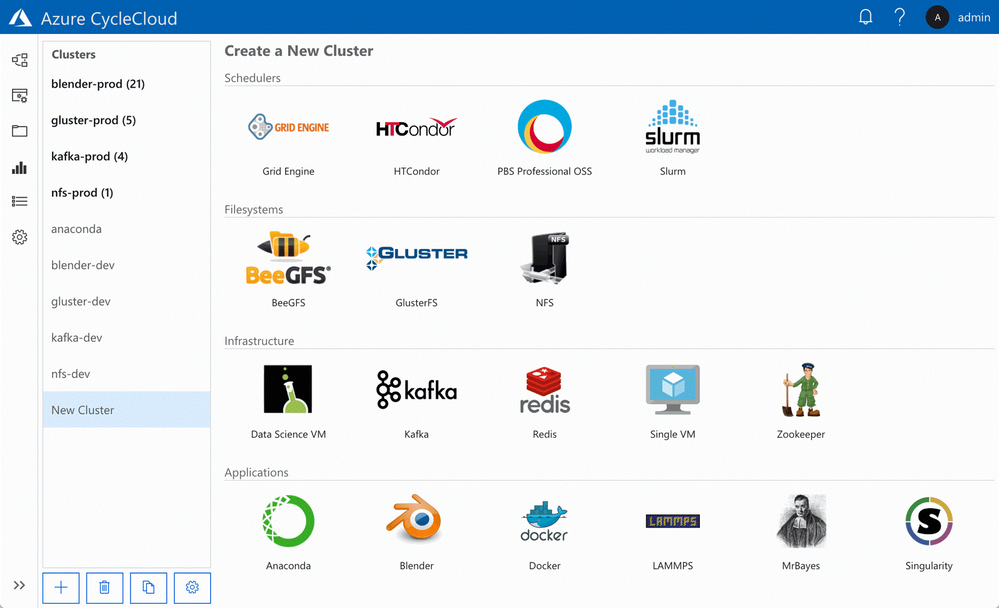
 Azure CycleCloud, a tool for creating, managing, operating, and optimizing HPC clusters of any scale in Azure. With Azure CycleCloud, we are making it even easier for everyone to deploy, use, and optimize HPC burst, hybrid, or cloud-only clusters. For users running traditional HPC clusters, using schedulers including SLURM, PBS Pro, Grid Engine, LSF, HPC Pack, or HTCondor, this will be the easiest way to get clusters up and running in the cloud, and manage the compute/data workflows, user access, and costs for their HPC workloads over time.


Cyclecloud.png


With a few clicks, HPC IT administrators can deploy high-performance clusters of compute, storage, filesystem, and application capability in Azure. Azure CycleCloud’s role-based policies and governance features make it easy for their organizations to deliver the hybrid compute power where needed while avoiding runaway costs. Users can rely on Azure CycleCloud to orchestrate their job and data workflows across these clusters.


NVIDIA GPU Cloud with Azure


As GPUs provide outstanding performance for AI and HPC, Microsoft Azure provides a variety of virtual machines enabled with NVIDIA GPUs. Starting today, Azure users and cloud developers have a new way to accelerate their AI and HPC workflows with powerful GPU-optimized software that takes full advantage of supported NVIDIA GPUs on Azure.


Containers from the NVIDIA GPU Cloud (NGC) container registry are now supported. The NGC container registry includes NVIDIA tuned, tested, and certified containers for deep learning software such as Microsoft Cognitive Toolkit, TensorFlow, PyTorch, and NVIDIA TensorRT. Through extensive integration and testing, NVIDIA creates an optimal software stack for each framework – including required operating system patches, NVIDIA deep learning libraries, and the NVIDIA CUDA Toolkit – to allow the containers to take full advantage of NVIDIA GPUs. The deep learning containers from NGC are refreshed monthly with the latest software and component updates.


NGC also provides fully tested, GPU-accelerated applications and visualization tools for HPC, such as NAMD, GROMACS, LAMMPS, ParaView, and VMD. These containers simplify deployment and get you up and running quickly with the latest features.


To make it easy to use NGC containers with Azure, a new image called NVIDIA GPU Cloud Image for Deep Learning and HPC is available on Azure Marketplace. This image provides a pre-configured environment for using containers from NGC on Azure. Containers from NGC on Azure NCv2, NCv3, and ND virtual machines can also be run with Azure Batch AI by following these GitHub instructions.To access NGC containers from this image, simply signup for a free account and then pull the containers into your Azure instance. 


Resources on Microsoft Learn


Saving Tweety with Azure Percept

Saving Tweety with Azure Percept

This article is contributed. See the original author and article here.

Goran Vuksic


Goran works as a Technical manager for Stratiteq Sweden, he is Microsoft AI MVP, he has 15 years of work experience in IT and wide knowledge about various technologies and programming languages. He worked on various projects for notable clients and projects he worked on have been featured many times on web sites like Forbes, The Next Web, NVIDIA Developer, TechCrunch, Macworld and others. In the last few years, he attended several hackathons and other competitions on which his skills and work were recognized and awarded. Goran is tech enthusiast, he writes technical blog posts and he likes to share his wide knowledge on different workshops and talks. You can connect with Goran on LinkedIn and follow him on Twitter.


Introduction


Azure Percept is an easy-to-use platform for creating edge AI solutions. Azure Percept Development Kit comes with an intelligent camera Azure Percept Vision. Services like Azure Cognitive Services, Azure Machine Learning, Azure Live Video Analytics, and many other works out of the box with Azure Percept. With the development kit you can set up proof of concepts in minutes, and integrate it with Azure AI and Azure IoT services. Overview of Azure Percept Development Kit can be found here, and on same link you can also find links how to set up your device.


blog-header.png


This post will show you how to create a simple project with Azure Percept Development Kit. I will use Tweety and Sylvester LEGO minifigures from Looney Tunes special edition. Idea is to train an AI model to be able to recognise Tweety and Sylvester, and find them amongst other LEGO minifigures. With a model that is able to tell where Tweety and Sylvester are we could keep Tweety safe, gor obvious reasons that Sylvester is always hungry and he should not be anywhere close to Tweety.


Azure Percept Studio


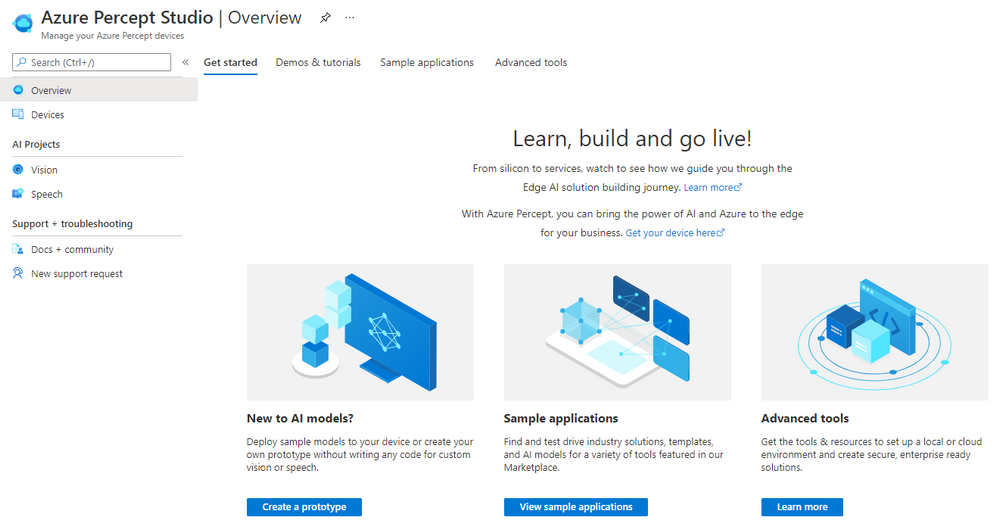
Azure Percept Studio makes it really easy to work with your Azure Percept, and it is the single launch point for creating edge AI models and solutions you want to develop.


blog-azure-portal.png


Interface will guide you in an intuitive way no matter if you are new to AI models and want to create a prototype, try out some sample applications or try out more advanced tools.


blog-percept-studio.png


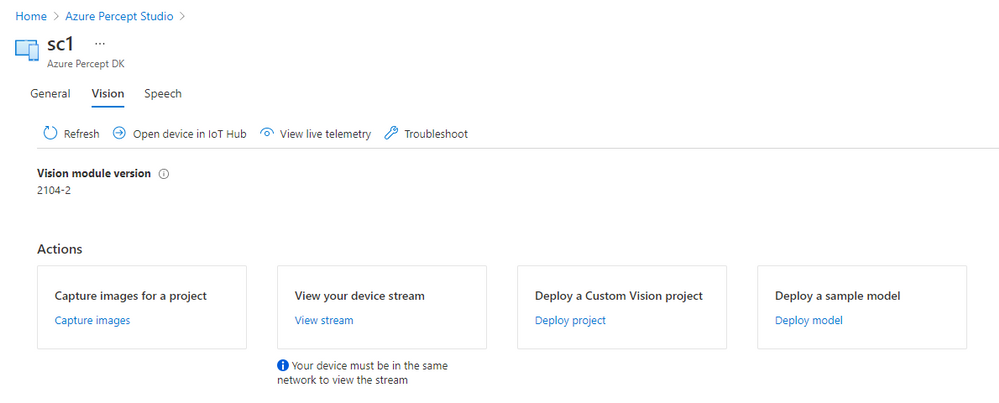
In left menu you can click on option “Devices” and overview of your Percept devices will appear. For each device you can see status is it connected, and you can click on it to view details. We will use second tab “Vision” for this project where you can capture images for your project, view device stream and deploy a custom model to the device.


blog-percept-device.png


Training the model


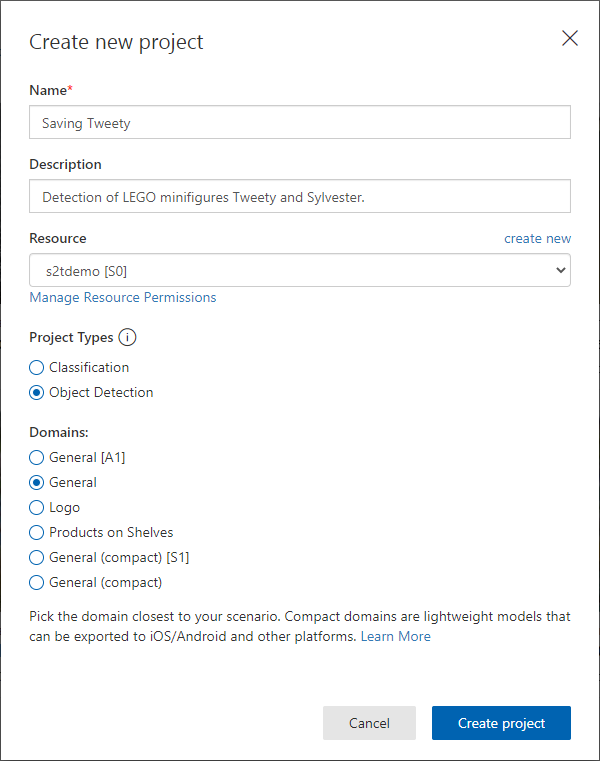
We want to create a custom model that will be able to recognise Tweety and Sylvester. You can open Custom Vision in a new tab, log in and create a new project. Give a name to your project, create a resource, select “Object detection” and “General” domain. Custom Vision project domains are explained here in more detail.


blog-custom-vision-new.png


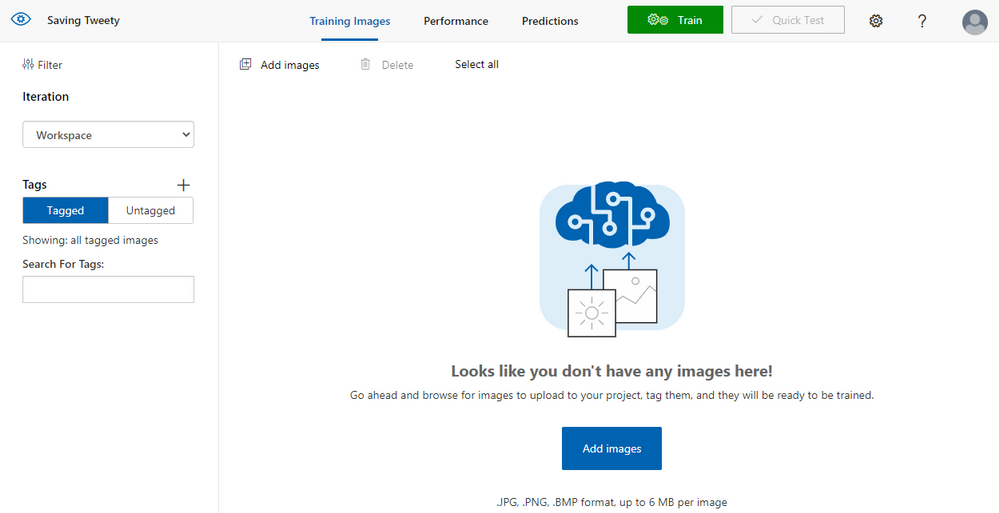
Images can also be added to the project from Azure Percept Studio, with option we have seen recently. If you are using that option you will be able to take pictures with Azure Percept Vision camera. You can also add and use any image that you prepared earlier.


blog-add-images.png


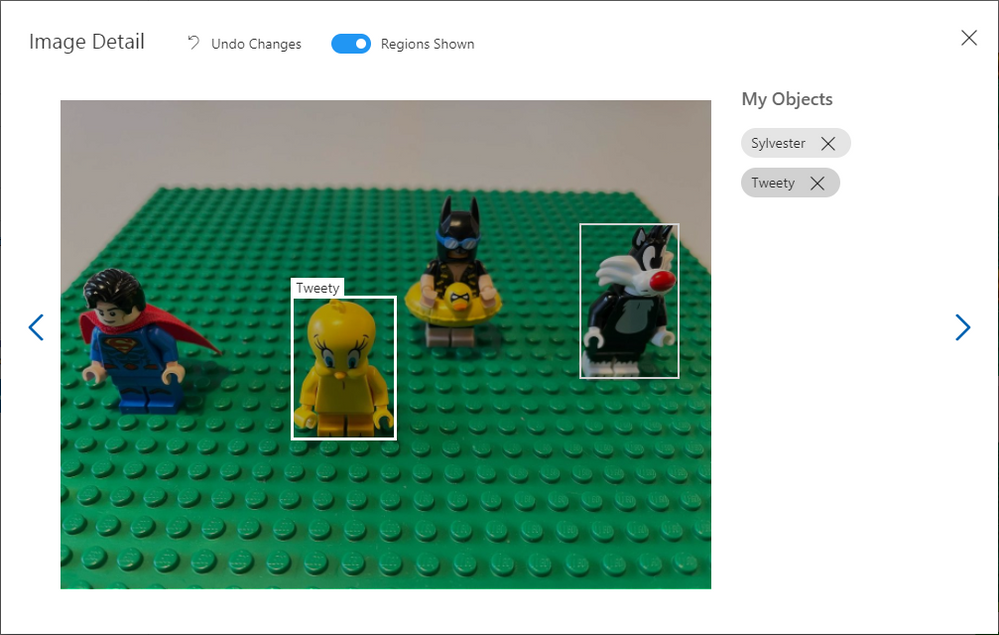
Once images are added, you need to tag them marking the objects your model will recognise. In this example I create two tags named “Sylvester” and “Tweety”. Minimum number of images you should add to train the model is 15, but for an AI model to actually be able to recognise objects like this you should add much more images.


blog-tagging.png


After you tagged the images select “Train” to train the model and you can choose option “Quick training”. In minute or two your model will be ready and you can go back to the Azure Percept Studio.


Testing the model


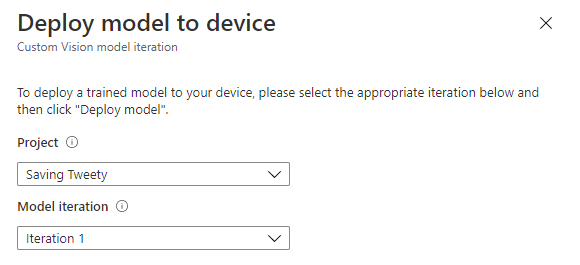
In Azure Percept Studio click option “Deploy a Custom Vision project” and select the model you just trained. You can also select specific model iteration if you trained the model several times.


percept-deploy-to-device.png


Once the model is deployed, you can click “View your device stream” to see live camera feed and test the model. Notification will appear in a few seconds when your stream is ready and you can open it in a separate tab.


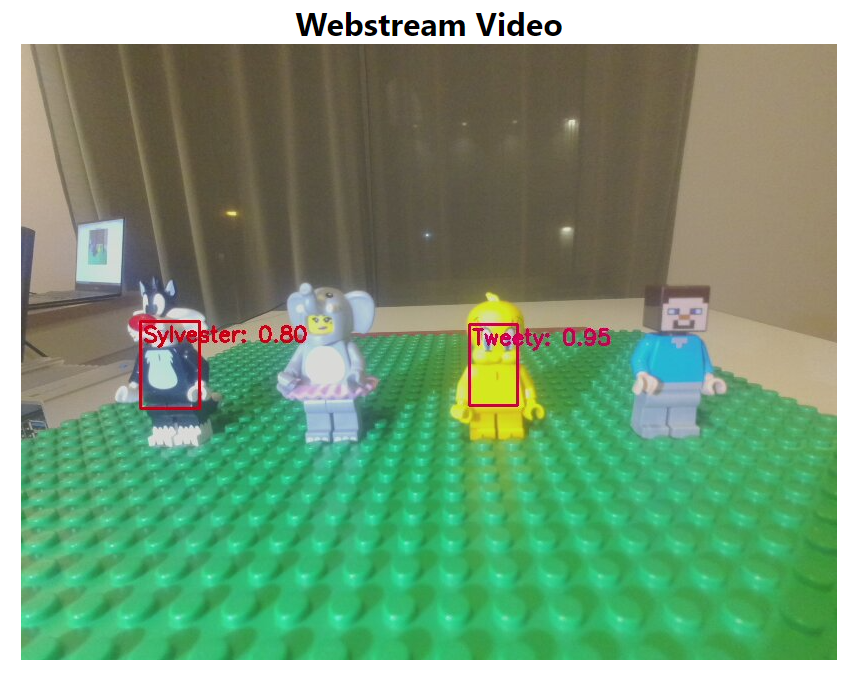
percept-webstream.png


Testing a model with a live stream is a great way to see how it actually performs, you can add different objects, position the camera in different angles and get a real idea of the performance. If your model does not have high enough accuracy or it false detects other objects, you can take more pictures, add them to Custom Vision, re-train the model and test new iteration to see how it works.


Summary


Through this article you have learned about Azure Percept Studio, how to train your Custom Vision model, how to deploy it to the Azure Percept device and test it via live stream. Now that you learned more about Azure you can claim your Azure Heroes Learner badge by scanning QR code on the following link (please note there are only 50 badges available).


Resources


Microsoft Learn Modules on Custom Vision AI 
Explore computer vision in Microsoft Azure – Learn | Microsoft Docs
Analyze images with the Computer Vision service – Learn | Microsoft Docs
Classify images with the Custom Vision service – Learn | Microsoft Docs
Detect objects in images with the Custom Vision service – Learn | Microsoft Docs


The new SCAN Operator: Process Mining in Azure Data Explorer

The new SCAN Operator: Process Mining in Azure Data Explorer

This article is contributed. See the original author and article here.

Introduction


Azure Data Explorer (ADX) is commonly used to store and analyze event logs of business processes. These logs are generated everywhere – applications emit events capturing user actions, IoT devices send sensors data, cloud services generate monitoring logs etc. Once the data is stored in ADX, it can be analyzed for insights. Kusto Query Language (KQL) has extensive set of operators and functions for various types of analysis, including relational operators (filtering, joining, aggregations etc.), time series analysis (anomaly detection, forecasting etc.), advanced plugins (root cause analysis, user analytics) and even extensibility to embed external Python/R packages. Today we are delighted to introduce the scan operator, adding native process mining and temporal analytics to ADX!


Process Mining


Process mining is a new emerging domain, dealing with analysis of events logs to discover the underlying process models, validate, and potentially improve them. In that context, an event contains at least process instance id, timestamp, and action. A process instance id (a.k.a. case id) might be identifier(s) of the specific user, device, session, or any other native partitioning of the events log. A process model describes a sequence of actions, commonly with time constraints, to achieve specific task. Some examples for process models:


  • Users login to a shopping web site, browse products, add to cart, check out, pay and logout.

  • A patient is admitted at a clinic, tested for pulse and blood pressure by the triage team, checked by the specialist, diagnosed, and dismissed.

  • A washing machine cycle: starting, weighing the laundry, filling water, heating, washing, rinsing, spinning, and finishing.


There are 3 classes of process mining techniques:


  1. Discovery – automatically extract process model(s) out of the raw event logs.

  2. Conformance checking – comparing existing process model with actual event log, detect and analyze discrepancies.

  3. Performance mining – enhance the existing process to improve performance – reduce time between steps, improve retention etc.


The ‘scan’ operator


The scan operator is arguably the most advanced analytics operator in ADX.  It extends ADX native analytics to include process mining, user analytics, recursive calculations and more. The user defines a process model in KQL, then feeds in a huge events log table. ADX scans it and extracts the instances (each one is an events sequence) conforming to that process model, filtering those deviating from it. The model definition syntax lets the user define sequential states and forward transition rules from the first to the last state. These states and rules are translated to a set of simple state machines that define the scan logic. Let’s review a few examples to understand the syntax, as well as its power and versatility for a wide range of scenarios.


Searching for ‘rallies’ of top stocks


Here we analyze historical prices of top tech stocks from 2019 till today. This period was interesting, from start of 2020 till today the market is impacted by the Covid-19 pandemic, still the overall trend of these stocks is positive. In the query below we look for longest sequences of increasing price per each stock. The following query is built by these steps:


  1. Pre-processing:

    • For each stock order the prices by time and calculate the daily change.


  2. Extracting sequences using the ‘scan’ operator:

    • A sequence starts when the price increases.

    • The sequence continues as long as the price increases or doesn’t change.

    • The sequence ends when the price decreases.


  3. Post-processing:

    • For each sequence delete the last event, as it contains the price decrease.

    • Summarize the length and delta per sequence.

    • For each stock extract the sequence with the biggest percentage increase.


TopStocksCleaned
| where Date >= datetime(2019-01-01) and Ticker in('AAPL', 'AMZN', 'GOOG', 'MSFT')
| partition by Ticker
(
    order by Date asc 
    | extend pDate=prev(Date), pAdjClose=prev(AdjClose)
    | extend delta = AdjClose - pAdjClose
    | scan with_match_id=m_id declare(down:bool=false, step:string) with 
    (
        //  if state of s1 is empty we require price increase, else continue as long as price doesn't decrease 
        step s1: delta >= 0 and (delta > 0 or isnotnull(s1.delta)) => step = 's1';
        //   exit the 'rally' when price decrease, also forcing a single match 
        step s2: delta < 0 and s2.down == false => down = true, step = 's2';
    )
)
| where step == 's1'   //  select only records with price increase
| summarize (start_date, start_AdjClose, start_delta)=arg_min(pDate, pAdjClose, delta), end_date=max(Date), trading_days=count(), total_delta=sum(delta) by Ticker, m_id
| extend delta_pct = total_delta*100.0/start_AdjClose
| summarize arg_max(delta_pct, *) by Ticker
| project Ticker, start_date, end_date, trading_days, delta_pct, start_AdjClose, total_delta
| order by delta_pct


Ticker


start_date


end_date


trading_days


delta_pct


start_AdjClose


total_delta


AAPL


2020-07-29


2020-08-07


7


20.752


93.75


19.455


AMZN


2020-04-13


2020-04-21


6


18.461


2040


376.610


MSFT


2020-02-28


2020-03-03


2


14.034


152.410


21.389


GOOG


2021-01-28


2021-02-03


4


12.422


1843.939


229.060


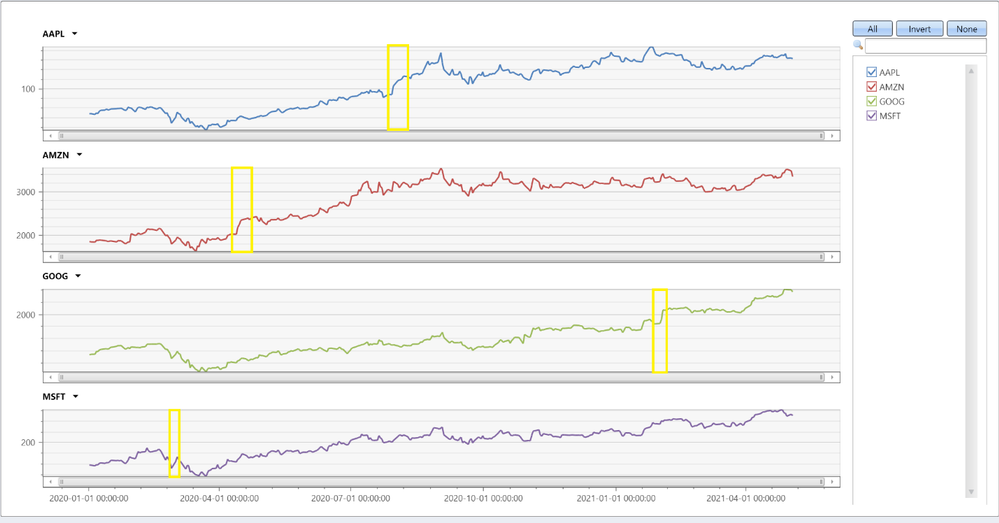
We can see that Apple had the longest and biggest rally, 7 consecutive trading days with almost 20% increase! Let’s chart all stocks:


TopStocksCleaned
| where Date >= datetime(2020-01-01) and Ticker in('AAPL', 'AMZN', 'GOOG', 'MSFT')
| project Ticker, Date, AdjClose
| evaluate pivot(Ticker, any(AdjClose))
| render timechart with(ysplit=panels)


adieldar_0-1621759543486.png


We can nicely see the biggest increases, yellow highlighted.


Analyzing users’ mitigations for failing KQL queries


In this example we analyze sequences of users’ queries following a failed one, trying to extract interesting insights. The following query is quite complex, its steps are:


  1. Pre-processing:

    • For each user order the queries by time.

    • Filter consecutive queries with less than a second gap – these are likely automated queries.


  2. Extracting sequences using the ‘scan’ operator:

    • Start a sequence by a query that was not completed successfully.

    • Continue the sequence until successful query or time out.

    • Each step updates the sequence length and the number of retries (of exactly the same query).


  3. Post-processing:

    • Aggregate sequences by user and retries only flag.

    • Final aggregation by sequences length, final state and retries flag.


let Kusteam = toscalar((KustoAll | summarize make_list(Email)));
let etime = datetime(2021-05-20);
let stime = etime - 14d;
let max_gap = 5m;           //  max time gap between user's consecutive queries to be grouped in the same sequence
let min_gap = 1s;           //  min time gap between user's consecutive queries, ignoring automated queries
//
QueryCompletion_v2
| where User in(Kusteam)
| where Timestamp between (stime..etime)
| partition hint.strategy=native by User (
    order by Timestamp asc
    | extend nTimestamp = next(Timestamp)
    | where nTimestamp - Timestamp >= min_gap   //  filter automated queries
    | scan with_match_id=m_id declare(step:string='empty', timeout:boolean=false, retries:long=0, SequenceLen:long=0) with 
    (
        step s1: State != 'Completed' => step = 'not completed', SequenceLen = s1.SequenceLen + 1, retries = s1.retries + iff(s1.Text == Text, 1, 0);
        step s2: s2.step == 'empty' and (State == 'Completed' or Timestamp - s1.Timestamp >= max_gap) =>
                 step = 'end', timeout = Timestamp - s1.Timestamp >= max_gap, SequenceLen = s1.SequenceLen + 1, retries = s1.retries + iff(s1.Text == Text, 1, 0);
    )
)
| where not(timeout) // these records are not related to the past sequence
| extend RetriesOnly = (retries == SequenceLen - 1), FinalState = State
| summarize arg_max(SequenceLen, FinalState) by User, m_id, RetriesOnly
| summarize SequenceNum = count() by SequenceLen, FinalState, RetriesOnly
| where SequenceLen > 1 and FinalState != 'Cancelled'
| order by FinalState asc, SequenceLen asc, RetriesOnly asc


Results:


SequenceLen


FinalState


RetriesOnly


SequenceNum


2


Completed


False


306


2


Completed


True


20


3


Completed


False


66


3


Completed


True


2


4


Completed


False


25


4


Completed


True


1


5


Completed


False


11


6


Completed


False


4


2


Failed


False


8


2


Failed


True


20


3


Failed


False


2


3


Failed


True


7


4


Failed


False


2


4


Failed


True


1


5


Failed


False


2


5


Failed


True


32


6


Failed


False


13


7


Failed


False


3


11


Failed


False


1


Let’s first look on sequences of 2 events, i.e. a failed query followed by a successful one or a time out. These sequences account for 354/526=67% of all sequences. We can see that 326/526=62% of the failures were resolved by a single follow-up query. Out of these, 306/326=94% queries completed successfully after modifying the query, while only 20/326=6% completed just by retrying the same query. Looking on sequences of 3 events, additional 68/526=12.9% of the failed queries were resolved, but retrying the same query twice is much less effective: only 2/68=2.9% succeeded. The last thing to note is that as the sequences become longer, the chance of successful completion decreases, only a few sequences of 6 queries end successfully, longer ones just continued to fail, until the users abandoned them.


Summary


In this short blog we have seen only 2 examples of ‘scan’, however the scope and power of this operator is far beyond these specific use cases. This operator is very effective for various scenarios, from simple fill forward table columns or calculating cumulative sums, through analyzing events preceding some failure for root cause analysis, and up to funnel analysis, rectifying obstacles in UX workflows, improving performance and beyond. Have a look at scan doc, where you can learn how to use it and review more interesting examples. Note that the scan operator is new, currently in preview, still you are very welcome to try it and share your feedback with us!


Join Azure Data Explorer sessions at Microsoft Build 2021, Digital Event

This article is contributed. See the original author and article here.

Join us for the Microsoft Build 2-day, digital event to expand your skillset, find technical solutions, and innovate for the challenges of tomorrow.


conference


sessionid


session_title


session_type


owner


participants


URL


level


session_location


starttime


duration


time_and_duration


kusto_affinity


Build 2021


CON-PRT157


Roundtable: Monitoring and managing your Azure Data Explorer deployments


Roundtable


Gabi Lehner


Guy Reginiano, Guy Yehudy, Pankaj Suri, Saeed Copty


https://sessions.mybuild.microsoft.com/sessions/details/4290398d-dfdf-467d-955a-5e2b8ecfe76c


200


Online


2021-05-26 08:30:00.0000000


60


Wednesday, May 26 8:30 AM – 9:30 AM GMT


Focused


Build 2021


CON-PRT103


Roundtable: Advanced Kusto query language topics


Roundtable


Avner Aharoni


Alexander Sloutsky, Tzvia Gitlin-Troyna


https://sessions.mybuild.microsoft.com/sessions/details/4d4887e9-f08d-4f88-99ac-41e5feb869e7


200


Online


2021-05-26 08:30:00.0000000


60


Wednesday, May 26 8:30 AM – 9:30 AM GMT


Focused


Build 2021


CON-PRT130


Roundtable: Data exploration and visualization with Azure Data Explorer


Roundtable


Michal Bar


Gabi Lehner


https://sessions.mybuild.microsoft.com/sessions/details/8a385a82-07a9-4f82-84dc-50649dee54e9


200


Online


2021-05-26 12:30:00.0000000


60


Wednesday, May 26 12:30 AM – 1:30 PM GMT


Focused


Build 2021


CON-PRT140


Roundtable: Industrial IoT analytics with Azure Time Series Insights


Roundtable


Chris Novak, Ellick Sung


https://sessions.mybuild.microsoft.com/sessions/details/8e2ef0a2-af8a-4b4f-80cd-063ba6ad181d


200


Online


2021-05-26 16:30:00.0000000


60


Wednesday, May 26 4:30 PM – 5:30 PM GMT


Focused


Build 2021


CON-PRT113


Roundtable: Azure Data Explorer Dashboards


Roundtable


Gabi Lehner


Rony Liderman


https://sessions.mybuild.microsoft.com/sessions/details/28beaa42-8b70-4e09-8a96-782fa6b8ae09


200


Online


2021-05-27 17:00:00.0000000


60


Thursday, May 27 5:00 PM – 6:00 PM GMT


Focused


Build 2021


CON-PRT142


Roundtable: Ingestion data into Azure Data Explorer


Roundtable


Tzvia Gitlin-Troyna


Vladik Branevich


https://sessions.mybuild.microsoft.com/sessions/details/e4df3b64-76c4-4c49-8396-48e0b6303c04


200


Online


2021-05-27 17:00:00.0000000


60


Thursday, May 27 5:00 PM – 6:00 PM GMT


Focused


Postgres with columnar compression in Hyperscale (Citus) on Azure

Postgres with columnar compression in Hyperscale (Citus) on Azure

This article is contributed. See the original author and article here.


Citus Columnar, one of the big new features in Citus 10, is now available in preview in Hyperscale (Citus) on our Azure Database for PostgreSQL managed service! You can check out the Citus 10 superpowers post to learn more about the rest of the Citus 10 goodness.


Citus is an open source extension to Postgres (not a fork) that enables horizontal scale, but offers other great features, too.


This post will walk you through how to create and use columnar tables in Hyperscale (Citus). You can also take a look at the columnar docs. Citus Columnar can be used with or without the scale-out features of Citus.


First some background: Postgres typically stores data using the heap access method, which is row-based storage. Row-based tables are good for transactional workloads, but can cause excessive IO for some analytic queries.


Columnar storage is a new way to store data in a Postgres table. Columnar groups data together by column instead of by row; and compresses the data, too. Arranging data by column tends to compress well, and it also means that queries can skip over columns they don’t need. Columnar dramatically reduces the IO needed to answer a typical analytic query—often by 10X!


Let’s check it out!


Postgres-elephant-on-stack-of-books-blue-background-1920x1080.jpg


Quick Start for Columnar in Hyperscale (Citus)


The quickest way to get up and running with Citus Columnar is in the cloud, by selecting Hyperscale (Citus) when provisioning an Azure Database for PostgreSQL server. You can follow the quickstart guide in the Azure docs.


Make sure to select PostgreSQL server version 13 (if not selectable, check the box “Enable Preview Features” in East US):
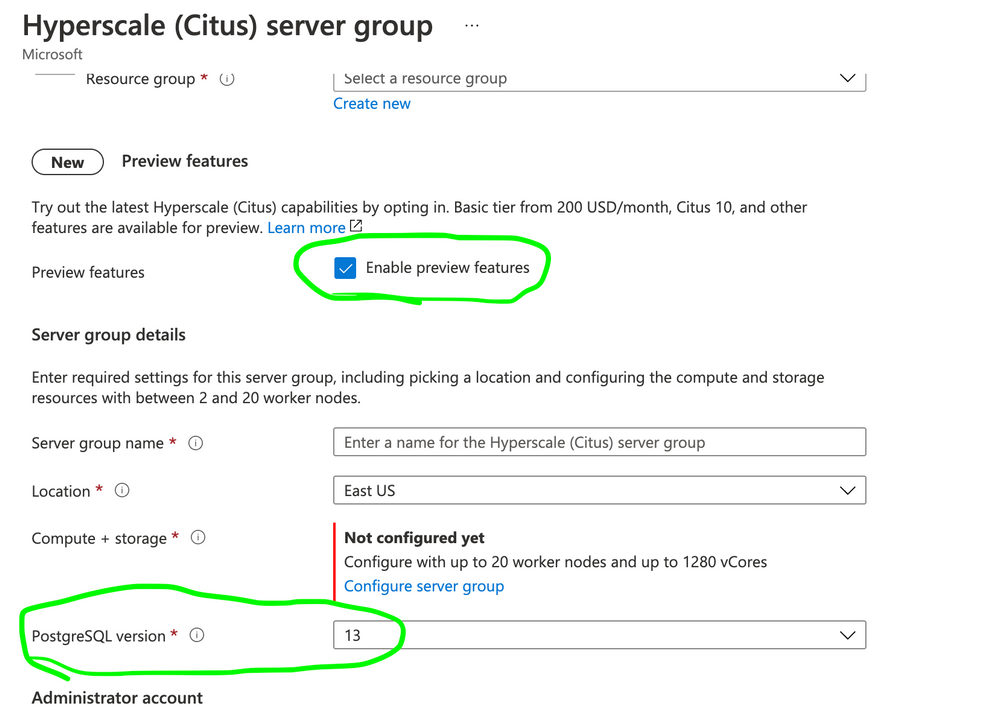


Figure 1: Screenshot from the Azure Portal, showing the Preview features checkbox for Hyperscale (Citus), plus where to select the PostgreSQL version.Figure 1: Screenshot from the Azure Portal, showing the Preview features checkbox for Hyperscale (Citus), plus where to select the PostgreSQL version.


Next, configure the server group:
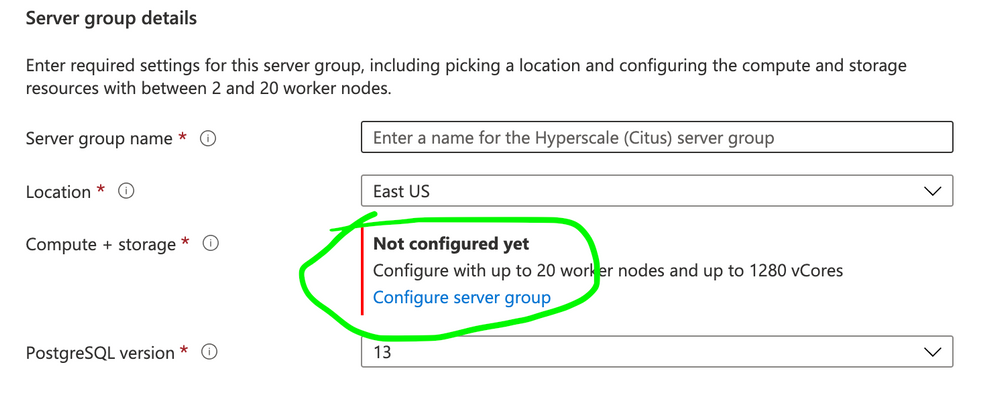


Figure 2: Screenshot from the Azure Portal, showing where to click the "Configure server group".Figure 2: Screenshot from the Azure Portal, showing where to click the “Configure server group”.


For simplicity, choose the Basic Tier:
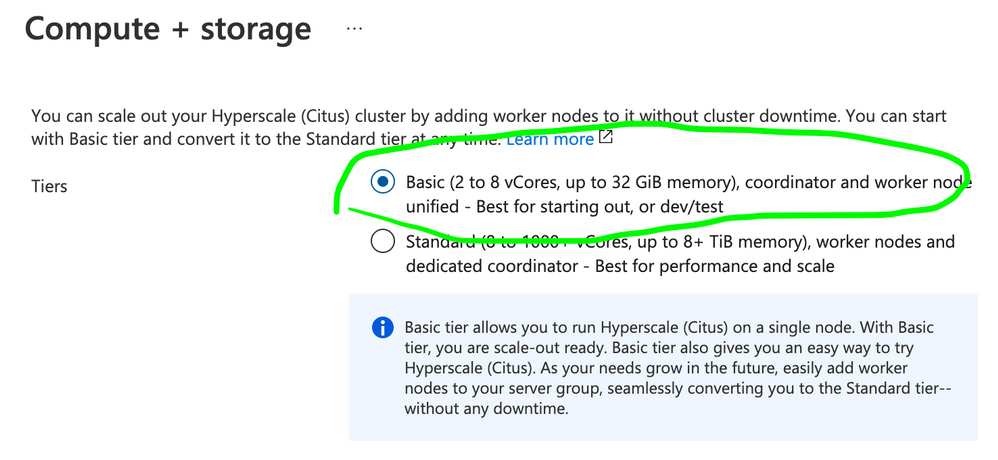


Figure 3: Screenshot from the Compute + storage screen, showing the Basic tier and Standard tier radio buttons. To use shard Postgres on a single node, choose Basic tier.Figure 3: Screenshot from the Compute + storage screen, showing the Basic tier and Standard tier radio buttons. To use shard Postgres on a single node, choose Basic tier.


Click Save, and fill out the rest of the required fields. Then move to the “Networking” tab and configure it. For simplicity, click “Add current client IP address”:
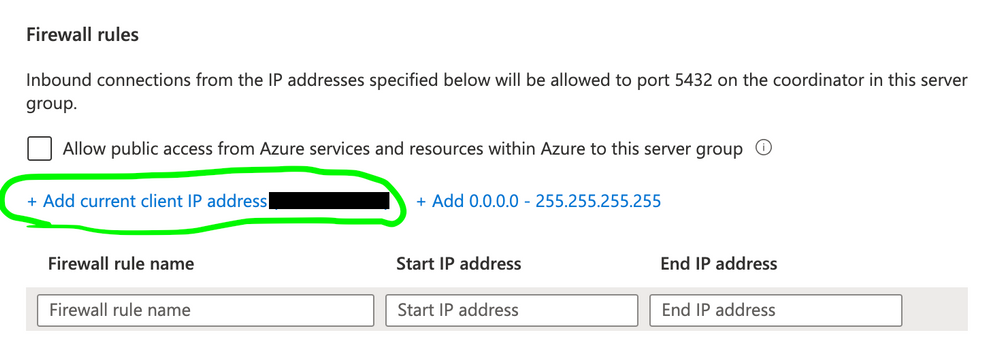


Figure 4: For firewall rules, add current client IP address.Figure 4: For firewall rules, add current client IP address.


Configure anything else you’d like, then click “Review and Create”, and then “Create”.


After the deployment finishes, click “Go to resource”, and copy the coordinator name (hostname).


I’ll be using the psql client for these examples, to make use of the backslash commands (e.g. d+, timing on). If using another client, you can omit the commands beginning with , which are just informational and not necessary for functionality.


psql -h $COORDINATOR_NAME citus citus


--
-- Like all Postgres extensions, citus needs to be enabled
-- for this database.
--
CREATE EXTENSION IF NOT EXISTS citus;

--
-- Make an ordinary table, which is row-based storage, and a
-- columnar table.
--
CREATE TABLE simple_row(i INT8);
CREATE TABLE simple_columnar(i INT8) USING columnar;

--
-- Columnar tables act like row tables
--
INSERT INTO simple_row SELECT generate_series(1,100000);
INSERT INTO simple_columnar SELECT generate_series(1,100000);
SELECT AVG(i) FROM simple_row;
SELECT AVG(i) FROM simple_columnar;


Notice the “Access Method” when describing the table in psql:


d+ simple_row
                                Table "public.simple_row"
 Column |  Type  | Collation | Nullable | Default | Storage | Stats target | Description
--------+--------+-----------+----------+---------+---------+--------------+-------------
 i      | bigint |           |          |         | plain   |              |
Access method: heap

d+ simple_columnar
                             Table "public.simple_columnar"
 Column |  Type  | Collation | Nullable | Default | Storage | Stats target | Description
--------+--------+-----------+----------+---------+---------+--------------+-------------
 i      | bigint |           |          |         | plain   |              |
Access method: columnar


The default Access Method is heap, which means it’s a plain Postgres table, which is row-based storage. The columnar table has Access Method columnar.


Citus Columnar Video Demo


We made this video demo of Citus Columnar—using Citus open source—to help you to see:


  1. How the query on the row table was so slow that I needed to skip ahead, while the query on the columnar table finished quickly.

  2. Better visualizations of partitioning, that make it easy to see how columnar and partitioning work together.

  3. The cool turtle in the background!


Figure 5: Two-part video demo of using Columnar with Citus open source.Figure 5: Two-part video demo of using Columnar with Citus open source.


Watch how Citus 10 brings columnar to Postgres!


What are the Benefits of Columnar?


  • Compression reduces storage requirements

  • Compression reduces the IO needed to scan the table

  • Projection Pushdown means that queries can skip over the columns that they don’t need, further reducing IO

  • Chunk Group Filtering allows queries to skip over Chunk Groups of data if the metadata indicates that none of the data in the chunk group will match the predicate. In other words, for certain kinds of queries and data sets, it can skip past a lot of the data quickly, without even decompressing it!


All of these together mean faster queries and lower costs!


Let’s See the Performance of Columnar in Hyperscale (Citus)


Here’s a microbenchmark to show off what columnar can do. This is a “columnar friendly” use case—a wide table, and a query that only reads a few of the columns.


This benchmark illustrates two benefits of columnar for PostgreSQL:


  • Reduced IO due to compression

  • Reduced IO because it skips over the columns not needed to answer the query


Configuration


  • Azure Database for PostgreSQL Hyperscale (Citus)

  • Citus v10.0.3

  • PostgreSQL version 13

  • 2 vCores

  • 128 GiB storage


Schema

CREATE TABLE perf_row(
  c00 int8, c01 int8, c02 int8, c03 int8, c04 int8, c05 int8, c06 int8, c07 int8, c08 int8, c09 int8,
  c10 int8, c11 int8, c12 int8, c13 int8, c14 int8, c15 int8, c16 int8, c17 int8, c18 int8, c19 int8,
  c20 int8, c21 int8, c22 int8, c23 int8, c24 int8, c25 int8, c26 int8, c27 int8, c28 int8, c29 int8,
  c30 int8, c31 int8, c32 int8, c33 int8, c34 int8, c35 int8, c36 int8, c37 int8, c38 int8, c39 int8,
  c40 int8, c41 int8, c42 int8, c43 int8, c44 int8, c45 int8, c46 int8, c47 int8, c48 int8, c49 int8,
  c50 int8, c51 int8, c52 int8, c53 int8, c54 int8, c55 int8, c56 int8, c57 int8, c58 int8, c59 int8,
  c60 int8, c61 int8, c62 int8, c63 int8, c64 int8, c65 int8, c66 int8, c67 int8, c68 int8, c69 int8,
  c70 int8, c71 int8, c72 int8, c73 int8, c74 int8, c75 int8, c76 int8, c77 int8, c78 int8, c79 int8,
  c80 int8, c81 int8, c82 int8, c83 int8, c84 int8, c85 int8, c86 int8, c87 int8, c88 int8, c89 int8,
  c90 int8, c91 int8, c92 int8, c93 int8, c94 int8, c95 int8, c96 int8, c97 int8, c98 int8, c99 int8
);

CREATE TABLE perf_columnar(LIKE perf_row) USING COLUMNAR;


Data Load

timing on

INSERT INTO perf_row
  SELECT
    g % 00500, g % 01000, g % 01500, g % 02000, g % 02500, g % 03000, g % 03500, g % 04000, g % 04500, g % 05000,
    g % 05500, g % 06000, g % 06500, g % 07000, g % 07500, g % 08000, g % 08500, g % 09000, g % 09500, g % 10000,
    g % 10500, g % 11000, g % 11500, g % 12000, g % 12500, g % 13000, g % 13500, g % 14000, g % 14500, g % 15000,
    g % 15500, g % 16000, g % 16500, g % 17000, g % 17500, g % 18000, g % 18500, g % 19000, g % 19500, g % 20000,
    g % 20500, g % 21000, g % 21500, g % 22000, g % 22500, g % 23000, g % 23500, g % 24000, g % 24500, g % 25000,
    g % 25500, g % 26000, g % 26500, g % 27000, g % 27500, g % 28000, g % 28500, g % 29000, g % 29500, g % 30000,
    g % 30500, g % 31000, g % 31500, g % 32000, g % 32500, g % 33000, g % 33500, g % 34000, g % 34500, g % 35000,
    g % 35500, g % 36000, g % 36500, g % 37000, g % 37500, g % 38000, g % 38500, g % 39000, g % 39500, g % 40000,
    g % 40500, g % 41000, g % 41500, g % 42000, g % 42500, g % 43000, g % 43500, g % 44000, g % 44500, g % 45000,
    g % 45500, g % 46000, g % 46500, g % 47000, g % 47500, g % 48000, g % 48500, g % 49000, g % 49500, g % 50000
  FROM generate_series(1,50000000) g;

INSERT INTO perf_columnar
  SELECT
    g % 00500, g % 01000, g % 01500, g % 02000, g % 02500, g % 03000, g % 03500, g % 04000, g % 04500, g % 05000,
    g % 05500, g % 06000, g % 06500, g % 07000, g % 07500, g % 08000, g % 08500, g % 09000, g % 09500, g % 10000,
    g % 10500, g % 11000, g % 11500, g % 12000, g % 12500, g % 13000, g % 13500, g % 14000, g % 14500, g % 15000,
    g % 15500, g % 16000, g % 16500, g % 17000, g % 17500, g % 18000, g % 18500, g % 19000, g % 19500, g % 20000,
    g % 20500, g % 21000, g % 21500, g % 22000, g % 22500, g % 23000, g % 23500, g % 24000, g % 24500, g % 25000,
    g % 25500, g % 26000, g % 26500, g % 27000, g % 27500, g % 28000, g % 28500, g % 29000, g % 29500, g % 30000,
    g % 30500, g % 31000, g % 31500, g % 32000, g % 32500, g % 33000, g % 33500, g % 34000, g % 34500, g % 35000,
    g % 35500, g % 36000, g % 36500, g % 37000, g % 37500, g % 38000, g % 38500, g % 39000, g % 39500, g % 40000,
    g % 40500, g % 41000, g % 41500, g % 42000, g % 42500, g % 43000, g % 43500, g % 44000, g % 44500, g % 45000,
    g % 45500, g % 46000, g % 46500, g % 47000, g % 47500, g % 48000, g % 48500, g % 49000, g % 49500, g % 50000
  FROM generate_series(1,50000000) g;

VACUUM (FREEZE, ANALYZE) perf_row;
VACUUM (FREEZE, ANALYZE) perf_columnar;

-- checkpoint if superuser; otherwise wait for system to settle
CHECKPOINT; CHECKPOINT;


The row table loaded in 2274s, while the columnar table loaded in 1111s for a speedup of 2X. Load speed is not always better with columnar, but columnar does have the advantage when the system is IO-bound.


Compression Ratio


For this data, you can see a compression ratio of about 7X when using Columnar.


SELECT pg_total_relation_size('perf_row')::numeric/
       pg_total_relation_size('perf_columnar') AS compression_ratio;
 compression_ratio  
--------------------
 6.7394916300510456
(1 row)


(Note: the compression ratio varies depending on the version of the compression library. Earlier versions of zstd showed a better compression ratio of better than 8X. I have filed an issue with the zstd project in case it’s a bug that can be fixed.)


We can also get some information from VACUUM VERBOSE:


VACUUM VERBOSE perf_columnar;
INFO:  statistics for "perf_columnar":
storage id: 10000000003
total file size: 6754770944, total data size: 6733594337
compression rate: 6.03x
total row count: 50000000, stripe count: 334, average rows per stripe: 149700
chunk count: 500000, containing data for dropped columns: 0, zstd compressed: 500000

VACUUM


Notice that there are 334 stripes. Stripes are the unit of a data load/write. By default, each stripe can hold up to 150,000 tuples.


By default, data is compressed with zstd compression. The compression rate calculated by VACUUM VERBOSE is slightly different than what we saw above, because it considers only the average compression ratio of the data, and doesn’t account for metadata (like visibility information).


Queries


Now let’s run a couple SQL queries. We will use EXPLAIN ANALYZE so that we can see the details in addition to the overall runtime. Timings are taken from the median of three consecutive runs.


Notice that only a 3 out of 100 columns are necessary to answer this query.


--
-- Parallel query actually slows down the query on the row table in this example, so disable it.
-- Columnar doesn't support parallel query.
--
SET max_parallel_workers_per_gather = 0;

EXPLAIN (ANALYZE, BUFFERS) SELECT c00, SUM(c29), AVG(c71) FROM perf_row GROUP BY c00;
                                                            QUERY PLAN                                                                                                       
----------------------------------------------------------------------------------------------------------------------------------                                           
 HashAggregate  (cost=6430556.07..6430563.57 rows=500 width=72) (actual time=449720.051..449720.570 rows=500 loops=1)                                                        
   Group Key: c00                                                                     
   Batches: 1  Memory Usage: 169kB                                                                                                                                           
   Buffers: shared hit=32 read=5555524
   I/O Timings: read=411407.314                                                                                                                                              
   ->  Seq Scan on perf_row  (cost=0.00..6055556.04 rows=50000004 width=24) (actual time=0.136..429496.825 rows=50000000 loops=1)                                            
         Buffers: shared hit=32 read=5555524                                                                                                                                 
         I/O Timings: read=411407.314                                                 
 Planning:                             
   Buffers: shared hit=4      
 Planning Time: 0.156 ms                                                                                                                                                     
 JIT:                                                                                 
   Functions: 7                                                                                                                                                              
   Options: Inlining true, Optimization true, Expressions true, Deforming true                                                                                               
   Timing: Generation 1.852 ms, Inlining 21.516 ms, Optimization 138.386 ms, Emission 67.720 ms, Total 229.474 ms                                                            
 Execution Time: 449722.605 ms                                                                                                                                               
(16 rows)                                                                                                                                                                    

EXPLAIN (ANALYZE, BUFFERS) SELECT c00, SUM(c29), AVG(c71) FROM perf_columnar GROUP BY c00;
                                                                      QUERY PLAN                                                                       
------------------------------------------------------------------------------------------------------------------------------------------------------
 HashAggregate  (cost=399659.16..399662.16 rows=200 width=72) (actual time=20688.895..20689.190 rows=500 loops=1)
   Group Key: c00
   Batches: 1  Memory Usage: 185kB
   Buffers: shared hit=109765
   ->  Custom Scan (ColumnarScan) on perf_columnar  (cost=0.00..24659.16 rows=50000000 width=24) (actual time=6.285..10261.578 rows=50000000 loops=1)
         Columnar Chunk Groups Removed by Filter: 0
         Buffers: shared hit=109765
 Planning:
   Buffers: shared hit=20
 Planning Time: 0.682 ms
 JIT:
   Functions: 6
   Options: Inlining false, Optimization false, Expressions true, Deforming true
   Timing: Generation 1.349 ms, Inlining 0.000 ms, Optimization 0.234 ms, Emission 4.110 ms, Total 5.692 ms
 Execution Time: 20690.686 ms
(15 rows)


We see a dramatic difference in the overall buffers read, which results in a dramatic difference in the runtime:


Storage Columnar Speedup
Row 450s  
Columnar 21s 21X


What are the Limitations?


These limitations are not set in stone, and we look forward to working on them in the future:


  • No UPDATE or DELETE support

  • No index support

  • No logical replication or logical decoding support

  • See more limitations in the columnar README


This means that, as of Citus 10 in Hyperscale (Citus), columnar should be used for append-only tables that are used for analytic queries. Even if UPDATE/DELETE are supported in the future, UPDATE & DELETE will not be as efficient as they are on row-based storage, so columnar is not a good fit for many transactional workloads. However, you can pick and choose columnar where it works best, and use row tables where they work best, to get the benefits of both.


Hybrid Columnar and Row tables with Range Partitioning


A useful way to take advantage of Citus Columnar is when you combine it with native range partitioning. Using columnar with partitioning helps to overcome the limitation on updates and deletes, by using a mix of row and columnar partitions within the same partitioned table.


Normally, range partitioning is used for time-based partitioning. Often, you have one or two recent “active” partitions that are still being updated, and then many older partitions that are rarely updated but still queried. In this case the one or two active partitions can be row-based storage to allow updates, and the older partitions can be converted to columnar storage to benefit from compression and scan speed.


CREATE TABLE events(ts timestamptz, i int, n numeric, s text)
  PARTITION BY RANGE (ts);

CREATE TABLE events_2021_jan PARTITION OF events
  FOR VALUES FROM ('2021-01-01') TO ('2021-02-01');

CREATE TABLE events_2021_feb PARTITION OF events
  FOR VALUES FROM ('2021-02-01') TO ('2021-03-01');

INSERT INTO events SELECT
    '2021-01-01'::timestamptz + '0.45 seconds'::interval * g,
    g,
    g*pi(),
    'number: ' || g::text
    FROM generate_series(1,10000000) g;

VACUUM (FREEZE, ANALYZE) events_2021_feb;


Later, when you’re ready to “columnarize” the older January partition, you can use this Citus-provided function to convert the access method from row to columnar storage.


SELECT alter_table_set_access_method('events_2021_jan', 'columnar');
VACUUM (FREEZE, ANALYZE) events_2021_jan;

-- checkpoint if superuser; otherwise wait for system to settle
CHECKPOINT; CHECKPOINT;


Now you can see that the January partition is columnar, and the February partition is row storage (heap).


d+ events_2021_jan
                                       Table "public.events_2021_jan"
 Column |           Type           | Collation | Nullable | Default | Storage  | Stats target | Description
--------+--------------------------+-----------+----------+---------+----------+--------------+-------------
 ts     | timestamp with time zone |           |          |         | plain    |              |
 i      | integer                  |           |          |         | plain    |              |
 n      | numeric                  |           |          |         | main     |              |
 s      | text                     |           |          |         | extended |              |
Partition of: events FOR VALUES FROM ('2021-01-01 00:00:00+00') TO ('2021-02-01 00:00:00+00')
Partition constraint: ((ts IS NOT NULL) AND (ts >= '2021-01-01 00:00:00+00'::timestamp with time zone) AND (ts < '2021-02-01 00:00:00+00'::timestamp with time zone))
Access method: columnar

d+ events_2021_feb
                                      Table "public.events_2021_feb"
 Column |           Type           | Collation | Nullable | Default | Storage  | Stats target | Description
--------+--------------------------+-----------+----------+---------+----------+--------------+-------------
 ts     | timestamp with time zone |           |          |         | plain    |              |
 i      | integer                  |           |          |         | plain    |              |
 n      | numeric                  |           |          |         | main     |              |
 s      | text                     |           |          |         | extended |              |
Partition of: events FOR VALUES FROM ('2021-02-01 00:00:00+00') TO ('2021-03-01 00:00:00+00')
Partition constraint: ((ts IS NOT NULL) AND (ts >= '2021-02-01 00:00:00+00'::timestamp with time zone) AND (ts < '2021-03-01 00:00:00+00'::timestamp with time zone))
Access method: heap


And they each have about half the rows. But even though the January partition has more rows, it’s much smaller due to columnar compression:


SELECT COUNT(*) FROM events; -- parent table scans both partitions
  count
----------
 10000000
(1 row)

SELECT COUNT(*) FROM events_2021_jan;
  count
---------
 5951999
(1 row)

SELECT COUNT(*) FROM events_2021_feb;
  count
---------
 4048001
(1 row)

SELECT pg_size_pretty(pg_relation_size('events_2021_jan'));
 pg_size_pretty
----------------
 69 MB
(1 row)

SELECT pg_size_pretty(pg_relation_size('events_2021_feb'));
 pg_size_pretty
----------------
 264 MB
(1 row)


What is Chunk Group Filtering?


Let’s run a query for a particular hour within the January partition of the events table.


EXPLAIN (ANALYZE,BUFFERS)
SELECT SUM(n)
FROM events_2021_jan
  WHERE ts >= '2021-01-11 01:00'::timestamptz AND
        ts < '2021-01-11 02:00'::timestamptz;
                                                                 QUERY PLAN
--------------------------------------------------------------------------------------------------------------------------------------------
 Aggregate  (cost=4438.09..4438.10 rows=1 width=32) (actual time=8.356..8.357 rows=1 loops=1)
   Buffers: shared hit=2922 read=2
   ->  Custom Scan (ColumnarScan) on events_2021_jan  (cost=0.00..4418.55 rows=7815 width=11) (actual time=2.998..7.703 rows=8000 loops=1)
         Filter: ((ts >= '2021-01-11 01:00:00+00'::timestamp with time zone) AND (ts < '2021-01-11 02:00:00+00'::timestamp with time zone))
         Rows Removed by Filter: 12000
         Columnar Chunk Groups Removed by Filter: 594
         Buffers: shared hit=2922 read=2
 Planning:
   Buffers: shared hit=27 dirtied=2
 Planning Time: 0.233 ms
 Execution Time: 8.380 ms
(11 rows)


Notice Columnar Chunk Groups Removed by Filter: 594.


First, we need some terminology to understand this:


  • Stripe: all loads into a columnar table are broken into stripes of 150000 rows (by default). The larger a stripe, the more sequential access when reading a given column.

  • Chunk Group: Stripes are broken down further into Chunk Groups of 10000 rows (by default).

  • Chunk: Each Chunk Group consists of one Chunk for each column. A Chunk is the unit of compression, and the min/max is tracked for each chunk to enable Chunk Group Filtering.

  • Chunk Group Filtering: When a query’s WHERE clause can’t possibly match any of the tuples in a Chunk, and we know that by the min/max values of the chunk, then Chunk Group Filtering will simply skip over the whole Chunk Group without decompressing any of the Chunks in the Chunk Group.


You can see above that 594 Chunk Groups were filtered out, which means that 5931999 rows were filtered out without needing to fetch or decompress the data. Only 2 Chunk Groups (20000 rows) needed to be actually fetched and decompressed, which is why the query took only milliseconds.


How is Citus Columnar connected to Citus?


Citus Columnar is a new feature that we’ve introduced in Citus 10. Now that Citus 10 is available in preview in Hyperscale (Citus), as long as you’ve turned on the preview features, you can now create Postgres tables with Hyperscale (Citus) with the new USING columnar syntax, and you’re ready to go (of course, read the docs, too!).


Citus is known for its ability to scale Postgres. Importantly, you can use Columnar with or without the Citus scale-out features. Columnar is a great complement to typical Citus use cases, but you can pick and choose whether to use Citus Columnar on a single node, or as part of a distributed Citus cluster.


You can mix and match:


  • columnar and row tables

  • columnar and row partitions of the same table

  • local columnar tables and distributed columnar tables; you can mix local and distributed tables on a single node with Basic tier—as well as on a distributed Hyperscale (Citus) cluster


What about cstore_fdw?


If you’ve heard of the cstore_fdw extension that my teammates at Citus created a number of years ago, you can think of Citus Columnar as the next generation of cstore_fdw. If using cstore_fdw, consider migrating to Citus Columnar.


cstore_fdw achieved the core benefits of columnar in terms of performance; but Citus Columnar goes much further in terms of integration and feature compatibility.


Citus Columnar works with:


  • ROLLBACK

  • Write-ahead logging (WAL)

  • Phsyical Replication

  • pg_upgrade


and also provides a more seamless user experience, similar to ordinary Postgres row tables.


Citus Columnar was able to accomplish this better experience by using the Table Access Method API, new in PostgreSQL version 12. Using this new extension API allows tighter integration into Postgres while still being a pure extension.


Try out Citus Columnar for your analytics workloads


The dramatic compression and scan speed improvements offered by Columnar in Hyperscale (Citus) allow you to do more with less. Take advantage by identifying large, append-only tables and evaluate whether columnar will improve performance or reduce costs.


Columnar storage may also allow you to keep data in Postgres for longer, rather than forcing you to archive older data, where it can’t be queried efficiently.


If you want to dive even deeper into learning about Citus Columnar, I recommend:


Try out Citus 10—open source or in the cloud


Finally, special thanks to Hadi Moshayedi, who was the original author of cstore_fdw (the mature basis of Citus columnar), and is the co-author of Citus 10 columnar!