by Contributed | Jan 12, 2021 | Technology
This article is contributed. See the original author and article here.
Digital transformation usually starts with moving business processes, including printing and print infrastructure, to the cloud. Universal Print is very welcome news as it provides an easy way to move printing to the cloud. If you are just starting digital transformation initiatives, YSoft OMNI Bridge, which enables Universal Print on in-market printers, comes at just the right time for you.
The Quocirca Global Print Security Report 2019, states that in 2018, 91% of organizations believed printing to be important in their business processes and 87% indicated it still would be in 2020. For on-premises print infrastructure, redundancies can be built-in, to ensure critical business processes are not interrupted. However, what happens when print moves to the cloud?
While Microsoft provides a Universal Print connector to connect existing printers to the Universal Print service in Microsoft 365, it must be installed on a Windows workstation or Server. YSoft OMNI bridge is adding value Universal Print as it is an intelligent edge device that acts as a connector. Not only can it connect existing printers to Universal Print without requiring a Windows print server, but it can also solve the need to have always-on print services. Our solution is YSoft OMNI Series.
YSoft OMNI Series™ consists of a serverless Edge device, YSoft OMNI Bridge™, and YSoft OMNI UP365™, which runs as an app on YSoft OMNI Bridge. With OMNI Series, in-market printers – those you use today that do not support Universal Print natively – can instantly and cost effectively connect to the Universal Print service in Microsoft 365. How can this help with always-on print services?
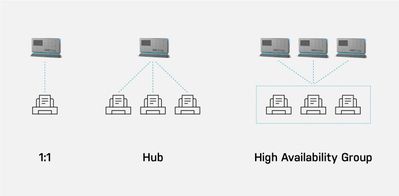
There are three different scenarios for how OMNI Series can be used, also shown in Figure 1:
- One to one: One OMNI Bridge is connected to one printer.
- Hub: One OMNI Bridge is connected to many printers.
- High Availability Group: Two or more OMNI Bridges are grouped and connected to many printers, providing load balancing and failover for business-critical printing.
Scenarios 1 and 2 are simple; it is the High Availability Group where things get interesting!
Figure 1. Three scenarios showing YSoft OMNI Bridge printer support
Load balancing and failover are two important concepts. Together they provide what is often referred to as high availability. Let’s explore these concepts further and I’ll explain how YSoft OMNI Series provides the high availability businesses need.
Load balancing
You may ask yourself, why is load balancing necessary for my business? Load balancing makes sure there is no single bottleneck between the user submitting a print job and the job coming out at the printer. By having just one connector, regardless of whether it is the OMNI UP365 App, the Universal Print Connector Microsoft provides, , all your user’s print jobs must pass through that single point. Any clog or failure may impact employees’ ability to print. It’s similar to a single lane road between point A and point B. Heavy traffic or an accident can be a nightmare.
In Figure 2 below, one OMNI Bridge is serving three printers. Naturally, there are multiple users who would like to print to the available printer closest to them. If one user submits a large print job, other users’ print jobs are queued for processing causing delays.
 Figure 2 YSoft OMNI Series 1:3 printers’ example
In figure 3 we see the High Availability scenario where two OMNI Bridges are grouped together. In this scenario, the print load is “normal” and everything is running smoothly. The company knows it has bursts of print activity that it needs to accommodate or that print is an essential business process.
 Figure 3 YSoft OMNI Bridge – High Availability scenario with normal print traffic
How can we solve the scenario where there is a clog in the road – a lot of sudden print traffic, so that users can print their critical print jobs without delay?
In Figure 4, you can see two OMNI Bridges are grouped together. If one OMNI Bridge is busy delivering a large print job, since there is a high availability group created, the second OMNI Bridge takes care of delivering the other jobs to the printers and the users do not experience any delay.
 Figure 4 YSoft OMNI Series High Availability when Load Balancing is required
Failover
Failover is a complementary concept to load balancing. With load balancing, multiple points are splitting the workload. With failover, when one connector fails, the others take over seamlessly; users are not even aware of the change.
Technology being what it is, it can fail – perhaps due to a power surge. If only one OMNI Bridge is serving a set of printers, critical business printing stops.
In Figure 5, should one OMNI Bridge fail, the second OMNI Bridge completely takes charge of delivering all the jobs to the printers transparently, without the users’ knowledge that something in the print job’s routing changed. As in load balancing, the YSoft OMNI Series group ensures the business-critical prints are delivered on time, every time.
 Figure 5 YSoft OMNI Series High Availability when Failover is required
Both failover and load balancing have specifically designed technology behind them to provide a smooth user experience. With two or more groups of OMNI Bridges, you have the redundancy and failover you need for your printing process printers – all through an inexpensive, serverless device that requires minimal maintenance and works with your existing print fleet.
As a true intelligent Edge device, YSoft OMNI Bridge leverages the full power of Microsoft Graph, IPP infrastructure and IPP everywhere to enable organizations to eliminate traditional print servers. Further, by leveraging native cloud technologies such as Azure IoT Edge Platform, it delivers an enterprise grade experience and zero trust security, while maintaining high resilience and service availability. All this, while keeping security as a top priority; TLS is used by default when transferring jobs from OMNI Bridge to the printer.
In short, YSoft OMNI Series provides organizations using Microsoft 365 an easy, cost-effective way to get to cloud printing today with their existing printers as well as a resilient, reliable way to ensure printing is always available.
How does it work?
- Login in to the YSoft OMNI Central Portal.
- Register OMNI Bridge with Azure AD. When prompted, enter the code displayed on your OMNI Bridge.


- When OMNI Bridge registration has successfully completed, your OMNI Bridge will appear in the OMNI Central Portal.
- Once a second YSoft OMNI Bridge device has been registered, the two YSoft OMNI Bridges can be configured for high availability by assigning multiple printers to them.
As Universal Print by Microsoft and YSoft OMNI Bridge are both in public preview, real time customer feedback is being incorporated. Early YSoft OMNI Bridge beta customers can already expect a secure, reliable, resilient, and robust print platform. Contact us to join in public preview and let us know what you think.
Visit YSoft OMNI Series for public preview ordering and further details.
Note: All screenshots are subject to change between public preview and general availability.
by Contributed | Jan 12, 2021 | Technology
This article is contributed. See the original author and article here.
Toshiba’s vision is Together Information, which means helping people and organizations
share information more effectively through better products and solutions. Toshiba MFP series is specially designed to help you work more efficiently and securely. Our products help your business improve management on paper and digital documents while saving time and increasing productivity.
Universal Print is a modern print solution that organizations can use to manage their print infrastructure through Microsoft 365.
The market movement towards cloud has accelerated rapidly during the COVID-19 pandemic and we believe Universal Print will play an integral part in the new normal.
Our native integration with Universal Print is in development and will be available as a firmware update for our e-BRIDGE Next architecture MFP’s in 2021 and will offer the following benefits.
- You can replace your on-premises print server with Universal Print
- You can manage connected printers in one place using the Azure portal
- You can eliminate the need to install print drivers on your endpoints
In the meantime, you can start using the Universal Print connector and switch to native support on compatible products as soon as they are available.
For further information on your Toshiba MFP architecture, please see your local authorized representative.
by Contributed | Jan 12, 2021 | Technology
This article is contributed. See the original author and article here.
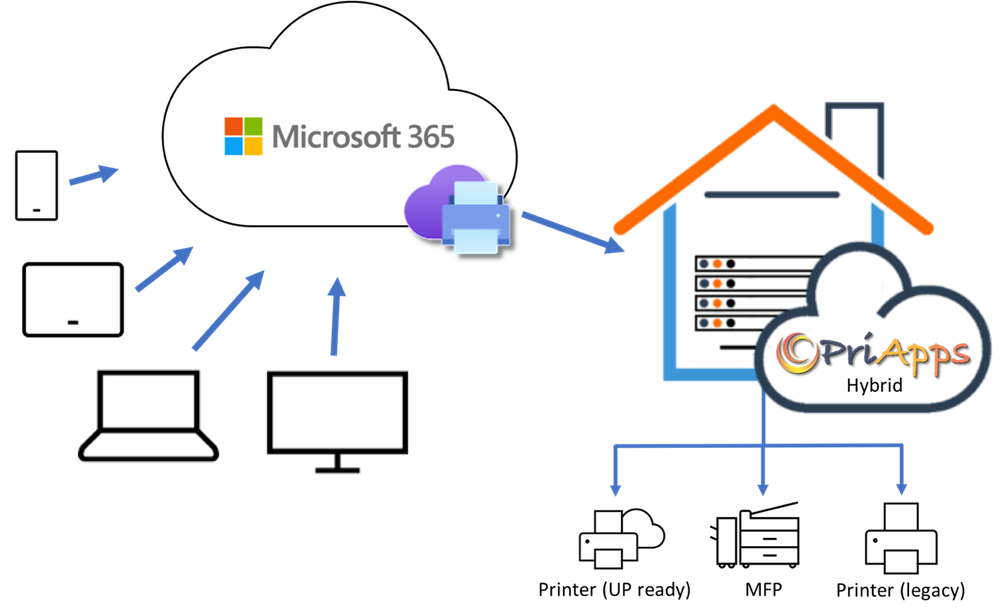
PriApps enhances Universal Print by providing a range of features and functionality that help organizations track print usage, manage and enforce print rules and policies, and increase security and confidentiality. This is achieved by allowing users to release their print jobs at any printer or MFP, rather than printing to a specific device and leaving unattended print jobs in the output trays for others to view. This feature is widely known as Pull Print. PriApps refers to it as Secure Print Release, which more accurately describes the value to organizations.
Through its integration with Universal Print, users no longer need to print to a specific printer, they print to their own personal print queue, which PriApps calls the myQueue. The PriApps myQueue appears to the user as a separate printer, however print jobs are now held until the user decides to release them at the printer or MFP of their choosing.
Since its inception PriApps has been a pioneer and innovator in the use of mobile apps for print management, offering users the ability to securely authenticate at MFPs as well as release print jobs at any printer or MFP using the PriApps mobile app, as well as via the MFP control panel. In response to the COVID-19 Coronavirus Pandemic, PriApps extended the functionality of its mobile apps to include contactless personalized scan workflows and remote copy control.
PriApps allows users to securely print, copy, scan and fax at printers and MFPs using a mobile app on their smartphone or tablet, or a web browser on any desktop or laptop computer, regardless of the operating system. SSO functionality ensures that users are only presented with their own print jobs or scan workflows and all usage is tracked for accurate reporting, billing or analytics.
For those users who still want or need to perform their workflows at the MFP, PriApps offers an MFP app which allows users to log in using smartphone, an ID card or door access badge, or by entering their credentials on the MFP control panel. Personalized ‘One-touch’ print, copy, scan and fax workflows ensure that interaction at the MFP is minimized.
Cost Recovery is another feature, typically used by Legal firms, which PriApps is able to offer Universal Print customers. Here users can assign Cost Accounts or Client Matter codes to any print job, as well as copy, scan and fax jobs. This data is then used for client billing or departmental chargeback. PriApps integrates to over 100 accounting, billing, and case management systems to seamline the processing of assigning Cost Accounts or Client Matter codes.
Visit the Universal Print solution integration page to learn more about PriApps and Universal Print.

by Contributed | Jan 12, 2021 | Technology
This article is contributed. See the original author and article here.
A number of our customers and my peers have asked me how to use the Excel sizing template to estimate an Oracle workload without access to the AWR. This is actually quite easy to do with Oracle Statspack.
The statspack report is the predecessor to the Automatic Workload Repository,(AWR). It is also the option for those databases that are Oracle standard edition or are enterprise edition but haven’t licensed the diagnostic management pack. This product requires a manual installation that requires either manual snapshots be taken or scheduling via cron or another scheduler. As it’s not “always on” and it didn’t have many of the great advanced features we take advantage of today that are part of the AWR suite. At the same time, we can use this for sizing out standard edition databases to migrate to Azure. AWR requires the diagnostic management pack to be licensed and as this is only an option on the Enterprise Edition of Oracle, so statspack is the go-to for performance data on most Standard Edition Oracle databases.
To perform a sizing assessment for Oracle to Azure on a Standard Edition database or for an Enterprise Edition database that doesn’t have the diagnostic pack licensed, a one-week snapshot window is requested. If a reboot of the server occurs during the snapshot window, the report will fail, so keep in mind that the server must be running throughout the duration of the snapshot window.
The Statspack Report
Unlike AWR, statspack is installed and owned by the PERFSTAT user. By default, app statspack processing is performed by this user. There are packages and stored procedures, etc. that are part of the installation of statspack that can be used to take snapshots and run reports.
To take a manual snapshot with statspack, the following command is run after logging into the database from SQLPlus as the perfstat user:
exec statspack.snap
This can be scheduled through cron to execute as part of a shell script one week apart to offer a single report for sizing. Another manual snap can then be performed to grant us the beginning and ending snapshot to run the report.
The reports for statspack are still housed in the same directory as the command line reports we use for AWR. We can issue the report with the following command:
@$ORACLE_HOME/rdbms/admin/spreport
The report will interactively ask you for the same type of information that is requested for AWR, just choose to show all snapshots and use the one-week previous snapshot and the ending week snapshot to create the single report.
Once this is created, the report can then be used, just like the AWR to size with the following worksheet. The instructions and data you will collect is the same, but the format of the data may just need a few hints to locate in this text formatted report for statspack.
Using the Statspack Report with the Sizing Worksheet
The example we’ll use is for a RAC database. There isn’t a RAC aware report in many databases using Statspack, so I’ll use two instance level reports and consolidate it to a single instance in the example going forward.
The data we will need to pull for our database to translate it to Azure is the following:
- Database name, instance name, host name
- Elapsed time, DB Time
- DB CPUs, CPU % Busy
- CPU/Cores
- SGA/PGA
- IOPs/MBPs
For this post, I’m going to use a real-world example, but have just done a global replace on the customer data to hide any identifying info and am only displaying the data points we require for the sizing estimate.
The report will open up in a multitude of text editors, but Wordpad or Visual Studio are the most common applications you can open the report in. Upon opening it, you may notice the database name is missing. The truth is, you only need an identifier to be used for the consolidation to a single instance from RAC:
To address this, most database names are simply the instance name without the numbering. In the example, the instance name is SCANDI1. For the spreadsheet, I’m going to use the identifier of “SCANDI” for the database name, even though none is shown in the report.
I will use the Instance name as it is shown in the report.
The next section we will inspect in the report is the host name and other pertinent data:

Rarely do we need the domain information for a host, as it’s really just the identifier. I choose to use the short name for the server to save me some typing. I also have the CPUs, Cores, memory, (displayed in GB, which is what we want for our worksheet) and then the elapsed and DB time for the report. As you may notice, a one week report for snapshots is approximately 10080 minutes. Depending on the exact snapshot completion, the time won’t be exact. This isn’t an issue, but do recognize that the amount of DB Time is important. The less busy a database is, the lower the number, busier the database, higher the number and yes, the number can be much higher than the elapsed time.
Enter these numbers in the fields for those columns and proceed into the next part of the report.
The next step is to capture the % busy CPU, which is present in Statspack, but displayed with a different identifier:

At this point, your worksheet should look like the following:

As data is presented in a different order, depending on the version of the AWR/statspack and database version, don’t be concerned that you still don’t have the DB CPUs or other data- we’ll collect that next.
Next we come to the SGA/PGA in the report. As these numbers can change over time, there is a beginning and ending value for this and we will want to take the HIGHER of each number. Although the SGA doesn’t change often, the PGA is often different:

The highlighted numbers show the ones we’d want to take from our example into the spreadsheet.
Right below the Memory information is the DB CPU value that you require for this report. In the AWR report, this term can be used repeatedly, but this is the value that you are searching for:

The value in the Time Model System Stats is the correct one for our worksheet and the number is expected to be a HIGH percentage of the DB Time. For a database server, the CPU is either on or off, so so the percentage value is a bit of a bizarre concept. In the example above, 72.6 % of the DB Time, the CPU was on, but while that occurred, keep in mind, that SQL was executing during 57.9% of the DB Time, too. These percentages are not expected to equal up to 100%. It’s the percentage they were active of the total DB Time.
The IO Time is not towards the top of the report and as this is a text report, I highly recommend you search for the section vs. parsing through the rather large report. Click on Edit à Find or Replace à Quick Find and do a search for “function”. The search should take you to the following section rather quickly, (unless they have code that is in the report with the word function in it, this is still the fastest way to locate this section, I’ve discovered.)

The IO Stat by Function Summary is the section we need and there’s one serious drawback to Statspack vs. AWR- the data isn’t totaled for each function type. You will need the Data Vol by seconds for reads, then writes and sum the four values displayed, then do the same for writes for it’s three volumes. As there are 0.00 writes, put that value in, do not leave it empty. Next, add up the Read Requests, (IOPs) and the Write Requests and enter those values to complete the last fields for the first instance.
The finished fields for the first database instance from the statspack report values should look like the following:

Now do the same for the second report for the second instance. The database name stays the SAME as it was for the first database. This is how we will then consolidate it to a single instance, using the database name.
Once you repeat what we did for the first database, for the second, you now have something that looks like the following:

Notice that the database is the same and the instance name and host names are different. Note also the slight differences in the rac nodes in usage, even though the time collected was very similar. This is expected, including differences in PGA. Process Global Area, (PGA) is used for sorting and hashing, (along with other things) and depending on the workload, could be used differently between the two nodes. These are quite small databases by Oracle standards, but how do we now use the worksheet to translate this to Azure sizing?
Filling in the Azure Calculations
Copy the database and instance name from the AWR worksheet in the Excel spreadsheet and then paste it into the first table in the Calculations sheet titled, “Calculated Detail by Database”. Don’t fill in anything past the first two columns. If you click in any of those fields to the right, you will see that they are already pre-filled with calculations that will take what you put in the first two fields, pull from the AWR worksheet and perform the first step of the translations to Azure.
If you’ve done this correctly, the values should auto-populate to the right of the database and instance names you’ve entered or pasted in:

Next, take the host name(s) and paste them into the first column of the second table, titled, “Aggregated Calculations by Host”. Again, once you do this, the rest auto-calculates and you should have something that looks like the following:

*If you have more databases or hosts that there are lines, you can copy/paste/insert more lines into the worksheet to include a larger data estate.
For the last step, take the unique database name and paste it into the third table, titled, “Aggregated Calculations by Database”. As this is a RAC database, I’m only going to enter SCANDI once and the following example should be the output:

As there are averages, a one-week workload that may be missing a month-ending peak, along with vCPU translations, the values you will take for sizing are highlighted in red text and yellow highlighter. How this is read is:
- DB Name: Single database instance that will be built in Azure
- % DB Time of Elapsed Time: How busy the database is
- Total vRAM consumed only by Oracle: Just what the database needs in RAM.
- Est’d Azure vRAM for server: Amount required for a single VM to run the database and can be adjusted some when more than one database is consolidated to a single VM.
- Total IOPS/Total Throughput(MB/s): This is what the database is producing in IO from the workload.
- Est’d Azure IOPs/MB/s for peak load: This is the adjusted volume of IO that should be expected in Azure.
- Est’d Azure vCPU: this is how much vCPU is required to run the current workload
- Est’d Azure vCPU for peak workload: This is the recommended minimum vCPU for Azure for the Oracle database.
This should be done for each database in consideration for a migration to Azure and can often save customers from the dreaded spike in licensing requirements when Oracle informs them it will be a 2:1 penalty to go from cores to vCPUs. This instruction was focused on how to use a statspack report for Azure sizing and is not the same as complex use cases that may require more insight, but this is a great starting point to explain how we can use Statspack to size out standard edition Oracle databases for Azure.
by Contributed | Jan 12, 2021 | Technology
This article is contributed. See the original author and article here.
Remote work has accelerated the growth in volume and variety of data in organizations. Microsoft provides you intelligent solutions to meet the resulting challenges in governing this data.
Foundational to these solutions are capabilities to detect and classify data accurately. Only after you accurately classify your data can you start to govern your data by deciding what to protect, what to retain or delete. At Microsoft, we know that the future of accurate data classification at scale requires machine learning. Through our trainable classifiers, you can leverage the power of machine learning to identify more categories of data with increased accuracy. These classifiers use natural language processing and statistical algorithms to identify critical information.
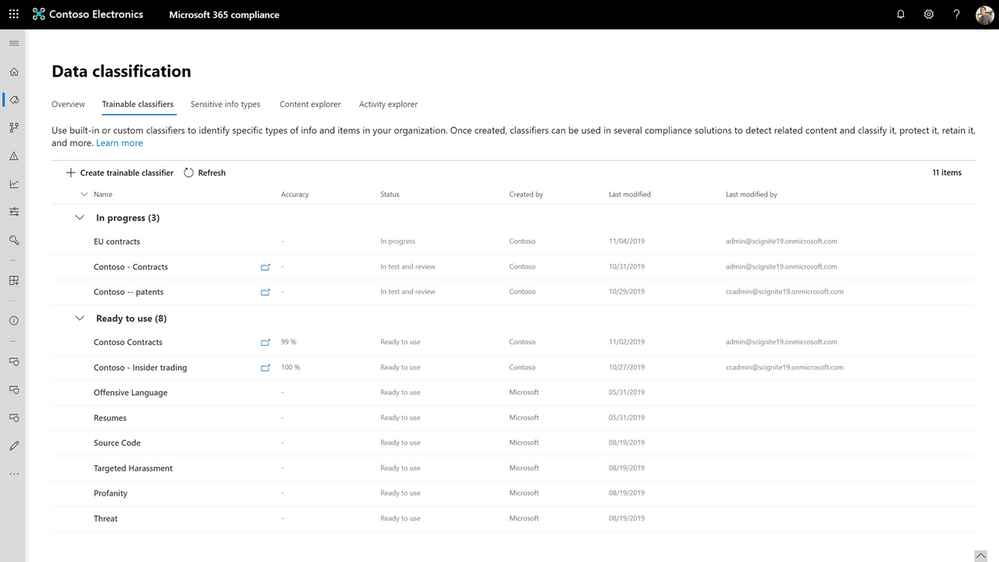
You can deploy machine learning models with ease through our built-in classifiers, which have been trained at Microsoft and are ready to use in the Microsoft 365 compliance center. Built-in classifiers are readily available for your use to detect and classify popular data categories, for example resumes and source code. Your organization will also have unique data that you can classify by creating a custom trainable classifier. Our customers across a range of industries are taking advantage of this unique opportunity to easily build and deploy trainable classifiers without needing any expertise in machine learning. For instance, a custom classifier can be built to classify loan contracts, invoices, and project documents. Together, both built-in and build-your-own trainable classifiers provide classification support for a breadth of categories important to your enterprise.
Today we are excited to announce the general availability of machine learning based trainable classifiers. This GA includes two new features to improve the accuracy of trainable classifiers. Built-in classifiers are available now in English, with support for Spanish, Japanese, French, German, Portuguese, Italian, and Chinese (simplified) coming in the second half of 2021.
Figure: List of ‘built-in’ and ‘build-your-own’ trainable classifiers in the Microsoft 365 compliance center
 Figure: Example of a custom classifier built for detecting contract documents
Use trainable classifiers to automatically apply retention policies.
Many organizations rely on employee judgment and manual classification when it comes to managing records and retention schedules. This method is prone to errors and inaccuracies. Additionally, most organizations have unmanaged data repositories that need governance but don’t have a way to classify data at scale.
With trainable classifiers, you can apply retention schedules and records policies at scale for business-critical information. For example, a compliance administrator and a records manager can work together to train a new classifier to recognize procurement documents and auto-apply a retention policy.
Microsoft’s legal team is one of many customers who use trainable classifiers to manage records in place and at scale.
“My hands-on experience in creating a trainable classifier demonstrated how automatic detection and classification of critical records help in accurately executing in-place records management across a large enterprise.”
-Jorge Garcia, Business Operations Associate, Corporate, External, and Legal Affairs at Microsoft
In Content Explorer, which is your primary tool for classified and labeled data discovery, you will see documents and emails that are a match for trainable classifiers. We are now offering you two new features to improve the accuracy of both built-in and build-your-own trainable classifiers. You can now evaluate the matched documents and provide feedback that will retrain the classifier and improve its accuracy. You can also view analytics on the degree of accuracy improvement to decide when to republish your classifier.
 Figure: Ability to view matched documents for built-in ‘resume’ classifier and provide feedback to improve classifier accuracy
 Figure: Analytics around accuracy improvement for the ‘resume’ classifier post-feedback
Getting started
Machine learning based trainable classifiers are a powerful capability that enable you to detect and classify data unique to your organization at enterprise scale. We will continue to innovate and bring you new value here. Using trainable classifiers to automatically apply data protection policies in Microsoft 365 applications like Word, Excel, PowerPoint will be generally available in the first half of 2021.
Take advantage of our machine learning platform to start building your own trainable classifier. Learn more about how to create trainable classifiers, how to improve their accuracy, and how to use them to automatically apply retention schedules and records policies. You will need one of the following SKUs to use trainable classifiers–Microsoft 365 E5 or E5 Compliance or E5 Information Protection and Governance.
We are excited to roll out these capabilities and help you in your compliance journey!
-Cathy Lin, Program Manager

Recent Comments