by Contributed | Jan 21, 2021 | Technology
This article is contributed. See the original author and article here.
Final Update: Thursday, 21 January 2021 06:33 UTC
We’ve confirmed that all systems are back to normal with no customer impact as of 01/21, 05:30 UTC. Our logs show the incident started on 01/21, 05:15 UTC and that during the 15 minutes that it took to resolve the issue some customers may have experienced intermittent metric data gaps and incorrect alert activation in East US region.
- Root Cause: The failure was due to one of our backend dependent service.
- Incident Timeline: 15 minutes – 01/21, 05:15 UTC through 01/21, 05:30 UTC
We understand that customers rely on Application Insights as a critical service and apologize for any impact this incident caused.
-Deepika
by Contributed | Jan 20, 2021 | Technology
This article is contributed. See the original author and article here.
If you are a frequent user of Azure CLI or Azure PowerShell, then chances are that you have experienced one of the AI-powered features our service provides for the Azure command line tools. These features include generating up-to-date command usage examples with each new Azure CLI and Azure PowerShell releases to ensure the documentation is always up to date (“–help” or “-h” in the command line), enabling natural language search of a command in the Azure CLI (az find), assisting with failure recovery, and the recently released AZ Predictor (for Azure PowerShell). Our AI service for Azure tools serves thousands of user requests per second. In order to handle such high scale application workloads we use an Azure App Service tier called App Service Environments (ASE). While ensuring our Azure App Service is scalable and performant, we had to address several key challenges like being able to stress test the service with a high volume of traffic, running the service in fully isolated environments without affecting other Azure subscriptions, and throttling bad actors beyond reasonable levels of requests. We will share our journey of discovery, surprises, and learnings that led us to arrive at an enterprise-grade, cloud-scale AI service that powers our own client tools.
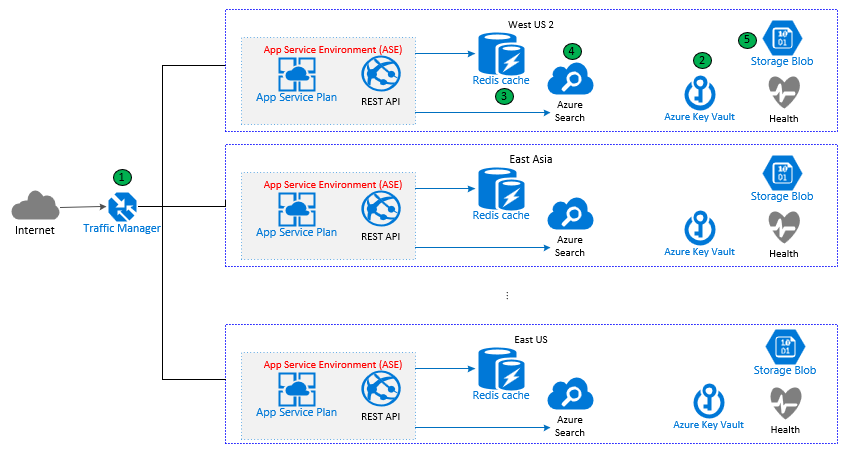
Architecture
When a user interacts with one of our integrations in Azure CLI or Azure PowerShell, a request is made to our App Service. To fulfil the request, the App Service gets the result from the relevant AI model. Note that we use different resources for different types of models. For example, the model that generates examples when a user tries to find a command is powered by Azure Search with natural language search features. The failure recovery and AZ Predictor models are more suited to be stored in Azure Storage and loaded into memory to achieve high performance.
Considering the geo-diversity of our users and the high volume of traffic, the service runs in multiple regions to achieve quick response time and high availability. Each request is routed to the nearest region by Azure Traffic Manager (1). In each region, the REST API might talk to:
- Azure Key Vault (2) to retrieve secrets.
- Azure Redis Cache (3) to get or set cached response for improved performance.
- Azure Search (4) to get some of the model results when they are not cached.
- Azure Storage (5) to load some of the models into memory at service startup or when models need to be refreshed.
Figure 1: App Service Architecture
Extensibility and Scalability
As we continue to enable more features in the service, it is important to design the App Service in a scalable way. We develop common libraries for accessing Azure resources like Azure Key Vault, Azure Search, and Azure Redis Cache. Those libraries can even be shared with other services as well.
Scalability and performance are critical for the service. A user typing on the command line typically expects a response in less than a second. This requires the service to respond to requests quickly, in the order of milliseconds. We receive thousands of requests per second (RPS), so we need to make sure the service scales fast enough to meet our changing demand. For example, we might experience a peak in the usage pattern when a new version of the Azure CLI comes out. To configure the scaling properly, we started by analyzing Azure CLI usage patterns to understand the expected traffic trends. Figure 2 shows the hourly traffic for the service in the order of 1000s.

Figure 2: Service Hourly Traffic
Based on the extremes from the usage data, the RPS estimation we used for stress testing was in the order of several 1000s of requests. Note that the estimation we used to stress test is higher than the traffic showed in this figure. This is in part because not all Azure CLI or Azure PowerShell users have upgraded to versions with our service integrations. We decided to play it safe with stress testing and prepare for the maximum number of requests we might receive plus some additional margin.
As it turned out, being able to stress test the service with thousands of requests per second was a huge challenge.
Stress Test Journey
We explored a variety of stress testing tools including loader.io and JMeter. At the end we decided to use JMeter because it offers a few key features: the ability to control requests per second, it is fully supported in Azure DevOps, and it is actively maintained. However, using JMeter involved its own challenges:
- RPS limit from one machine. We quickly found that because of the amount of TCP connections created by our JMeter script, we could only send around 1,000 RPS from one machine.
- Configuration needed to maintain multiple VMs in VMSS. Using multiple machines was necessary to overcome the above RPS limit from one machine.
We then considered running Azure Container Instance (ACI) to overcome these limitations. ACI is Azure CLI-friendly and we found it was quite easy to prepare and run a container in Azure. We were able to easily and quickly launch our images in multiple ACIs to reach our target RPS without the pain of having to individually configure and maintain multiple VMs.
App Service Environments
This led us to an unexpected challenge. Hitting our service with 1000s of RPS brought down our service, because it was overloading the load balancing front ends for that stamp. A stamp is a cluster of servers. You can think of it as groups of racks with shared resources like traffic routing within an Azure Data Center. To avoid this issue, we moved to App Service Environments (ASE) for our infrastructure. ASE provides a fully-isolated and dedicated environment for securely running App Services on a high scale. This includes isolated load balancing front ends for network routing.
With the right architecture in place, we were able to scale both horizontally and vertically. Horizontal scaling is done by increasing the number of routing front ends and App instances in proportion to actual traffic. Vertical scaling is done through choosing the right tiers for Azure Redis Cache, Azure Search Service, and App Service plan.
Throttling
Bad actors and broken scripts could bombard the service beyond reasonable levels of requests. Instead of allowing these clients to potentially bring the service down, we would ideally start blocking individual bad actors. The service implements both Client- and IP-based rate limiting. Having both these options allow us to be flexible, minimize slowdowns, and keeps the service running even when hit by bad actors.
Reliability
As shown in the architecture diagram, we deploy the service to multiple geographic regions which are aligned with the distribution of Azure CLI users to make sure every user’s request can be served from a deployment with low latency. This helps us ensure we meet our service health targets. Our reliability goal is that 99.99% of requests in the preceding 5 minutes were successful. Our latency goal is that for the requests in the preceding 15 minutes are served in under 700 milliseconds for the 99.9th percentile.
All traffic for the services is routed by Azure Traffic Manager. When Traffic Manager detects that a region is unhealthy (which is checked via a monitor API defined in the service) the traffic is then routed to the next closest region.
Deployment
We use Azure DevOps and Azure Resource Manager templates (ARM) to deploy the service. Deployment is first tested in Dev and PPE (pre-production environments) environments. An interesting learning is that the first ASE deployment takes 1.5 – 2 hours, though subsequent deployments are much shorter.
Our release pipeline follows the ring-based deployment process with the goal of being able to limit failures to the minimum number of customers.
Monitoring
Monitoring is important to make sure we know right away when something goes wrong. This is essential for us to meet our reliability and availability requirements. The service logs various metrics which are then used in a variety of alerts to the team: when an API call fails, when the App Service performance is degraded, when some resource in a region fails, when a region goes down etc. The metrics data is processed in near-real-time alerts (60s ingestion latency).
Help us make the tools that you love and use every day even better. You can provide feedback by creating an issue in Azure CLI GitHub page and Azure PowerShell GitHub Page.
by Contributed | Jan 20, 2021 | Technology
This article is contributed. See the original author and article here.
Automating Azure Synapse and Azure Analysis Services or Power BI Dataset
Writer: Derek Daniels, Senior Business Intelligence Consultant
Technical Reviewers:
- Mark Kromer, Principal Program Manager, Azure Data Factory (Microsoft)
- Patrick LeBlanc, Principal Program Manager, Power BI Customer Account Team (Microsoft)
- Phil Bennett, IT Software Development Engineer (Microsoft)
Published: January 2021
Applies to: SQL Server Integration Services (on premise), Azure Data Factory, Azure Synapse Analytics workspace (formerly Azure SQL DW), Azure Analysis Services and Azure Logic Apps
Summary:
This article describes an example of how to automate an ELT (extract, load, transform) for your data warehouse and tabular model reporting solutions (AAS (Azure Analysis Services) or Power BI (PBI) dataset) within Azure Synapse Analytics workspace (/studio). The key differentiator of this paper is that the data sits on-premise, and Azure Data Factory is prohibited (i.e. blocked) from accessing the data but, SSIS on-premise can access the data.
Introduction
If you’re looking at moving your on-premises BI solution to Azure to leverage the power of Azure Synapse Analytics, but your data is hidden behind a firewall that won’t allow Azure Data Factory access, then this solution could help you. This article will provide you with a possible Azure solution architecture design to assist you.
This article was created when I began my journey of moving my clients data from an on-premise 2016 SQL Server to Azure. At that time there was no one article that showed a possible end-to-end solution. Here I’ve captured a lot the steps I took to craft my final Automated Azure self-serve BI Solution.
This article assumes you’ve already successfully setup and configured the following:
- A self-hosted IR (integration runtime)
- Azure Synapse Analytics workspace. If not, you can start by going to Microsoft Docs Get Started with Azure Synapse Analytics. Make sure database permissions are setup correctly under Manage > Security > Access Control (Secure your Synapse workspace (preview)).
- If you prefer YouTube videos, Advancing Analytics – The Synapse Sessions might be a good start too.
- Have a working SSIS (SQL Server Integration Services) environment already setup for deployment.
- Built out and deployed a tabular model. If not, there are numerous resources to assist you with this, including Microsoft Documents Lesson 1: Create a New Tabular Model Project.
Setup
First (if you haven’t already), download and install Azure Feature Pack for Integration Services (SSIS) for your version of SSIS. Within this feature pack you’ll want to leverage the Flexible File Destination component to save off the data as Parquet file format in ADLS Gen. 2 (Azure Data Lake Storage Gen. 2/ Blob). The caveat with Parquet files is that they have a major dependence on Java. This created quite the hiccup for me. While I used Oracle’s Java SE Runtime Environment, I still had to make some changes to the System Properties where the SSIS Environment sits. I found the 11 minute YouTube video How to Install Java JDK on Windows 10 (with JAVA_HOME) (March 2020) quite helpful in setting up and validating the setup.
Within your new SSIS Project, you’ll need to create connections to your source system(s) and Azure Storage connection manager.
Extract Load Transform (ELT)
The advantage of placing the data directly from the source into Blob Storage is that it strips away any metadata type mismatch issues. Once completed the data is transformed into a star schema to be later consumed by AAS.
There are three primary ways to connect to a server (database engine):
- Windows Authentication
- SQL Server Authentication
- Azure Active Directory – Integrated
If your Data Factory can create a linked service to your data source via Windows Authentication or SQL Server Authentication, then you should be able to leverage Azure Data Factory Managed Virtual Network (preview). If your data sources requires you to use a Service Principal, and you can use Azure Databricks (Azure Synapse Analytics workspace Notebook), then you should consider PySpark.
Unfortunately, my situation only allows for Azure Active Directory – Integrated, and at the time of publication of this paper, ADF doesn’t support Active Directory Integrated Authentication. Which is why I used SSIS to pull my fact table. However, my dimension tables are located in ADLS Gen. 2, and so I’m able to leverage PySpark.
Extract Load
My Source dataset is a destructive load, so my dataset must be a destructive load too. This step pulls from two different data sources (on-prem & Azure) and allows me to call two activities simultaneously (General – Stored procedure, and Synapse – Notebook).
Extract Load with SSIS
I chose to use SSIS Sequence Containers for each of my data sources, and then create the Data Flow Tasks within (please see image on the right). That way, if there was an issue with the source system it’s easier to identify.
The General – Stored procedure activity leverages an on-premises SSIS 2016 Data Flow Task to copy data from on-premise SQL Server (doesn’t accommodate Azure Data Factory) and paste it into a secure ADLS Gen. 2 repository.
Here you have to explicitly state that you want the Flexible File Destination task to save the data as a Parquet file. If this isn’t setup correctly (System Settings) then you won’t be able to perform this task successfully.
- Location
- Folder Path – this is Hadoop (/Linux) based, therefore case sensitive
- File Name – needs to contain both file name, and file type extension (this case “.parquet”)
- Format
- File Format – select Parquet from the drop down
Once I deployed the package I used Tim Mitchell’s article A Better Way To Execute SSIS Packages With T-SQL (November 2016) (GitHub) to create a SP (Stored Procedure) to call and wait for completion of the SSIS Package. This will be used in the automated data orchestration.
Extract Load with PySpark
Appendix A – PySpark (Python) Destructive Load contains most of the code I used to pull data from ADLS Gen 2 via PySpark. Connecting to ADLS Gen 2 has two options depending how source data has been configured:
The next part stumped for several weeks. Since each time the PySpark notebook is ran, the Parquet file name keep changing in the folder path. Thus, a dynamic naming convention needs to be leveraged. However, once I realized I could create an external table to a folder location (not a file path) that solved my issue. Here’s how I created my external table for DIM Currency.
CREATE EXTERNAL TABLE ext.DIM_Currency (
[DIM_CurrencyId] int,
[CurrencyCode] varchar(8000),
[CurrencyName] varchar(8000)
)
WITH (
LOCATION = ‘<file path>/DIM_Currency/’,
DATA_SOURCE = [dfs_core_windows_net],
FILE_FORMAT = [SynapseParquetFormat],
REJECT_TYPE = VALUE,
REJECT_VALUE = 0
)
GO
|
Extract data with Scala
Appendix B – Spark (Scala) Destructive Load contains most of the code I used to pull data from Azure SQL Database (SQL script with table joins and filtering), and wrote the results into the ADLS Gen 2 environment. I connected the new parquet file the same way I did with the PySpark script.
Transform
This part requires some more setup in the form of mapping the Parquet files in ADLS as External Tables within Synapse (Microsoft Docs Use external tables with Synapse SQL). This needs to be done for both Synapse SQL pool, and SQL on-demand. A short cut to doing this is to go to the Data section, click on the “Linked” icon. Drill down to where one of your Parquet files is located, right click on the file, select New SQL Script > Create external table, select the SQL pool, select the database, type in the table schema and table name in the text box (I created a “stg” schema for all of my staging tables).
Once I created all of the necessary external tables, I wrote two destructive load stored procedures: one for the fact tables and one for the dimension tables. At this time, all of my tables are destructive loads (fact and dimensions) through Stored Procedures in the SQL Pool. In my environment I loaded the transformed (star schematized) tables into the “dbo” schema. From there I wrote SQL Views in the “bi” schema to perform “(NOLOCK)” on the dbo tables. If you’re not familiar with NOLOCK table hint, MS SQL Tips wrote an article explaining it, Understanding the SQL Server NOLOCK hint (April 2019). Having the “bi” schema also helps me limit the access I grant to users, as I may not want to always give them access to the source table.
Publish
Create Tabular Model (AAS or PBI)
Once your data is properly prepped in Synapse Analytics, you’ll need to build out a tabular model either in SSDT (SQL Server Data Tools/ Visual Studios) or Tabular Editor, and deploy it to your AAS Server. Or you can use Power BI Desktop and publish it.
Both options have the ability to leverage DirectQuery but, there are some caveats to be mindful of. They can be found in the DirectQuery model guidance in Power BI. This is because at the time of writing this, this is a requirement for Materialized Views.
In addition, you may also want to point that as of writing of this document, that Materialized Views cannot be created on Existing Views (which you are creating in your bi schema) and they don’t support RLS.
Automation with Synapse Data Factory (Orchestration)
My Synapse Data Factory solution has several parts largely divided up into 3 segments. The first is ELT, the second cleans the tabular model, and the third performs a full refresh on the tabular model. A constraint I have is that all my tables are a destructive load (non-incremental). I would prefer I have the option to perform an incremental (partition) refresh.
Using the SQL BI Vertipaq Analyzer, I quickly discovered my model was just over 10 GB.. Upon reviewing the AAS Pricing Tiers, one would expect the S1 tier to be sufficient to perform a full refresh. Unfortunately, my experience proved otherwise giving me an ambiguous Azure Data Factory Error Code 2108, which meant insufficient memory. I discovered this when I chose to “clearValues”, then perform a full refresh. This workaround also prevented me from spending more money than I needed to.
Microsoft’s Mark Kromer helped me automate the AAS portion by showing me James Coulter article’s Process Azure Analysis Services Models with Azure Data Factory v2 (March 2020), it also shows how to refresh table partitions. From here I created two Data Factory Pipelines (clear values, and full). James figured out how to call and wait for the correct response from AAS.
If you client wishes to use the Power BI instead of AAS, Meagan Longoria wrote Refreshing a Power BI Dataset in Azure Data Factory (July 2020). In May of 2018 Power BI Premium allowed for incremental refresh, and in 2020 that option was available for Power BI Pro licenses too. The You Tube Channel “Guy in a Cube” has covered this topic.
My Production Synapse Orchestration Pipeline has the following sequential task:
- Stored procedure activity
- Calls the SSIS SP
- SQL pool stored procedure activity (dimension tables)
- Calls the destructive load of the dimension tables within Synapse
- SQL pool stored procedure activity (fact tables)
- Calls the destructive load of the fact tables within Synapse
- Execute Pipeline
- AAS
- clear values
- full
- PBI
- Web activity (Azure Logic App call)
Create Azure Logic Apps for messaging
Adam Marczak created a great 30 minute YouTube video labeled Azure Data Factory Custom Email Notifications Tutorial (June 2020). It provides a detailed step by step process to create an Azure Logic App to send a custom email. He suggests as a best practice to create a master pipeline that calls the pipeline doing all of the work to help with error handling.
Appendix A – PySpark (Python) Destructive Load
%%spark
spark.conf.set(“fs.azure.account.auth.type”, “OAuth”)
spark.conf.set(“fs.azure.account.oauth.provider.type”, “org.apache.hadoop.fs.azurebfs.oauth2.ClientCredsTokenProvider”)
spark.conf.set(“fs.azure.account.oauth2.client.id”, “”) //Principal App (client) ID
spark.conf.set(“fs.azure.account.oauth2.client.secret”, “”) //Secret Key
spark.conf.set(“fs.azure.account.oauth2.client.endpoint”, “https://login.microsoftonline.com/ (directory/ tenant ID) /oauth2/token”) //Directory (tenant) ID
//YouTube: Azure Databricks – Accessing Data Lake – Using a Service Principal (April 2020) by Dinesh Priyankara
//https://www.youtube.com/watch?v=odlf3wXBSpY&list=PLEebLi3cHr6SsEJfsrxNze4-Ksju3cQyI&index=7&t=0s
|
# pyspark.sql.SparkSession Main entry point for DataFrame and SQL functionality.
from pyspark.sql import SparkSession
# Define build file Uniform Resource Identifier (URI) for source
def build_file_uri(accountName: str, blobName: str, dirName: str) -> str:
baseFilePath = “abfss://{}@{}.dfs.core.windows.net/Layer01/Layer02/{}/” #File Tree Path
filePath = baseFilePath.format(blobName, accountName, dirName)
filePath = filePath + “{*}”
return filePath
# Define build file Uniform Resource Identifier (URI) for destination
def build_file_uri_alt(accountName: str, blobName: str, dirName: str) -> str:
baseFilePath = “abfss://{}@{}.dfs.core.windows.net/Layer01/Layer02/{}/”
filePath = baseFilePath.format(blobName, accountName, dirName)
#filePath = filePath + “{*}”
return filePath
def build_file_uris(accountName: str, blobName: str, dirNames: [str]) -> [str]:
paths = []
for name in dirNames:
path = build_file_uri(accountName, blobName, name)
paths.append(path)
return paths
def build_file_uris_alt(accountName: str, blobName: str, dirNames: [str]) -> [str]:
paths = []
for name in dirNames:
path = build_file_uri_alt(accountName, blobName, name)
paths.append(path)
return paths
# Define copy type = overwrite
def copy(inputFilePath: str, outputFilePath: str, writeMode: str = “overwrite”, sparkSession: object = None) -> bool:
try:
if not sparkSession:
spark = SparkSession.builder.getOrCreate()
spark = SparkSession.builder.getOrCreate()
df = spark.read.parquet(inputFilePath)
#df = df.repartition(1) #provide a single consolidated file (not partitioned)
df.write.mode(writeMode).parquet(outputFilePath)
except Exception as e:
raise e
# Define copy plural
def copy_many(sourceAccount: str, destinationAccount: str, sourceBlob: str, destinationBlob: str, tableNames: [str]):
sourceUris = build_file_uris(sourceAccount, sourceBlob, tableNames)
destinationUris = build_file_uris_alt(destinationAccount, destinationBlob, tableNames)
spark = SparkSession.builder.getOrCreate()
for i in range(len(sourceUris)):
sourcePath = sourceUris[i]
destPath = destinationUris[i]
copy(sourcePath, destPath, sparkSession = spark)
print(“copied | {} | to | {} |”.format(sourcePath, destPath))
#if __name__ == “__main__”:
sourceAccount = “<Storage Account Name>” #Source Account Name
destinationAccount = “<Storage Account Name>” #Destination Account Name
sourceBlob = “<Blob Container Name>” #Source Blob Container Name
destinationBlob = “<Blob Container Name>” #Destination Blob Container Name
tables = [“DIM_Date”, “DIM_BusinessHierarchy”]
copy_many(sourceAccount, destinationAccount, sourceBlob, destinationBlob, tables)
|
Appendix B – Spark (Scala) Destructive Load
//Use HDInsight Spark cluster to read and write data to Azure SQL Database
//https://docs.microsoft.com/en-us/azure/hdinsight/spark/apache-spark-connect-to-sql-database
// Declare the values for your database
val jdbcUsername = “<UserName>”
val jdbcPassword = “<Password>”
val jdbcHostname = “<Name>.database.windows.net” //typically, this is in the form or servername.database.windows.net
val jdbcPort = 1433
val jdbcDatabase =”<DatabaseName>”
//Create Connection String
import java.util.Properties
val jdbc_url = s”jdbc:sqlserver://${jdbcHostname}:${jdbcPort};database=${jdbcDatabase};encrypt=true;trustServerCertificate=false;hostNameInCertificate=*.database.windows.net;loginTimeout=60;”
val connectionProperties = new Properties()
connectionProperties.put(“user”, s”${jdbcUsername}”)
connectionProperties.put(“password”, s”${jdbcPassword}”)
|
//SQL Databases using JDBC (https://docs.databricks.com/data/data-sources/sql-databases.html)
//Push down a query to the database engine (https://docs.databricks.com/data/data-sources/sql-databases.html#push-down-a-query-to-the-database-engine)
// Note: The parentheses are required.
val pushdown_query = “””(SELECT DISTINCT PFam.*, PO.*
FROM dbo.PriceListItems PLI
JOIN dbo.Products Prod ON PLI.ProductSKID = Prod.ProductSKID
JOIN dbo.ProductFamilies PFam ON Prod.ProductFamilySKID = Pfam.ProductFamilySKID
JOIN dbo.ProgramOfferings PO ON PLI.ProgramOfferingSKID = PO.ProgramOfferingSKID
WHERE PLI.ValidTo >= DATEADD(MONTH,-6, CONVERT(datetime, CONVERT(varchar, MONTH(SYSUTCDATETIME())) + ‘-01-‘ + CONVERT(varchar, YEAR(SYSUTCDATETIME()))))
AND PO.ProgramName LIKE ‘%Enterprise%’) EA_PriceList”””
val dfPriceListEA = spark.read.jdbc(url=jdbc_url, table=pushdown_query, properties=connectionProperties)
//display(df)
//df.printSchema
val filePath = “abfss://<BlobContainerName>@<StorageAccountName>.dfs.core.windows.net/<FilePath>”
dfPriceListEA.write.mode(“overwrite”).parquet(filePath)
|
Conclusion
Creating this fully automated data refresh solution allowed me to focus my efforts elsewhere, such as meaningful data visualization with Power BI. Hopefully this article will help you reap similar rewards.
For more information:
Azure Web site
Azure Synapse TechCenter
by Contributed | Jan 20, 2021 | Technology
This article is contributed. See the original author and article here.
As Community Lead for the Microsoft Teams Engineering team, I want to THANK YOU for being part of the Community. I think we can all agree that 2020 was a challenging year for all of us, and Microsoft Teams played an enormous role in staying connected to family and friends, and for enabling us to stay productive at work. With the sudden spike in usage and the quick need to pivot on existing roadmap items due to changing demands, it would have been impossible without all of you working together as a community to share experiences, best practices, and to help us shape the product based on your real-world needs.
As a team, we are proud of the interaction we have with customers, partners, MVPs, and community leaders worldwide. Through attending community events, reading blogs, listening to UserVoice and having discussions at events like Ignite, we are constantly learning from you. I wanted to take a moment to share some of the exciting things going on with the Microsoft Teams Community and invite you to be involved.
New for 2021 is the Microsoft Teams Community Star Award. This monthly award is presented to someone who has made a significant one-time or on-going contribution to the Microsoft Teams Community making impact on the product. Anyone can nominate an individual for the Microsoft Teams Community Star Award.
We would like to congratulate @Mark Vale who has been named our first Microsoft Teams Community Star Award winner for the month of January. An active member of the community, Mark runs the Microsoft Teams Community Event out of the UK, Commsverse. During the start of Covid-19, he was one of the first event organizers who was forced to move his event to a virtual environment. He did so with creative ideas, pushing the limits as a creative problem-solver. Mark worked very close with the Microsoft Teams product group to share real-world feedback around the virtual event scenario to help drive relevant, timely product feedback. He pulled off a successful virtual event with only a few weeks of planning and shared his experience with other event organizers to help ensure their success. Mark is an expert on Microsoft Teams and has a strong background in telephony. We look forward to participating in Commsverse June 29-30, 2021 and the many learning opportunities leading up to the big event. Follow Mark Vale on Twitter @MarkVale83 or find him on LinkedIn.
Several members of the Microsoft Teams Community have come together to organize a Women in Microsoft Teams Community with the purpose of collaborating, sharing ideas and learning from each other in a virtual setting. All are welcome and monthly gatherings will kick-off February 2nd. If you’re passionate about Microsoft Teams and interested in being part of this group, please join. Register here and you’ll be added to the team to start collaborating!
Since we aren’t able to travel and be in-person like we’ve done in the past, the community has gotten very creative with ideas to keep attendees engaged and continue delivering rich content across a variety of topics with audiences, worldwide. One of the benefits to virtual events is the ability to attend and engage with different people in places you may not have been able to visit, otherwise. We urge you to take advantage of the wealth of knowledge and global experiences the community is sharing. You can find a list of regional and worldwide User Groups and Events in the Microsoft Technical Community Event Listings. If you have a UG or Event to share, please add it to the Event Listing!
Here are a few I have on my personal list; I hope you’ll join!
Commsverse, Weybridge, UK: June 29-30, 2021
CommsvNext, Denver, CO, USA: August 19-20, 2021
European Collaboration Summit, Wiesbaden, Germany: June 14-16, 2021
Get-CSLatam, Mexico City, MX: TBD
Microsoft 365 Collaboration Conference, Las Vegas, NV, USA: December 7-9, 2021 + Spring 2021 Announced Soon!
TeamsCommunityDay 2021, Virtual from Germany: January 28, 2021
Teams Nation, Virtual from UK: May 26, 2021
Thrive Conference, Slovenia: April 13-14, 2021
If you haven’t already been monitoring this blog space, I hope you will take time to check out the many articles written by members of the community for the community. Not only do we hope you’ll share your own experiences and knowledge in the discussion board, we do hope you’ll consider authoring your own blog. There’s so much knowledge and we can learn so much from each other and our different experiences. If you have something to write about, please submit your topic at aka.ms/teamscommunityblogger for consideration.
Until next month…Be well! #CommunityRocks

by Contributed | Jan 20, 2021 | Technology
This article is contributed. See the original author and article here.
Azure Sentinel provides multiple ways to import threat intelligence into the product. The threat intelligence imported into Azure Sentinel makes it to the ThreatIntelligenceIndicator log analytics table and is also made available on the Threat Intelligence Blade. The imported threat intelligence can then be used in various parts of the product like hunting, investigation, analytics, workbooks, etc.
One of the ways to bring threat intelligence into Azure Sentinel is using the Threat Intelligence – TAXII Data connectors. This data connector uses the TAXII protocol for sharing data in STIX format and enables a built-in TAXII client in Azure Sentinel to import threat intelligence from TAXII 2.x servers.
Today we are announcing the availability of the IntSights TAXII Server, which allows you to get threat data from IntSights into Azure Sentinel using the Threat Intelligence – TAXII Data connector.
IntSights + Microsoft Azure Sentinel Solution
The IntSights and Azure Sentinel integration allows customers to gain visibility on indicators of compromise that directly target their unique digital footprints based on monitoring of thousands of sources across the clear, deep, and dark web to identify threats. With the IntSights intelligence feed, users can proactively block threats before they impact their environments and get instant visibility on those threats within Azure Sentinel.
In addition, users can leverage this integration to get enriched IOCs with additional context about the IOC like threat actor, malware, and campaign information. Users can further pivot to the IntSights Investigation module to gain additional visibility and context to protect their organizations.
Microsoft Azure Sentinel benefits with IntSights feed
The Azure Sentinel and IntSights integration enables analysts in the Security Operation Center (SOC) to gain visibility into thousands of indicators of compromise with contextual information. This integration also provisions dashboards in the form of Azure Sentinel workbooks detailing event data associated with the IOCs found in your environment.
This blog will walk you through the process of connecting the IntSights TAXII Server to Azure Sentinel.
Connecting Azure Sentinel to the IntSights TAXII Server:
To connect Azure Sentinel to the IntSights TAXII Server, obtain the API Root, Collection ID, Username and Password from the IntSights portal after you configure a policy of the data you wish to send to Azure Sentinel.
Enable the Threat Intelligence – TAXII data connector in Azure Sentinel
To import threat intelligence indicators into Azure Sentinel from the IntSights TAXII Server, follow these steps:
- Open the Azure Portal and navigate to the Azure Sentinel service.
- Choose the workspace where you want to import threat intelligence indicators from the IntSights TAXII Server.
- Select Data Connectors from the Configuration menu.
- Select Threat Intelligence – TAXII from the list of the data connectors and click the Open Connector page button.
- Now enter a Friendly name for the TAXII Server collection. This will be stamped on all the indicators as the Source of the indicator.
- Now enter the API Root, Collection ID, Username and Password that you obtained from IntSights.
- Click the Add button.

You should now see a confirmation on the notification dialog that the connection was established successfully. The TAXII Server will now show up in the List of the configured TAXII Servers.

View imported indicators from IntSights TAXII Server in Azure Sentinel
Now that threat intelligence indicators from the IntSights TAXII Server are being imported into Azure Sentinel, you can view them in one of the two below mentioned ways in Azure Sentinel:
a. The ThreatIntelligenceIndicators table in Log analytics
- Open the Azure portal and navigate to the Azure Sentinel service.
- Choose the workspace where you imported threat indicators from IntSights using the Threat Intelligence – TAXII Data connector.
- Select Logs from the General section of Azure Sentinel.
- The ThreatIntelligenceIndicator table is located under the SecurityInsights group.
- Use the following query to find indicators from IntSights:
ThreatIntelligenceIndicator
| where SourceSystem == “Friendly name of the TAXII Server”
b. Threat Intelligence blade under the Threat Management menu
- Open the Azure portal and navigate to the Azure Sentinel service.
- Choose the workspace where you imported threat indicators from IntSights using the Threat Intelligence – TAXII Data connector.
- Select Threat Intelligence from the Threat management section of Azure Sentinel.
- You can filter the indicators according to the Source to view the ones that you imported from IntSights. To do so, select the friendly name of the IntSights TAXII Sever you used from the Source pill filter.
Use imported indicators from IntSights TAXII Server in Azure Sentinel
Now that you have imported the indicators into Azure Sentinel, you can use them for matching against log sources. This can be done using the Azure Sentinel out-of-the-box analytics rules by modifying them or by creating new rules from scratch. The set of out-of-the-box analytics rules used to match threat indicators with your event data all have names beginning with, ‘TI map’ under the Analytics section in the Configuration menu. All these rule templates operate similarly with the only difference being what type of threat indicators are used (domain, email, file hash, IP address, or URL) and which event type to match against.

Get insights about your threat intelligence using the new IntSights Workbook
You can use the IntSights Workbook to visualize important information about the threat intelligence you have imported from the IntSights TAXII Server. This workbook provides an interactive dashboard about the threat intelligence you have imported from IntSights. The IntSights Workbook is available on the Azure Sentinel GitHub page. The name of the workbook is “IntsightsIOCWorkbook”.
You can follow the below mentioned steps to get the IntSights Workbook:
- Open the Azure portal and navigate to the Azure Sentinel service.
- Choose the workspace where you imported threat indicators from the IntSights TAXII Server.
- Select Workbooks from the Threat management menu.
- Navigate to the Templates tab and search for the workbook titled IntSights IOC Workbook.
- Select the Save button and choose an Azure location to store the workbook.
- Now select the View saved workbook button to open the workbook for viewing.

Send tags for indicators back to IntSights
You can send a tag to your IntSights account for every IOC that was sent by IntSights and seen in your environment so that you can further analyze the data in the IntSights platform. This can be done simply by deploying a Playbook from the Azure Sentinel GitHub.
Conclusion
With the IntSights and Azure Sentinel integration, you can now gain visibility on indicators of compromise from thousands of sources across the clear, deep, and dark web for advanced detection and hunting threats. You can also receive additional context about the IOCs from the IntSights feed to protect your organization against targeted threats.

Recent Comments