by Contributed | Dec 8, 2020 | Azure, Microsoft, Technology
This article is contributed. See the original author and article here.
Initial Update: Tuesday, 08 December 2020 13:03 UTC
We are aware of issues within Log Analytics and are actively investigating. Some customers may experience data access issues in Australia South East region.
- Work Around: None
- Next Update: Before 12/08 17:30 UTC
We are working hard to resolve this issue and apologize for any inconvenience.
-Sandeep
by Contributed | Dec 8, 2020 | Technology
This article is contributed. See the original author and article here.
In this installment of the weekly discussion revolving around the latest news and topics on Microsoft 365, hosts – Vesa Juvonen (Microsoft) | @vesajuvonen, Waldek Mastykarz (Microsoft) | @waldekm, are joined by Data Architect, Transition Evangelist, Data Platform MVP Isabelle van Campenhoudt (ShareQL – Power Platform Associates) | @thesqlgrrrl, based in Belgium.
Topics discussed:
- The challenge for customers today is too much data, its availability, accuracy, recency, history, and shareability.
- The multiple levels of reporting on which all agree that what’s more important is what information needs to be conveyed in the report.
- Training needs to focus on “Consuming a Report” – and how to understand and manipulate data in a visual way.
- Finally, discussion on organizing or cataloging data, there is a data governance tool – Microsoft Azure Pureview – previously known as data catalog.
This episode was recorded on Monday, December 8, 2020.
Did we miss your article? Please use #PnPWeekly hashtag in the Twitter for letting us know the content which you have created.
As always, if you need help on an issue, want to share a discovery, or just want to say: “Job well done”, please reach out to Vesa, to Waldek or to your Microsoft 365 PnP Community.
Sharing is caring!
by Contributed | Dec 8, 2020 | Technology
This article is contributed. See the original author and article here.
Intro:
Log Analytics tables sidepane is a great way to find what you need.
The tables sidepane is contextual, and only loads the tables relevant to the scope you are in.
To learn more about Log Analytics scopes read this blog post.
The tables sidepane also allows filtering the different tables according to various parameters and grouping them in a way that makes sense and makes it easy to find what you need.
To learn more about Log Analytics tables sidepane read this blog post.
We are very excited to share our latest improvement to the tables sidepane
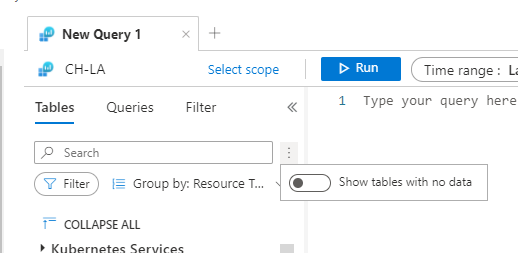
Showing tables with data:
Following your valued feedback, we have added an option for users to filter the tables sidepane to only show tables containing data.
This means empty tables associated with the scope you are currently exploring will not be shown by default, reducing clutter and helping you focus on the insights you need.
Controlling what tables are shown is super easy, using a toggle on the top of the tables sidepane:
Set your default:
By default, Log Analytics sidepane will only show tables with data, however, we have added the option to change this default behavior.
If you want Log Analytics table sidepane to show all tables, by default, you can change the setting using Log Analytics settings:

We value your feedback!
Let us know what you think by commenting on this blog post.
by Contributed | Dec 8, 2020 | Technology
This article is contributed. See the original author and article here.
Hello Folks,
Lately I’ve had a few conversations regarding Log Analytics workspace design. More specifically, questions like:
- Do I create one central workspace with all data?
- Should I create one workspace per application?
- Should each team have their own workspace?
Design conundrum
Figuring out how many workspaces, you need is determined by one or more of the following requirements:
- Which region do you need to store the data; do you have data sovereignty or compliance issues we need to comply with?
- Data Retention. How long do you need to keep the data?
- Data Access. The workspace is the security boundary for Log Analytics. If you have log data from two different teams, that are not allowed to see each other’s data, you’ll need to setup different workspaces.
- Data Collection. Solutions and data collection settings are set on workspace level. So, if you turn on collection of warnings in the Application log on Windows servers, that setting will be applied to all connected Windows servers, even if we only need it from some of your servers.
These items are really important to figure out since Log Analytics workspace provides by design:
- A geographic location for data storage.
- Data security by being able to grant different users different access rights to the data.
- Scope for configuration of settings like pricing tier, retention, and data capping.
IT shops these days are setup either in a centralized, decentralized, or an in-between hybrid of both structures. Therefore, the following workspace deployment models have been commonly used to map to one of these organizational structures:
- Centralized: All logs are stored in a central workspace and administered by a single team, with Azure Monitor providing differentiated access per-team.
- This scenario is easier to manage, search across resources, and cross-correlate logs
- Decentralized: Each departments or teams runs their own workspaces in a resource group they own and manage. In this scenario, the workspace can be kept secure and access control is consistent with resource access, but it’s difficult to cross-correlate logs.
- I know in that past I wrote about “Querying multiple Log analytics workspace at once” however I have come to realize that when your organization grow and new resources are added if you are adding new Workspaces, you have to edit all your existing cross-workspace queries.
- Hybrid: Both deployment models in deployed in parallel.
- This commonly results in a complex, expensive, and hard-to-maintain configuration with gaps in logs coverage.
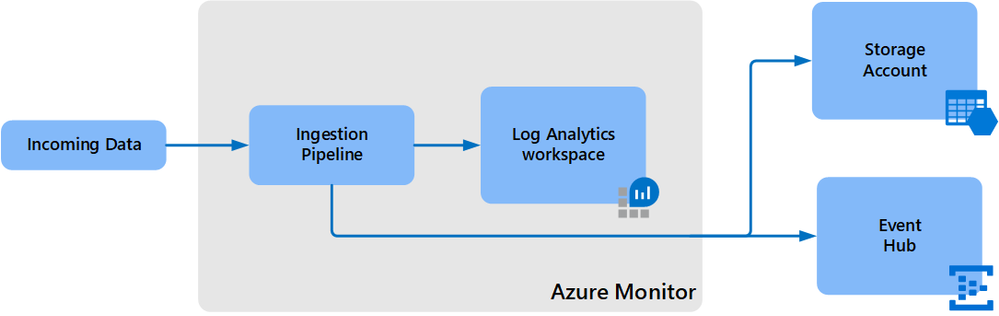
- To achieve this we can use the Log Analytics workspace data export method to export from all resource Workspaces to a central Storage account.
- Configuration can currently only be performed using CLI or REST requests. You cannot use the Azure portal or PowerShell.
- The –export-all-tables option in CLI and REST isn’t supported. You will have to provide the list of tables in export rules explicitly.
- Your Log Analytics workspace can be in any region except for the following:
- Switzerland North
- Switzerland West
- Azure government regions
- The destination storage account or event hub must be in the same region as the Log Analytics workspace.
- However, there are a few limitations at this point:
So, I really think that a central Workspace is a more reasonable solution for most organizations that have a need for querying all resources. If you don’t or seldom require cross-workspace queries, then a decentralized approach may be appropriate.
Manage access to log data and workspaces.
When deploying a centralized model. You need to manage access to the logs and to administer the workspaces, including how to grant access to:
- The workspace using workspace permissions.
- Users who need access to log data from specific resources using Azure role-based access control (Azure RBAC) – also known as resource-context
- Users who need access to log data in a specific table in the workspace using Azure RBAC.
You can view the access control mode configured on a workspace from the Azure portal or with Azure

The 2 Access options are:
Workspace-context: with this access, you can view all logs in the workspace you have permission to. Queries in this mode are scoped to all data in all tables in the workspace. And are queried in the Log Analytics workspace itself. By accessing the workspace, selecting Logs from the left side menu and writing your query in the editor.

Or
Resource-context: this model is aimed at Application teams. Administrators of Azure resources being monitored. When you access the workspace for a particular resource, resource group, or subscription, such as when you select Logs from a resource menu in the Azure portal, you can view logs for only resources in all tables that you have access to.
Queries in this mode are scoped to only data associated with that resource. This mode also enables granular Azure RBAC.
For more information about designing your Azure Monitor Logs deployment there is more information in the following documentation.
Cheers!
Pierre
by Contributed | Dec 7, 2020 | Technology
This article is contributed. See the original author and article here.
CU8 for BizTalk Server 2016 is now ready to download
For details on fixes and download link, please follow the master KB
https://support.microsoft.com/help/4583530
You may want to bookmark this index page for updates related to BizTalk Server
https://support.microsoft.com/help/2555976
It is timely to reference two previous postings in this forum that are relevant to this release:
Hotfixes and CUs for BizTalk Server 2016 Feature Update
https://techcommunity.microsoft.com/t5/biztalk-server/hotfixes-and-cus-for-biztalk-server-2016-feature-update/m-p/1569583
BizTalk Server 2016 Standard Edition CU7 not available in german language?
https://techcommunity.microsoft.com/t5/biztalk-server/biztalk-server-2016-standard-edition-cu7-not-available-in-german/m-p/1642944

Recent Comments