by Contributed | Dec 14, 2020 | Technology
This article is contributed. See the original author and article here.
Azure resource logs for Azure Storage is now in public preview in the Azure public cloud. These logs provide detailed information about successful and failed requests to a storage service. This information can be used to monitor individual requests and to diagnose issues with a storage service. Compared with classic storage logs, Azure Monitor logs for Storage is extended to support:
- Resource logs for Azure Files
- Resource logs for premium block blob storage and premium file shares
- Resource logs for Azure Data Lake Storage Gen2
- More enhancements including authentication context, TLS version, and other attributes
- Native query and analysis experience with Log Analytics
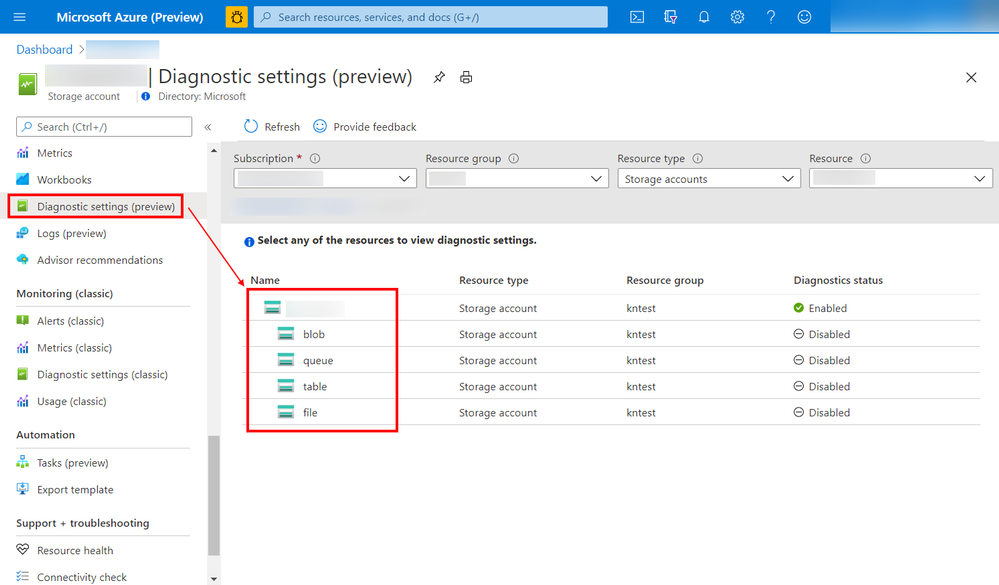
You can now configure diagnostic settings to consolidate storage logs to central storage accounts, send to Event Hub for streaming ingestion to SIEM tool or custom integration, or export to Log Analytics to query and analyze natively. Log export is charged per streaming volume. See Azure Monitor Pricing for details.
Screenshot of the configuration screen to set up the Storage logs
Learn more about this exciting new feature, and let us know what you think right here on the Tech Community!
by Contributed | Dec 14, 2020 | Technology
This article is contributed. See the original author and article here.
Cyber Security topic is one the most important topics in our mind when we develop application and systems on-perm or in cloud in general.
It is important to frequently perform and install security validations on applications. There are two important aspects for these security validations. First, developer should be able to detect any credentials or secrets in the code so developer can move them to a safe place. Also, DevOps and infrastructure team should be able to perform frequent security health checks on azure subscriptions.
In this series, I will go over very useful tools which help to improve the security of application and cloud resources. In Part 1, I will discuss CredScan. Part 2 will focus on secure DevOps Kit for Azure or AzSK and Part 3 will focus on Azure Sentinel and security health.
Managing Credentials in the Code with CredScan
The first aspect as we mentioned is the ability to detect any creds or secrets. Developer should be able to catch it before committing the code to Repo or during the pipeline process itself.
We all know it is easy to leave credentials in the code, especially in large projects. Team can always try to check for credentials manually, but it is not recommended way to look for sensitive information.
Credential Scanner (aka CredScan) is a tool developed and maintained by Microsoft to identify credential leaks such as those in source code and configuration files. Some of the commonly found types of credentials are default passwords, SQL connection strings and Certificates with private keys.
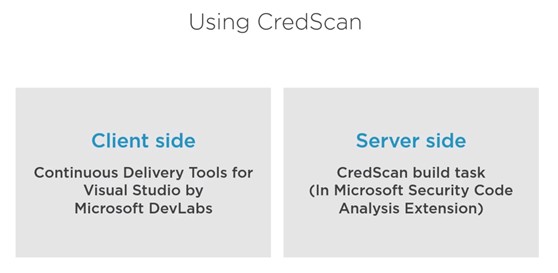
There are two version of CredScan server and client side as it shows in the following diagram
The client side
It is extension and currently support VS 2017 and you can download it from here
After installing the extension then we are ready to code and build and if our code has certain credential, the tool will catch it as following.

The downside for the client side there is no extension for VS 2019 or VS code yet. As Alternative for developers who are interested in installing first line of defense for creds scanning please refer to my blog git secrets
CredScan Server Side implementation
In order to use the server side version, developer needs to include “CredScan Build” task in project pipeline. For more information about obtaining Microsoft Security Code Analysis Extension, please review this document.
In Azure DevOps, we can add the tasks in Classic build Editor, CredScan can be added direct using search box

After adding the task, developer or DevOps engineer can fill the detail of the task
Available options include:
- Display Name: Name of the Azure DevOps Task. The default value is Run Credential Scanner
- Tool Major Version: Available values include CredScan V2, CredScan V1. We recommend customers to use the CredScan V2 version.
- Output Format: Available values include TSV, CSV, SARIF, and PREfast.
- Tool Version: We recommend you select Latest.
- Scan Folder: The repository folder to be scanned.
- Searchers File Type: The options for locating the searchers file that is used for scanning.
- Suppressions File: A JSON file can suppress issues in the output log. For more information about suppression scenarios, see the FAQ section of this article.
- Verbose Output: Self-explanatory.
- Batch Size: The number of concurrent threads used to run Credential Scanner. The default value is 20. Possible values range from 1 through 2,147,483,647.
- Match Timeout: The amount of time in seconds to spend attempting a searcher match before abandoning the check.
- File Scan Read Buffer Size: The size in bytes of the buffer used while content is read. The default value is 524,288.
- Maximum File Scan Read Bytes: The maximum number of bytes to read from a file during content analysis. The default value is 104,857,600.
- Control Options > Run this task: Specifies when the task will run. Select Custom conditions to specify more complex conditions.
- Version: The build task version within Azure DevOps. This option isn’t frequently used.

In YAML Pipeline Editor, Here is example for CredScan YAML task.
parameters:
  pool: 'Hosted VS2017'
  jobName: 'credscan'
  displayName: Secret Scan

jobs:
- job: ${{ parameters.jobName }}
  pool:
    name: ${{ parameters.pool }}

  displayName: ${{ parameters.displayName }}

  steps:
  - task: securedevelopmentteam.vss-secure-development-tools.build-task-credscan.CredScan@2
    displayName: 'Scan for Secrets'
    inputs:
      suppressionsFile: tools/credScan/suppress.json
      toolMajorVersion: V2
      debugMode: false
After adding the task, the pipeline will pass successfully only after passing CredScan task.
Summary
In this Part 1, we discussed the important of implementing first line of defense against credential leak by using CredScan client-side extension or CredScan task. In the next blog I will explore using AzSK to secure DevOps.
by Contributed | Dec 14, 2020 | Technology
This article is contributed. See the original author and article here.
Azure Security Center performs continuous assessment of your cloud workloads and provides the recommendations concerning the security of the environment. Azure Security Center covers scenarios by offering Cloud Security Posture Management (CSPM) and Cloud Workload Protection Platform (CWPP) capabilities (read this article for more details).
To cover the threat detections for the CWPP scenario you need to upgrade Security Center to Azure Defender. Azure Defender uses a variety of detection capabilities to alert you of potential threats to your environment. Azure Defender’s threat protection includes fusion kill-chain analysis, which automatically correlates alerts in your environment based on cyber kill-chain analysis, to help you better understand the full story of an attack campaign. The alerts can tell you what triggered the alert, what in your environment was targeted, the source of the attack, and remediation steps. You also have the flexibility to set up custom alerts to address specific needs in your environment.
Azure Sentinel is a cloud-native Security Information and Event Management (SIEM) and Security Orchestration, Automation and Response (SOAR) solution. Azure Sentinel’s role is to ingest data from different data sources and perform data correlation across these data sources. On top of that, Azure Sentinel leverages intelligent security analytics and threat intelligence to help with alert detection, threat visibility, proactive hunting, and threat response.
When Azure Defender detects/triggers alerts, you can stream these alerts to your own SIEM solution. By doing this you can quickly view what needs your attention from one management interface and take an appropriate action.
In this blog, we will walk you through how alerts from Azure Defender integrates with Sentinel providing Sentinel with security recommendations, alerts, and analytics. When integrated together how they operate in a better together scenario.
Integration
Azure Sentinel leverages data connectors which give you that holistic rich view across multiple data sources. To stream Azure Defender alerts in to Azure Sentinel, the first step is to configure this integration by adding Azure Security Center connector. You can connect to Azure Security Center data connector by following the steps from this article.
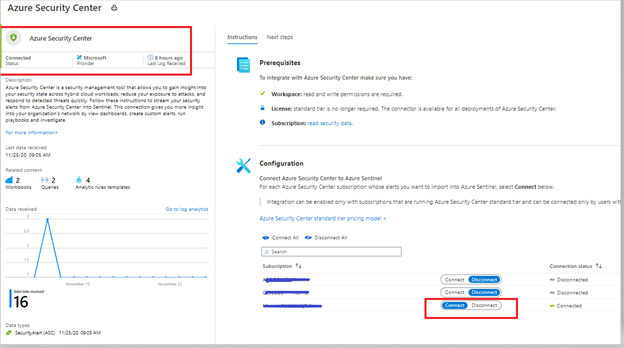
After following the steps from the article mentioned in the previous paragraph, you can confirm the connectivity (as shown in the figure below).
Image 1: Confirming the connectivity of Azure Security Center connector in Azure Sentinel
Investigating an Azure Defender alert in Azure Sentinel
In this example, we are analyzing an alert which is using Fusion analytics that automatically correlates alerts in the environment based on cyber kill-chain analysis to help better understand the full attack surface as to where it started and what kind of impact it had on the resources. To learn more about Cloud smart alert correlation (also known as fusion), please read our documentation here.
 Image 2: Security Center Alerts page
 Image 3: Fusion Analytics correlation
As you notice in image 3, Fusion technology has correlated different severity alerts and contextual signals together.
The left pane of the security incident page shows high-level information about the security incident like, alert description, severity, activity time and affected resources. The right pane of security incident page contains information about the Alerts and their description.
 Image 4: Take action Tab of Azure Security Center
Switch to the Take Action tab (as shown in Image 4) to know more information on how to Mitigate the threat, review the related recommendations identified on this affected resource under prevent future attacks.
Trigger automated response option will provide you the option to trigger a Logic App as a response to this security alert. Setting up an automation reduces overhead and helps you take care of incidents automatically and quickly. Review our Github repository to find different automation artifacts that you can leverage to resolve the alerts or recommendations in Security Center.
Suppress similar alerts option gives you an option to suppress future alerts with similar characteristics if alert isn’t relevant for your organization. Please review this article to understand how you can benefit from this feature.
To further investigate this alert, let’s navigate to Azure Sentinel. One of the benefits of triaging incidents in Azure Sentinel is that you can start from a holistic high-level view and zoom in on relationships, often found in related entities or notable events. Azure Sentinel helps you in identifying and correlating those in a couple of ways. In addition, Azure Sentinel offers powerful hunting capabilities to find that needle in the haystack.
In this blogpost, we will provide a couple of examples of those options.
Triaging the Azure Defender incident in Azure Sentinel
When we pivot over the Azure Sentinel, we can see the same incidents appearing in our triage view:
 Image 5: Incidents pane of Azure Sentinel
Looking at the details of our incident, we can see the affected entities and can start our investigations from there, or we can pivot over to the sending source, in our case Azure Security Center:

When we look more closer, we quickly see that more sources are reporting suspicious activities related to our affected entities, which we need to investigate:
 Image 6: Example of Open incidents from Azure Sentinel
We can run investigations in several ways, one is a visual investigation:
Zooming in on our suspicious entity, our server, we can see a lot more to investigate, including a timeline of events:
 Image 8: Timelines of events
This is a clear signal that this is a true positive which we should be escalating for further investigation. We can add our findings to the incident comment section and take a couple of counter measures to isolate our servers by leveraging a block IP action which we have discovered as being a malicious IP address. You can find the Logic App playbook here. This playbook has been authored to block a brute force attack IP address, but can also be used to block any IP address.
In our investigation we also saw that an Azure Active Directory user was affected:
 Image 9: Azure Active Directory user that was affected
The second preventive counter measure we will take is to confirm that this is a risky user, by leveraging a confirm risky user playbook and reset the user’s password.
Before we escalate the incident to our investigations team, we create a ticket in ServiceNow, add our findings to the incident comments and continue our triage.
A usual question we receive at this point is, “When I use the Azure Security Center data connector in Azure Sentinel and generate Incidents, what happens when I close my Azure Sentinel Incident, does it close the related Azure Security Center alert?”
The short of this is it does not. The Azure Sentinel Incident closes, but the ASC Alert remains active. Some customers prefer to keep the alerts active in ASC, while they are closing the incident in Azure Sentinel and some of our customers prefer to close the incident or alerts at both ends. You also have the option to suppress the ASC Alert manually in the ASC Portal. If the outcome of your incident triage is complete and you decide to close the incident in Azure Sentinel, you can use and invoke this Logic App Playbook which will close the incident in Azure Sentinel and dismisses the alert in Azure Security Center. This article describes how to run a Logic App Playbook. Azure Sentinel also allows you to invoke a Logic App Playbook automatically upon creation of an incident, which is described here.
Hope you enjoyed learning our better together story of Azure Security Center and Azure Sentinel.
Acknowledgements
This blog was written in collaboration with my super talented colleague Tiander Turpijn, Senior Program Manager and reviewed by the God of Azure Security Center, Yuri Diogenes, Principal Program Manager
by Contributed | Dec 14, 2020 | Technology
This article is contributed. See the original author and article here.
Earlier in fall 2020, we were pleased to announce that Surface Pro X users and others with Windows ARM 64 devices could download Microsoft Teams for ARM64. And although the Teams client is not yet available via Microsoft 365 Enterprise channels, there’s a command line tool that provides a temporary workaround for commercial customers who want to deploy the ARM64 client across their organization.
And you can still deploy the Teams ARM64 client as a Win32 application package using the Intune Management Extension, which also supports ARM64 application deployments.
Until the ARM64 Microsoft Teams client is available via the Microsoft 365 Enterprise channel, we wanted to provide some steps to help you deliver the client using Microsoft Intune, part of Microsoft Endpoint Manager.
- Begin by reviewing the following documentation: Install Microsoft Teams using Microsoft Endpoint Configuration Manager, which includes guidance for x86 and x64 platforms.
- Download the Win32 Content prep tool for Intune. Yes, even though it is called Win32, this versatile command line tool can also be used for ARM64 packages.
- Download the Microsoft Teams ARM64 installer.
- Follow these instructions for wrapping and packaging the installer.
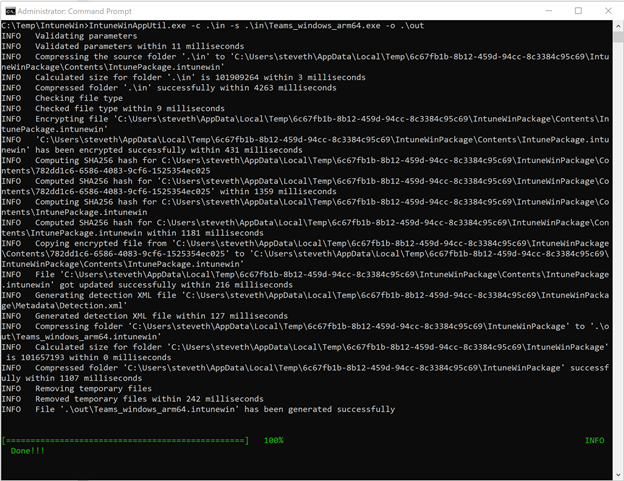
- When you run the Win32 Content prep tool, you can follow the prompts to enter required parameters or choose from other available parameters if needed. Here’s an example:
- Once the .IntuneWin package has been created, you can upload the application package into your Intune tenant and deploy it as a Win32 application package. Refer to the following documentation for the processes and steps: Add, assign, and monitor a Win32 app in Microsoft Intune.
Special thanks to Steve Thomas in our Commercial Management & Experiences Group for helping us out with these steps.
by Contributed | Dec 14, 2020 | Technology
This article is contributed. See the original author and article here.
Databases are essential workers in nearly all applications. They form the bedrock of a data architecture—handling transactions, record-keeping, data manipulation, and other crucial tasks on which modern apps rely. But for as long as databases have existed, people have looked for ways to speed them up. With databases so central to data architecture, even small reductions in throughput or latency performance can cause ripple effects that make the rest of the application sluggish and create a disappointing user experience. And there are financial repercussions too—one study found that the probability of a web site visitor bouncing rose by 90% if the page load time increased from one second to five seconds. This problem will likely become even more pronounced as web and mobile traffic increase. The solution isn’t always simple—scaling up databases can be expensive, and may not solve throughput or latency issues.
Caching Can Improve Application Performance
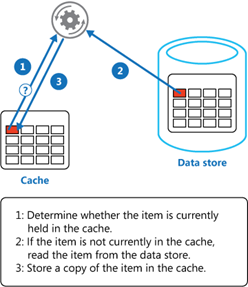
One way you can improve the performance of your data architecture is by implementing caching. In common setups like a cache-aside architecture, the most used data is stored in a fast and easy-to-access cache. When a user requests data, the cache is checked first before querying a database.
Combined with a relational database, a cache can store the most common database queries and return these queries much faster than the database when the application requests them. Not only can this result in significant reductions in latency, but it also reduces the load on the database, lowering the need to overprovision. Additionally, caches are typically better than databases at handling a high throughput of requests—enabling the application to handle more simultaneous users.
Caches are typically most beneficial for read-heavy workloads where the same data is being accessed again and again. Caching pricing, inventory, session state, or financial data are some examples of common use-cases. It’s important to note that caching won’t speed up operations internal to a database (like joins). Instead, caching lessens the need for those operations to occur by returning the results of a query before it reaches the database.
Redis Cache
Redis is one of the most popular caching solutions in the market. It is a key-value datastore that runs in-memory, rather than on disk like most databases. Running in-memory makes it lightning-fast, and a terrific complement to more deliberate and consistent primary databases like Azure SQL Database or PostgreSQL. Redis is available as a fully-managed service on Azure through Azure Cache for Redis, offering automatic patching and updates, high-availability deployment options, and the latest Redis features. Azure Cache for Redis can neatly plug into your Azure data infrastructure as a cache, allowing you to boost data performance. But by how much? We decided to put it to the test.
Performance Benchmark Test
To measure the performance boost from using Redis in conjunction with a database, we turned to GigaOm to run benchmarks on the performance of Azure SQL Database with and without caching. Azure SQL Database is a good point of reference—it’s a highly advanced and full-featured database that is heavily utilized by the most demanding customers. While it already has great price-performance, adding Redis can help accelerate that performance from great to outstanding. To measure this, GigaOm created a sample application based on a real-world example: users viewing inventory on an e-commerce site and placing items into their shopping cart. This test was designed to be realistic while also featuring the benefits of caching. It was run twice: once with just Azure SQL Database handling the inventory and shopping cart data, and once with Azure SQL Database plus Azure Cache for Redis.

Azure App Service was used to host the sample application, and JMeter was used to provide simulated traffic. For each test, additional simultaneous users were periodically added until the database or cache returned errors. GigaOm looked at two performance metrics: throughput and latency.
Throughput Performance Increased by over 800%
Throughput is a measurement of how much traffic the application can handle simultaneously. High throughput capability is essential to businesses that handle a lot of users or data—especially if demand tends to spike periodically. Azure Cache for Redis can handle millions of simultaneous requests with virtually no slowdown, making it highly suited for enhancing throughput performance. The test results showed this clearly:
 Source: GigaOm
Scaling up Azure SQL Database from 8 vCores to 32 vCores produced a 50% increase in throughput performance. While this is useful, adding additional vCores has limited impact on IOPS performance which was the bottleneck factor here. Adding a cache was even more effective: maximum throughput was over 800% higher with Azure Cache for Redis, even when using a smaller database instance (2 vCores vs 8 vCores). That means more users, higher scalability, and better peak traffic performance—all without changing the core database infrastructure. Plus, scaling throughput with Azure Cache for Redis is typically much cheaper than scaling up the database.
Latency Performance Improved by Over 1000%
Latency measures the time duration between when a request for data is sent by the application and received from the database. The lower the latency, the snappier the user experience and the faster data is returned. Azure Cache for Redis is particularly effective at operating with low latency because it runs in-memory. The benchmarking demonstrated this strongly:
 Source: GigaOm
Latency is typically measured at the 95th percentile level or above because delays tend to stack up. This is the “drive-thru” effect. If an order in front of you takes ten minutes, you do not care if your order takes only a few seconds—you had to wait for their order to be completed first! In our test, adding Azure Cache for Redis decreased the 95th percentile latency from over 3s down to 271ms—over a 1000% improvement. At the 99th and 99.9th percentile levels, the difference was even greater. Lower latency means faster applications and happier users, and Azure Cache for Redis is a great way for you to achieve the latency you need.
Try Azure Cache for Redis Today
Azure SQL Database is already a great database with excellent price-performance. Coupled with Azure Cache for Redis, this price-performance edge is amplified even further with a powerful solution for accelerating the throughput and latency performance of your database. Even better, Azure Cache for Redis fits into your existing data architecture and can often be bolted on without requiring huge application changes. Read the full benchmarking report, explore our free online training, and access our documentation to learn more.
Performance claims based on data from a study commissioned by Microsoft and conducted by GigaOm in October 2020. The study compared the performance of a test application using an Azure database with and without implementing Azure Cache for Redis as a caching solution. Azure SQL Database and Azure Database for PostgreSQL were used as the database element in the study. A 2 vCore Gen 5 General Purpose instance of Azure SQL Database and a 2 vCore General Purpose instance of Azure Database for PostgreSQL were used with a 6 GB P1 Premium instance of Azure for Redis. These results were compared with 8, 16, 24, and 32 vCore Gen 5 General Purpose instances of Azure SQL Database and 8, 16, 24, and 32 vCore General Purpose instances of Azure Database for PostgreSQL without Azure Cache for Redis. The benchmark data is taken from the GigaOm Web Application Database Load Test which simulates a common web application and backend database barraged by increasing HTTP requests. Actual results may vary based on configuration and region.

Recent Comments