by Contributed | Nov 11, 2020 | Technology
This article is contributed. See the original author and article here.
In certain conditions, we may need to monitor all HTTP/HTTPS traffic from APIM self-hosted gateway, which is deployed into Linux Docker Container.
Capturing Fiddler trace is one of the available options. However, there are limitations:
- APIM self-hosted gateway image is built by Azure APIM product group and we cannot build the Fiddler tool into the container image.
- APIM self-hosted gateway is a Linux container. Fiddler Classic only works in Windows environment.
The instructions below guide you how to bypass the limitations and capture Fiddler trace in Linux containers (for APIM self-hosted gateway).
Pre-requirements:
Before starting, you must setup the environment at first.
To set up a local development environment, you need to have:
- API Management instance. If you don’t have one, please follow this tutorial.
- Deploy an Azure API Management self-hosted gateway to Docker. If you don’t have one, please follow this tutorial.
- Install Fiddler Classic into your local computer. To download Fiddler Classic, please click this link.
Steps to implement:
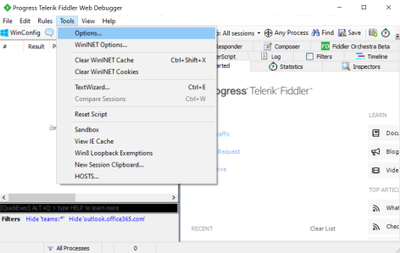
- Open Fiddler. Go to Options… => Connections, select Allow remote computes to connect. In the screenshot below, Fiddler listens on port 8888. Then Fiddler will capture traffic from another machine (any OS).


- Go to HTTPS and DISABLE Decrypt HTTPS traffic.

- Open CMD on the start menu. Check your local IP with the command ipconfig. My IP is 100.64.77.231 as shown in the screenshot below.

- Open the file env.conf for the APIM self-hosted gateway. Specify the HTTP/HTTPS proxy here. Fiddler by default listens the port 8888, as discussed in the Step One.

- Deploy the Docker container by following this tutorial. Please use the modified file env.conf in step 4.
- Use command “docker exec your-container-id env” to check if HTTP/HTTPS proxy is enabled as environment variables within the docker container. As shown in the screenshot below, the traffic is flowed into the Fiddler, but the HTTPS requests are still encrypted.

- If we need to decrypt the HTTPS traffic, we need to install Fiddler root certificate into the container CA certificate list. Go back to Fiddler. Open Options => HTTPS => Actions. Select Export Root Certificate to Desktop. The certificate name should be FiddlerRoot.cer by default.

- Copy the root certificate to the docker container by using the following command:
- docker cp C:Usersyour-user-nameDesktopFiddlerRoot.cer your-container-id:/home/fiddlerPublicCert.cer
- As update CA certificates in the Docker container needs the admin permission, we can exec into the Docker container in iterative mode by using the following command:
- docker exec -u root -it your-container-id /bin/sh
- Update the CA certificates to enable the fiddler root cert by the following command:

- Go back to Fiddler. Open Options => HTTPS. Enable Decrypt HTTPS traffic.

- To test if Fiddler can capture the requests in Docker container, we can send the simple requests to the APIM self-hosted gateway via CURL. In the tests below, I sent two HEAD requests to the self-hosted gateway and Fiddler successfully capture both.


by Contributed | Nov 11, 2020 | Technology
This article is contributed. See the original author and article here.
Hi Team, it’s Eric Jansen again, here in part one of a series of discussions revolving around the extremely exciting topic of the DNS Analytical Log. Alright, maybe it’s not that exciting, so crack open your favorite energy drink and let’s chat. Today I’ll be talking about something that I’ve seen a number of requests for from our internal discussion groups that support engineers have posted asking on behalf of their customers. In summary, that question is: “Can the DNS Analytical Log be customized to only log certain data? I only care about X,Y, and Z when I’m digging through the logs; the rest just gets in my way and makes the log fill up faster than necessary.”
Well, boys and girls, I’m here to announce that you can both have your cake and eat it too. The answer is YES YOU CAN! Who’s excited!? Yeah…I hear ya, me too!
First things first though, for those that don’t know what the DNS Analytical Log is, read this. For everyone else, let’s move on to the exciting part – but first take another sip of your favorite energy drink – it’s a bit of a long read.
OK, so how do we go about doing this? Well, let’s pick it apart. We’ll treat it as if we’re doing a custom ETL trace defining the DNS Analytic provider and the data that we’re looking for – Primarily because, that’s what’s happening; it’s just a default configuration that gets reset every time you stop and start the built-in DNS Analytical Log. With that said though, lets run through an example of setting up a custom trace using PowerShell, and hopefully that’ll help you better understand the end result of what happens when I later modify the built-in DNS Analytical Log:
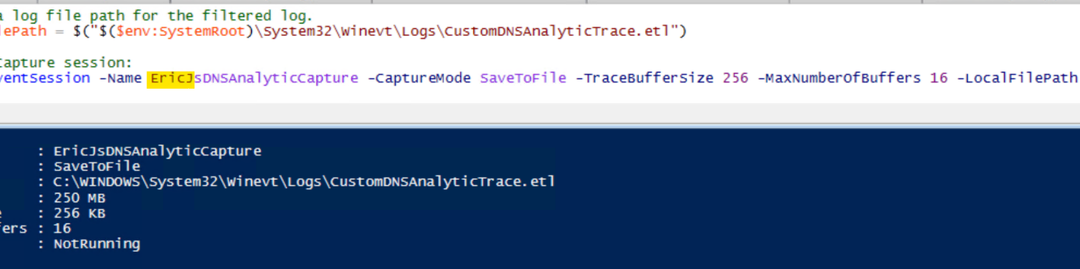
Step 1: Define a path to your .ETL and create an Event Session.

So far so good…
…Until it’s not so good. I say that because inevitably, some folks that try the above may get an error showing the following:

The issue that you’ll run into (if you get that error) is that you can only have one session running at a time. In this case, I tried to immediately start another event session after I already had one started. If another session is already running, you’d need to find what it is, and stop/remove it, if it’s not in use (in your lab, of course). You can do that by running Get-NetEventSession, and if you find an Event Session that’s running, you’ll need to Stop-NetEventSession, and finally you’ll need to remove it using Remove-NetEventSession. After that, you should be able to create your session.
Step 2: Figure out what options the DNS Analytics Provider offers, so that you can input data into Step 3.
For that, I wrote a little snippet of code to help you out:
function Get-ProviderKeyWordData ([Parameter(Mandatory=$true)]$Provider, [switch]$ShowLevels )
{
$ProviderKeywords = Get-WinEvent -ListProvider $Provider | select -ExpandProperty keywords
$ConvertedKeywordTable = @()

    Foreach ($Keyword in $ProviderKeywords){
    $KWConvertedToHex = "{0:x16}" -f $Keyword.value
    $KWHashTable = [Ordered]@{KeywordName = $Keyword.name;KeyWordValue = $("0x" + $KWConvertedToHex)}
    $ConvertedKeywordTable += New-Object psobject -Property $KWHashTable
    }
$ConvertedKeywordTable

$LevelData = @()
    IF($ShowLevels){
    $Levels = Get-WinEvent -ListProvider $Provider | select -ExpandProperty Levels
    foreach($Level in $Levels){$LevelData += New-Object psobject -Property @{DisplayName = $Level.DisplayName ;Level = $("0x" +$Level.Value)} }
    }

$LevelData | ft -AutoSize
}
Of course, all of my code comes with the following disclaimer:
This is a sample script. Sample scripts are not supported under any Microsoft standard support program or service. The sample scripts are provided AS IS without warranty of any kind. Microsoft further disclaims all implied warranties including, without limitation, any implied warranties of merchantability or of fitness for a particular purpose. The entire risk arising out of the use or performance of the sample scripts and documentation remains with you. In no event shall Microsoft, its authors, or anyone else involved in the creation, production, or delivery of the scripts be liable for any damages whatsoever (including, without limitation, damages for loss of business profits, business interruption, loss of business information, or other pecuniary loss) arising out of the use of or inability to use the sample scripts or documentation, even if Microsoft has been advised of the possibility of such damages.
With that out of the way, when you run the function, and define the DNS provider for the provider parameter value, it’ll display the KeywordNames and KeyWordValues, as well as the Level options, if you use the –ShowLevels parameter:

Step 3: Add the ETW provider to the Event Session with the specific options that you’d like to collect.
In this case, I was looking for Errors, with a KeyWordName of “RESPONSE_FAILURE”, however, because it’s a bitmask value, you can pick and choose as many options as you want. For the purposes of my demonstration, however, I’m just choosing the one value of interest. Also, note the required type casting for each variable in the screenshot below.


Step 3: Start the Session.

Step 4: So now, I’m going to switch it up a bit and look for AutoLoggers and/or Sessions that are using the “Microsoft-Windows-DNSServer“ Provider GUID, and it just happens to find the trace that I just started in the list. Interesting…

Step 5: Consume more of your energy drink, while collecting data, and then check your progress.

Step 6: OK, we’ve collected some data, let’s stop the trace and see what we’re able to find.

Indeed, it looks like the only data that we’re getting back is what we wanted – “RESPONSE_FAILURE” events with a level of “Error“. In this case, it’s showing domain names that are being blocked by Query Resolution Policies, that clients are attempting to query, but are being refused.
Step 7: We’ve validated that the trace only showed us what we wanted, so let’s remove the session since it’s no longer needed.

Alright, so now let’s see if we can apply this same logic to the built-in DNS Analytical Debug Log, but where do we begin? Well, if the default DNS Analytical Log is just an ETW session, let’s see what sessions are using the “Microsoft-Windows-DNSServer“ Provider GUID before and again after we start the DNS Analytical Log.
Before:

Enable the DNS Analytic Log:

After:

OK, so we’ve determined that once the built-in DNS Analytic Log is started, it creates an AutoLogger and a Session for collecting data, showing the default configuration for data collection. We’ve also determined that there’s a useful cmdlet named Get-ETWTraceProvider.. If only we could modify this, to meet our own requirements…. Perhaps there’s a Set-EtwTraceProvider?….prepare to be happy, because there is! Awesome.
OK, so, when we created the custom trace earlier, looking for AutoLoggers and Sessions that were using that provider you may have noticed that it only created a session when we did a Get-ETWTraceProvider -GUID ‘{EB79061A-A566-4698-9119-3ED2807060E7}’. With that said, all we really need to modify is the “EventLog-Microsoft-Windows-DNSServer-Analytical” session – no need to attempt to modify the AutoLogger.
So, let’s use the same logic that we did when we created the custom trace, when adding the provider to the event session, but with Set-EtwTraceProvider and see what happens:

Crash and burn. We failed with Access Denied.…. But what if we had more power? Let’s try to run as SYSTEM and see what happens. To do this I used a third-party function called Invoke-CommandAs, written by a Mr. Marc Kellerman that can be found on his Github page, here.
So, after running as system, it looks like there’s no more ‘Access Denied’ issues, AND the Level and KeyWord values match what I set them to.

I trust what I see above, but let’s verify to see what’s being logged:

Wouldya look at that!? When the log was initially started, it was collecting any / all DNS analytic events that met the criteria of the provider, but as soon as I modified the session, it changed to only the data of interest that I defined when running Set-ETWTraceProvider. I like it!
But do the changes persist, or does it reset to the default if I disable the log, and then re-enable the log? I may have already answered that above, but let’s see anyway:

The changes in fact DO NOT persist – some may prefer that, some may not. Fortunately, it’s all scriptable.
Well team, that’s all you get this time, but hopefully this proves to be useful to someone out there. Until next time, when we discuss more in regards to things that you can do with the DNS Analytical Log, and maybe talk about some of the Easter eggs in this blog posting.


Recent Comments