by Contributed | Nov 11, 2020 | Technology
This article is contributed. See the original author and article here.
Unlike SSMS 17.xx onwards; SSDT/DACFx currently doesn’t have “Parameterize for Always Encrypted” setting.
This causes DACPAC/DACFx deployments to fail when Pre/Post deployment scripts have DML (INSERT, UPDATE) on Always Encrypted columns.
We know Always Encrypted is driver based encryption technology, and for DML to work on Always Encrypted columns, query needs to be parameterized (SqlClient.SqlParameter).
SSMS has an option to “Parameterize for Always Encrypted”, which behind the scenes look for TSQL Variables and convert them to SqlClient.SqlParameter.
One way to achieve this with SSDT/DACFx deployments is to use parameterized Powershell script and calling PS1 directly in Pre/Post Deployment Script in SSDT.
Steps:
- Create parameterized powershell script for DML on Always Encrypted columns
- Call that powershell script directly in Pre/Post Deployment script
- Publish
Sample Powershell script for DML: TestPS.ps1
DB: TestDB
Always Encrypted Columns: fname, lname
$sqlConn = New-Object System.Data.SqlClient.SqlConnection
$sqlConn.ConnectionString = “Server=localhost;Integrated Security=true; Initial Catalog=TestDB; Column Encryption Setting=enabled;”
$sqlConn.Open()
$sqlcmd = New-Object System.Data.SqlClient.SqlCommand
$sqlcmd.Connection = $sqlConn
$sqlcmd.CommandText = “INSERT INTO dbo.t1 ([i],[t],[fname],[lname]) VALUES (@Param1, @Param2, @Param3, @Param4)“
$sqlcmd.Parameters.Add((New-Object Data.SqlClient.SqlParameter(“@Param1”,[Data.SQLDBType]::int)))
$sqlcmd.Parameters[“@Param1”].Value = “100”
$sqlcmd.Parameters.Add((New-Object Data.SqlClient.SqlParameter(“@Param2”,[Data.SQLDBType]::int)))
$sqlcmd.Parameters[“@Param2”].Value = “50”
$sqlcmd.Parameters.Add((New-Object Data.SqlClient.SqlParameter(“@Param3”,[Data.SQLDBType]::VarChar,10)))
$sqlcmd.Parameters[“@Param3”].Value = “PSTest”
$sqlcmd.Parameters.Add((New-Object Data.SqlClient.SqlParameter(“@Param4”,[Data.SQLDBType]::VarChar,10)))
$sqlcmd.Parameters[“@Param4”].Value = “PSTest”
$sqlcmd.ExecuteNonQuery();
$sqlConn.Close()
Sample Post Deployment Script to call TestPS.ps1
xp_cmdshell ‘powershell -Command “C:TestPS.ps1″‘
by Contributed | Nov 11, 2020 | Technology
This article is contributed. See the original author and article here.
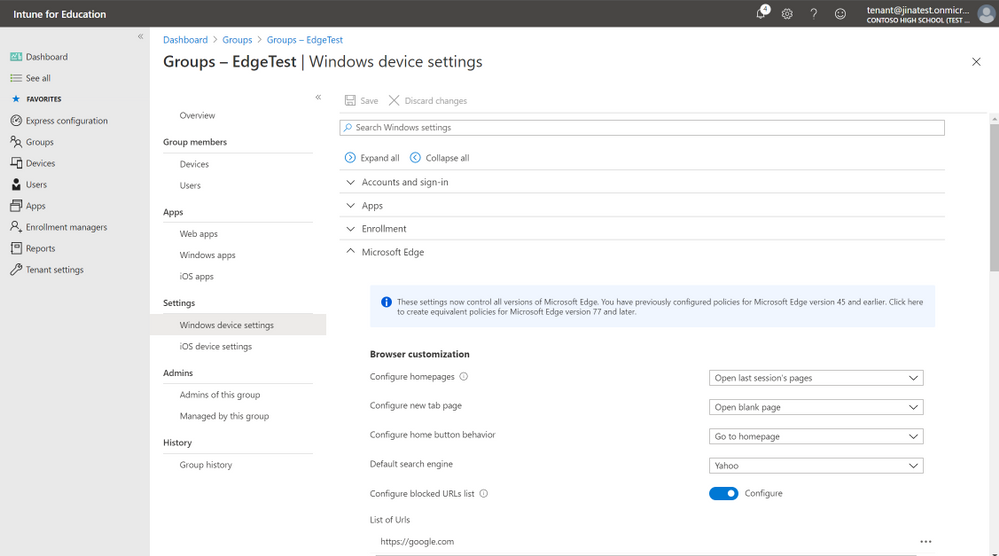
The Microsoft Edge settings in Intune for Education now control all versions of Microsoft Edge. If you’ve previously configured settings for Microsoft Edge version 45 and earlier, you will see an info bubble:

and have the option to create equivalent policies for Microsoft Edge version 77 and later.

Once you click “Save” the settings you have previously configured for Microsoft Edge version 45 and earlier will also be created for Microsoft Edge version 77 and later and going forward the settings you see in Intune for Education will control all versions of Microsoft Edge unless otherwise stated.

Let us know if you have any questions or feedback by responding to this post or tagging @lizforeducation on twitter.
by Contributed | Nov 11, 2020 | Technology
This article is contributed. See the original author and article here.
Initial Update: Wednesday, 11 November 2020 21:46 UTC
We are aware of issues within Metric Alerts starting around 9 AM UTC and are actively investigating. Some customer using Azure Monitor may experience failure notifications when performing service management operations such as create and update for Azure Metric Alert Rules.
- Work Around: None
- Next Update: Before 11/12 00:00 UTC
We are working hard to resolve this issue and apologize for any inconvenience.
-Eric Singleton
by Contributed | Nov 11, 2020 | Technology
This article is contributed. See the original author and article here.
In our previous post about the Azure Logic Apps (Preview) extension for Visual Studio Code, we provided an deep dive into how the redesigned Logic Apps runtime is hosted as an extension on the Azure Functions runtime. We also covered how the runtime interprets a workflow definition as jobs that are durably run by the Logic Apps orchestration engine.
In this post, we explore the telemetry that the runtime emits during workflow execution along with other emitted events. You can use this telemetry to get better visibility into how well your workflows run and how the runtime works in various ways. This post also describes how you can monitor your workflows by using Application Insights and learn about the available trace types that you can use for logging.
Integration with Application Insights
The redesigned runtime includes built-in integration with Application Insights, providing you near real-time telemetry (live metrics). This capability can help you investigate failures and performance problems more easily when you use this data to diagnose issues, set up alerts, and build charts.
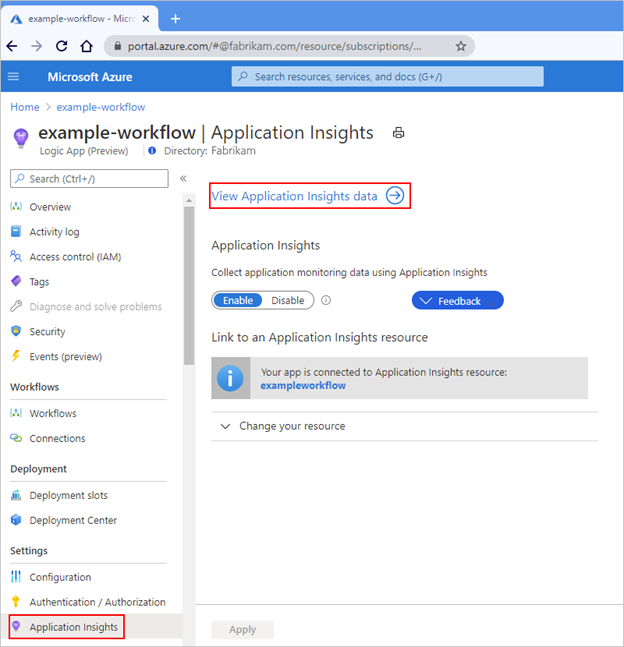
To open Application Insights for a logic app that you created using the preview extension and deployed to Azure, follow these steps:
- In the Azure portal, find your deployed logic app.
- On the logic app menu, under Settings, select Application Insights.
- If your subscription already has Application Insights enabled, on the Application Insights pane, select View Application Insights data.
If your subscription doesn’t have Application Insights enabled, on the Application Insights pane, select Turn on Application Insights. After the pane updates, at the bottom, select Apply.
For example, when Application Insights is already enabled, the pane looks like this:

When Application Insights isn’t enabled yet, the pane looks like this:

Application Insights opens and shows various metrics for your logic app, for example:

Available trace types
Each time that a workflow-related event happens, for example, when a workflow is triggered or when an action runs, the runtime emits various traces. These traces cover the lifetime of the workflow run and include, but aren’t limited to, the following types:
- Service activity, such as start, stop, and errors.
- Jobs and dispatcher activity.
- Workflow activity, such as trigger, action, and run.
- Storage request activity, such as success or failure.
- HTTP request activity, such as inbound, outbound, success, and failure.
- Ad-hoc development traces, such as debug messages.
Each event type is assigned a severity level. This table shows the severity level that’s assigned to each trace type:
Severity level
|
Trace type
|
Critical
|
Logs that describe an unrecoverable failure in your logic app.
|
Debug
|
Logs that you can use for investigation during development, for example, inbound and outbound HTTP calls.
|
Error
|
Logs that indicate a failure in workflow execution, but not a general failure in your logic app.
|
Information
|
Logs that track the general activity in your logic app or workflow, for example:
- When a trigger, action, or run starts and ends.
- When your logic app starts or ends.
|
Trace
|
Logs that contain the most detailed messages, for example, storage requests or dispatcher activity.
|
Warning
|
Logs that highlight an abnormal state in your logic app but doesn’t prevent its running.
|
You can adjust the severity level for the data that’s captured by your logic app and transmitted to Application Insights, based on the trace type that you want.
- In the Visual Studio Code project for your logic app, find the host.json file that exists at the project root location.
- Edit the host.json file by selecting the LogLevel enum value based on the trace type that you want.
The host.json file is included with the artifact that deploys to Azure Functions, along with other files such as the workflow.json file and connections.json file.
Sample host.json file
This example host.json file sets logging to the “Trace” severity level, which captures the most detailed messages, such as storage requests, plus all the messages that are related to workflow execution activity:
{
    "version": "2.0",
    "logging": {
        "logLevel": {
            "Host.Triggers.Workflows": "Trace"
        }
    }
}
The “logging” node controls the log type filtering for all the workflows in your logic app and follows the ASP.NET Core layout for log type filtering. To specify the log type for your logic app, in the “logLevel” object, set the “Host.Triggers.Workflows” property to log type that you want. For more information about logging in .NET Core, see Log filtering.
The next post in this series explores the ways that you can query the telemetry data for your logic app’s workflows. This post also covers the ways that you can track workflow behavior and the performance for your hosting environment.
by Contributed | Nov 11, 2020 | Technology
This article is contributed. See the original author and article here.
Heya, Ned here again. Storage Migration Service admins: if you’re seeing “Error HRESULT E_FAIL has been returned from a call to a COM component” during transfer validation after installing the November cumulative update, we have a workaround coming to WAC, watch for it to appear next 48 hours. Once you get it, you will be able to ignore the error (which is bogus) and proceed with transfer; this will allow us time to diagnose the real issue and have a real fix inside the Orchestrator itself. We still cannot reproduce this issue ourselves and suspect some networking environment issue in a small subset of customer environments.
Do not uninstall the November update as a workaround. I say again, do NOT do that. The update upgrades your database and cannot be reversed without deleting the DB.
– Ned “Hang in there” Pyle

Recent Comments