by Scott Muniz | Aug 11, 2020 | Uncategorized
This article is contributed. See the original author and article here.
Microsoft Defender ATP offers a variety of ways for security teams to investigate and assess threats and other critical information. The device timeline tab in the Microsoft Defender Security Center provides a chronological view of events and associated alerts that have been observed on the device.
While navigating the device timeline, you can search and filter for specific events to narrow down the list and help you pinpoint key information in your analysis. We’re excited to share that now you can also flag events, giving you the ability to highlight and then quickly identify events that are of importance to you and your team. The new event flagging capability will enables your security team to:
- Highlight the most important events
- Mark events that require a deep dive
- Build a clean breach timeline
Let’s take a look at how to use this new feature.

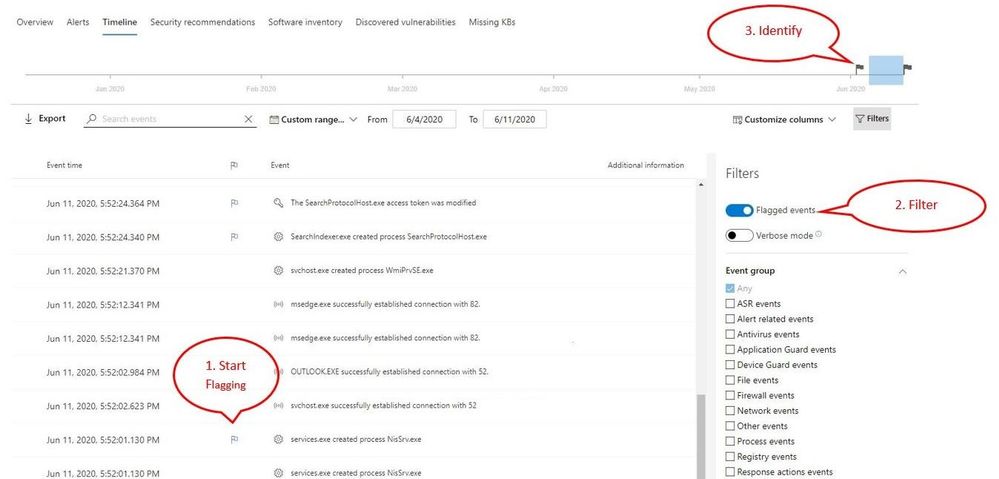
- Start by flagging events that you want to focus on
- Locate the flag column in the device timeline
- Flag events by hovering over the flag column next to events and clicking on the events you wish to flag
- View the flagged events
- In the timeline filters section, toggle on “Flagged events”
- Apply the filter
- Identify flagged events on the time bar to help you build a clean breach timeline
- Clicking the flag on the time bar will only show events prior to the flagged event
Applying the filter allows you to see only the eight flagged events over the month amongst thousands of events!

Example of a clean timeline
Getting started
This capability is in public preview and for those customers that have preview features turned on, you can start using event flagging today. If you haven’t yet opted in, we encourage you to turn on preview features in the Microsoft Defender Security Center.
To learn more about the Microsoft Defender ATP device timeline, please read our documentation.
If you’re not yet taking advantage of Microsoft’s industry leading security optics and detection capabilities for endpoints, sign up for a free trial of Microsoft Defender ATP today.
by Scott Muniz | Aug 11, 2020 | Azure, Microsoft, Technology, Uncategorized
This article is contributed. See the original author and article here.
With the recent release by HashiCorp and Microsoft of the Azure DevOps Provider 0.0.1 for Terraform we look at how to use these new features to create repeatable standardized projects into Azure DevOps.
Introduction.
In this article we are going to look at the new Terraform Provider for Azure DevOps. Firstly, lets provide some useful links:
At the time of authoring this article the provider is at version 0.0.1. Functionality is still a little limited and some of the documentation needs more detail, but all the basics are there.
So What Can I Do With This?
One question that has been asked many times is “Can I automate and template Azure DevOps Projects?”. Well, the answer is now yes.
The Terraform Azure DevOps Provider allows us to be able to create a standard Terraform deployment that creates a Project inside a DevOps Organization. We can use the resources to then describe what features we want enabled, disabled, or configured.
I have created a sample GitHub repo that holds the code examples we are going to look at below.
Ok, So Let’s Get Started.
Like many others, I tend to break my Terraform files up into smaller sub files to make things a little easier to navigate. In the GitHub Repo I have five .tf files:
- main.tf
- variables.tf (used to set my var. options cleanly)
- outputs.tf
- ado_repository.tf (we will cover this in more detail in the article)
- github_service_connection.tf (we will use this to setup a connection to the GitHub Repo)
I’m not going to cover what all of the files do in this article (there are some great blog posts out there already for that), but if you are interested in getting a detailed understanding of Terraform I recommend you check out our very own Adin Ermie.
Let’s start by taking a look at the main.tf file. The first area to note is that we need to define the org_service_url for Azure DevOps and personal_access_token we are going to use within the Provider Block.
The Organization Service URL is just the address to your DevOps org, for example https://dev.azure.com/myorg
Have a look at the following Microsoft document for detailed steps on how to setup a Personal Access Token in Azure DevOps.
main.tf
provider "azuredevops" {
  version = ">= 0.0.1"
  # Remember to specify the org service url and personal access token details below
  org_service_url = "xxxxxxxxxxxxxxxxxxxx"
  personal_access_token = "xxxxxxxxxxxxxxxxxxxx"
}

resource "azuredevops_project" "terraform_ado_project" {
  project_name       = var.project_name
  description        = var.description
  visibility         = var.visibility
  version_control    = var.version_control
  work_item_template = var.work_item_template
  # Enable or desiable the DevOps fetures below (enabled / disabled)
  features = {
      "boards" = "enabled"
      "repositories" = "enabled"
      "pipelines" = "enabled"
      "testplans" = "enabled"
      "artifacts" = "enabled"
  }
}
The rest of the arguments here are self-explanatory. we provide the basic options to setup the project and select to enable or disable the feature we require.
Next, we will look at the github_service_connection.tf. What we are doing here is defining a service connection into GitHub using GitHub Personal Access Tokens. Configuring GitHub PATs is documented here.
github_service_connection.tf
resource "azuredevops_serviceendpoint_github" "serviceendpoint_github" {
  project_id            = azuredevops_project.terraform_ado_project.id
  service_endpoint_name = "Sample GithHub Personal Access Token"

  auth_personal {
    # Also can be set with AZDO_GITHUB_SERVICE_CONNECTION_PAT environment variable
    personal_access_token = "xxxxxxxxxxxxxxxxxxxx"
  }
}
Finally, I am using an outputs.tf to return the newly created Project ID and Project URL.
outputs.tf
output "Project_ID" {
  value = azuredevops_project.terraform_ado_project.id
}

output "Project_URL" {
  value = azuredevops_project.terraform_ado_project.id
}
A Note About Repos.
Something that has been noted by a few people is that the Import option on the azuredevops_git_repository resource does not seem to work. Although documented as Import being a supported option (for public repos only at this time), it returns an error message.
Demo
Here is a quick demo of the code in action.
Wrap Up!
So thats it! A straightforward way to create Azure DevOps Projects within your Organization, simple and repeatable.
by Scott Muniz | Aug 10, 2020 | Uncategorized
This article is contributed. See the original author and article here.
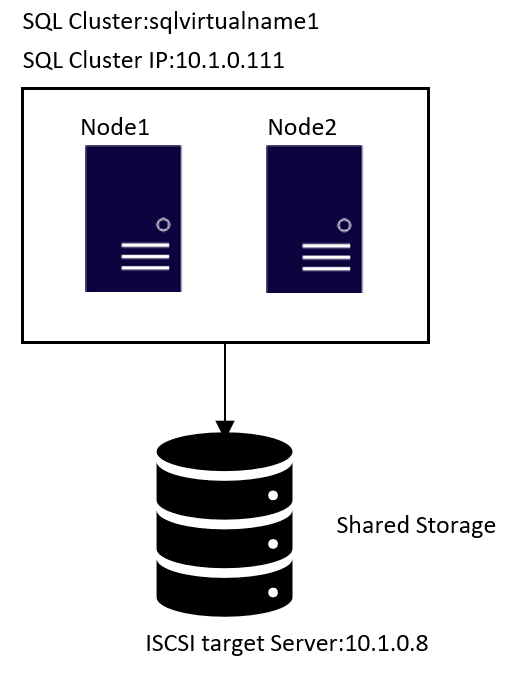
In the Windows world, SQL Server integrates into Windows Server Failover Cluster (WSFC) natively, and we have a dedicated installation for SQL Server Cluster. However, on Linux, you need to install standalone SQL Server instance in the nodes first, and then configure the instance as a SQL Server cluster instance.
I use SQL Server 2019 with RHEL 8.x in this tutorial, but it is possible to use SQL Server 2017 in RHEL 7.x or RHEL 8 to configure FCI.
Here is the step by step Video
Topology

1.ISCSI target server configuration
- The two highlighted two disks will be the used as Shared Storage.

sdc is for the database files in /var/opt/mssql/data
sdd is for the user databases files. If all your databases are stored /var/opt/mssql/data, feel free to ignore all the steps link to device sdd.
2.Run fdisk to create partition.
fdisk /dev/sdc
fdisk /dev/sdd

Run lsblk again

3.Install targetcli package.
yum -y install targetcli
4.Run targetcli to create ISCSI target server.
I created two ACLs entries for the node1 and node2:
iqn.2020-08.com.contoso:node1
iqn.2020-08.com.contoso:node2
I’m not going to dig into the targetcli command, please review this article for detail.

And I have following iscsi settings:

5.Run following bash command to expose tcp port 3260
firewall-cmd –add-port=3260/tcp –permanent
firewall-cmd –reload

- Enable and restart the target service.
systemctl enable target.service
systemctl restart target.service
2.ISCSI initiator configuration.
Choose one of the servers that will participate in the FCI configuration. It does not matter which one. I use node1 in this tutorial. Please note, All the steps in this section are performed in node1, unless stated otherwise.
1.Install iscsi-initiator-utils in all nodes.
sudo yum install iscsi-initiator-utils -y
2.Edit the /etc/iscsi/initiatorname.iscsi , replace the existing value with following keywords, the one I used in step 4 of section[ISCSI target server configuration]
InitiatorName=iqn.2020-08.com.contoso:node1

3.Discover iSCSI disk of the target.
iscsiadm -m discovery -t st -p <ip of iscsi target server>
Here is the command in this tutorial.
iscsiadm -m discovery -t st -p 10.1.0.8

- (Optional step)After the discovery below database is updated.
ls -l /var/lib/iscsi/nodes

6.Make the connection to iscsi target.
iscsiadm –mode node –targetname iqn.2020-08.com.contoso:servers –login

- (Optional step)After logging in, a session with the iSCSI target is established.
iscsiadm –mode node -P 1

- (Optional step)If you review the messages file, you will see following keywords
sudo grep “Attached SCSI” /var/log/messages
Aug 6 01:38:21 localhost kernel: sd 3:0:1:0: [sdb] Attached SCSI disk
Aug 6 01:38:21 localhost kernel: sd 2:0:0:0: [sda] Attached SCSI disk
Aug 6 04:26:01 localhost kernel: sd 6:0:0:0: [sdc] Attached SCSI disk
Aug 6 04:26:01 localhost kernel: sd 6:0:0:1: [sdd] Attached SCSI disk
9.Create physical volumes on the iSCSI disks.
sudo pvcreate /dev/sdc
sudo pvcreate /dev/sdd

10.Create volume groups ‘FCIDataVG1’ and ‘FCIDataVG2’ on the iSCSI disk.
sudo vgcreate FCIDataVG1 /dev/sdc
sudo vgcreate FCIDataVG2 /dev/sdd

- Create logical name for the two groups. Run following commands in node1.
sudo lvcreate -L599G -n FCIDataLV1 FCIDataVG1
sudo lvcreate -L499G -n FCIDataLV2 FCIDataVG2

Check the device

- Format the logical volume with a supported filesystem.
sudo mkfs.xfs /dev/FCIDataVG1/FCIDataLV1
sudo mkfs.xfs /dev/FCIDataVG2/FCIDataLV2

13.Repeat the step1~step6 in rest of the nodes.
Please note,
1)Do not do step6 in rest of node2 before step12 is completed in node1. Else you maybe not able to failover.
2)All the steps but step 2 are exactly same. Here is the value for node2

3)After the step6 is executed in rest of the nodes, you will see the same devices as node1.
Here is a screenshot of node2 after step 6 is executed.

3.SQL Server configuration.
Please note, All the steps in section are performed in node1, unless stated otherwise.
1.Run following queries to create login used by pacemaker
CREATE LOGIN [sqlpackmaker] with PASSWORD= N’YourStrongP@ssword1′
ALTER SERVER ROLE [sysadmin] ADD MEMBER [sqlpackmaker]
2.Drop the default server name and create a new server name. The new server name is SQL Virutal name.
exec sp_dropserver node1
go
exec sp_addserver ‘sqlvirtualname1′,’local’
- Restart SQL Server to take effect.
sudo systemctl stop mssql-server
sudo systemctl restart mssql-server

4.Run following queries to check change.
select @@servername, SERVERPROPERTY(‘ComputernamephysicalNetBIOS’)

5.Stop SQL Server in all nodes(node1,node2 ).
sudo systemctl stop mssql-server
6.Copy the /var/opt/mssql/secrets/machine-key of node1 to node2.
7.Create temporary directories to store the SQL Server data and log files.
mkdir /var/opt/mssql/tempdir
mkdir /var/opt/mssql/tempuserdata

8.Copy the SQL Server data and log files to the temporary directories.
cp /var/opt/mssql/data/* /var/opt/mssql/tempdir/
cp /var/opt/mssql/userdata/* /var/opt/mssql/tempuserdata/

9.Delete the files from the existing SQL Server data directory in node1.
rm -f /var/opt/mssql/data/*
rm -f /var/opt/mssql/userdata/*

10.Mount the iSCSI logical volume in the SQL Server data folder.
mount /dev/<VolumeGroupName>/<LogicalVolumeName> <FolderName>
Here are the commands in this tutorial.
mount /dev/FCIDataVG1/FCIDataLV1 /var/opt/mssql/data
mount /dev/FCIDataVG2/FCIDataLV2 /var/opt/mssql/userdata

11.Change the owner of the mount to mssql.
chown mssql:mssql /var/opt/mssql/data
chown mssql:mssql /var/opt/mssql/userdata

12.Change ownership of the group of the mount to mssql.
chgrp mssql /var/opt/mssql/data
chgrp mssql /var/opt/mssql/userdata

13.Copy the files from temp folders back to /var/opt/mssql/data and /var/opt/mssql/userdata.
cp /var/opt/mssql/tempdir/* /var/opt/mssql/data
cp /var/opt/mssql/tempuserdata/* /var/opt/mssql/userdata

14.Check the two temp folders and make sure the files are copied.

- Change ownership of files to mssql.
chown mssql:mssql /var/opt/mssql/data/*
chown mssql:mssql /var/opt/mssql/userdata/*

16.Configure auto mount to make the OS mount the devices automatically.
1) makeGet the UUID. Please downdown the UUID ,TYPE and directory
blkid /dev/FCIDataVG1/FCIDataLV1
blkid /dev/FCIDataVG2/FCIDataLV2

2).Edit /etc/fstab to configure auto mount in node1,node2.
Here is a screenshot in node1.

Please review this article for more detail
4.Cluster configuration.
1.Edit /etc/hosts to speicfy the node and ips in node1 and node1. Do the same thing in node1 and node2

2.Create a file to store the SQL Server username and password for the Pacemaker login. Run the following command in node1 and node2 (The same login name and password specified in step 1 of section [SQL Server configuration]
sudo touch /var/opt/mssql/secrets/passwd
sudo echo ‘sqlpackmaker’ >> /var/opt/mssql/secrets/passwd
sudo echo ‘YourStrongP@ssword1’ >> /var/opt/mssql/secrets/passwd
sudo chown root:root /var/opt/mssql/secrets/passwd
sudo chmod 600 /var/opt/mssql/secrets/passwd
3.On both cluster nodes, open the Pacemaker firewall ports. To open these ports with firewalld, run the following command in node 1 and node2
sudo firewall-cmd –permanent –add-service=high-availability
sudo firewall-cmd –reload
7.Install Pacemaker packages in node 1 and node2
sudo yum install pacemaker pcs fence-agents-all resource-agents
8.Set the password for the default user that is created when installing Pacemaker and Corosync packages. Use the same password in node 1 and node2
sudo passwd hacluster
9.To allow nodes to rejoin the cluster after the reboot, enable and start pcsd service and Pacemaker. Run the following command in node 1 and node2
sudo systemctl enable pcsd
sudo systemctl start pcsd
sudo systemctl enable pacemaker
10.Create the cluster. Run following command in node1. The password should be as same as the one in step 8.
sudo pcs host auth node1 node2
sudo pcs cluster setup sqlcluster node1 node2
sudo pcs cluster start –all
sudo pcs cluster enable –all

11.Disable the stonith-enabled for test purpose. Run following command in node1.
sudo pcs property set stonith-enabled=false
- Install the FCI resource agent for SQL Server. Run the following commands in node1 and node2
sudo yum install mssql-server-ha
13.Create disk resource and this resource belongs to a resource group(RGfci in this demo). Run following command in node1
sudo pcs resource create iSCSIDisk1 Filesystem device=”/dev/FCIDataVG1/FCIDataLV1″ directory=”/var/opt/mssql/data” fstype=”xfs” –group fci
sudo pcs resource create iSCSIDisk2 Filesystem device=”/dev/FCIDataVG2/FCIDataLV2″ directory=”/var/opt/mssql/userdata” fstype=”xfs” –group fci


14 Create IP resource that will be used by FCI, and this resource belongs to the same resource group created in previous step.
sudo pcs resource create vip2 ocf:heartbeat:IPaddr2 ip=10.1.0.111 nic=eth0 cidr_netmask=24 –group fci

15.Create FCI resource. The resource name should be exactly same to the SQL Virtual name created in step 2 in section [SQL Server configuration]
sudo pcs resource create sqlvirtualname1 ocf:mssql:fci –group fci

Failover
===
sudo pcs resource move sqlvirtualname1 <NodeName>

by Scott Muniz | Aug 10, 2020 | Uncategorized
This article is contributed. See the original author and article here.
MSTIC has observed an increasing number of Linux attackers encoding their scripts into Base64 both for ease of use and to avoid detection. Because the commands are encoded, it can be time-intensive and inefficient to hone in on malicious Base64-encoded commands by looking at raw log data. To solve this problem, we have created a Jupyter notebook that makes this process easier by scoring and ranking Base64 commands found in your Sentinel data. This notebook can be accessed here and will be explained in detail in this blog.
A blog series written last year covers the use of Jupyter notebooks in threat hunting in more detail. Here are links to Part 1, Part 2, and Part 3.
Other notebooks you can access now are available on the Azure Sentinel Notebook Github and cover Windows host exploration, IP Addresses, Domains & URLs, Linux hosts, and much more. These notebooks are all built using Microsoft Threat Intelligence Center’s Python API MSTICpy.
Please note that all notebooks are live on Github and under revision so be aware that the notebooks you use might be slightly different from those described in blog posts.
Intro
Many of our Azure customers use Linux virtual machines, and we are always looking for ways to help our customers in their security investigations. Thus, we’ve been working on expanding coverage on Linux-specific investigations. This Guided Hunting: Base64-Encoded Linux Commands Notebook was created in response to an increasing number of attackers encrypting their bash commands into Base64. This is often seen in crypto mining attacks. A specific case of this is discussed and analyzed here.
This notebook attempts to query for and analyze Base64-encoded commands found in execve logs in your Azure Sentinel workspace. It then walks you through an investigation and scoring process that will highlight the commands most likely to be malicious, which can focus your investigation down to individual hosts and lead to further exploration using the Linux Host Explorer Notebook or any other tools and methodologies you prefer.
This blog will walk you through the setup and use of this notebook. It may be helpful to run the notebook yourself as you read through it.
AUOMS Agent Setup
AUOMS is a Microsoft audit collection tool that can collect events from kaudit or auditd/audisp. The MSTIC research branch of it can forward events to Syslog, which can be collected and accessed on Azure Sentinel (see this link for more information on collecting Syslog in Sentinel), making it a great option for collecting command line data and parsing it for Base64 encodings. It can also be used for other command line parsing, which you can explore through your own Jupyter Notebooks or through queries on Sentinel.
AUOMS can be installed and set up through the Linux terminal. You will need to install it on each host you’d like to collect data from in your Log Analytics workspace.
This blog covers the installation and troubleshooting options in detail, as well as how you can create a Log Analytics workspace.
Once you’ve installed AUOMS, you may want to check if the currently distributed version from Log Analytics/Azure Sentinel includes the Syslog output option by default. Do this by running the following code from the terminal of the machine you want to test:
/opt/microsoft/auoms/bin/auomsctl status
This will check if AUOMS running and reveal its version if it is. If the version is 2.1.8 then it should include the Syslog output option. This means that if you put the syslog.conf file from the MSTIC-Research repo into the /etc/opt/microsoft/auoms/output.d directory and restart AUOMS it should start outputting to Syslog.
You may also want to check out some of these parsers to test your system once AUOMS is installed.
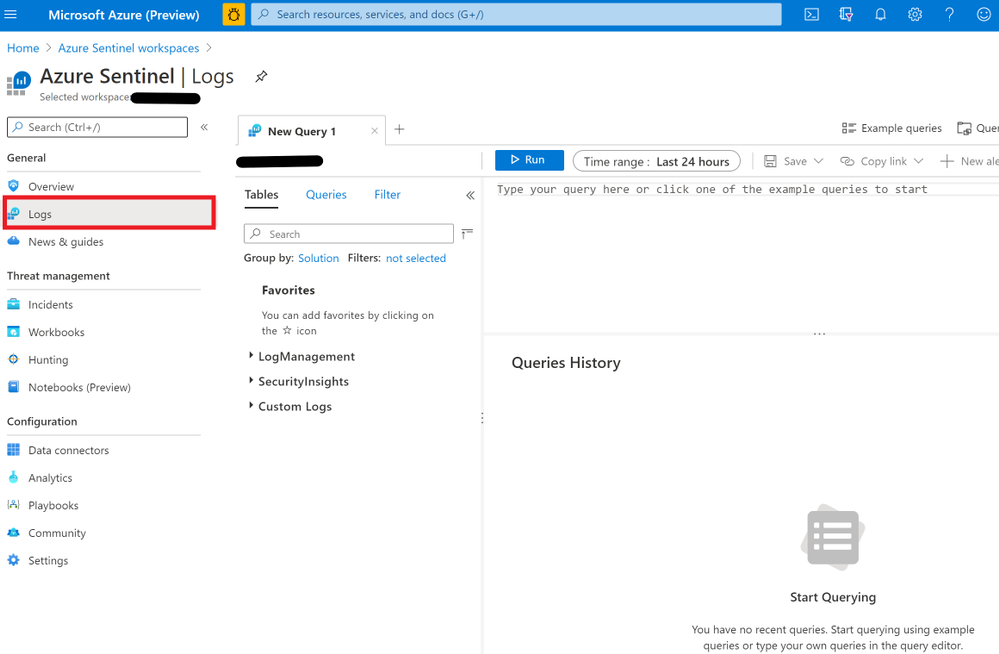
Once you have your machines connected to Log Analytics, you can run the parsing queries by following these steps:
- Go to the Azure Portal
- Search for “Azure Sentinel” in the search bar and press enter
- Choose your workspace
- Click “Logs” on the sidebar


This query is available in the SyslogExecve.txt file found in the Git repo.
Setting Up Jupyter Notebooks
You can run this notebook in Azure via Azure Sentinel’s notebook feature or locally. To run the notebook on Azure, see this link.
If you have never run a Jupyter notebook or are unfamiliar with the process, this article walks through installing and running Jupyter Notebook and Anaconda on your computer.
For a more friendly user interface, you can also try running Jupyter Lab locally. Jupyter Lab is included as an application within your Anaconda installation. By running Anaconda Navigator on your machine (search for “Anaconda Navigator” in your Start search bar), you should be able to choose between the two in the GUI.

It may be best to clone the Azure Sentinel Notebook repo first so you can use the guides to open up the Base64 Notebook when the installation is finished.
Configuring the Notebook
Once you have set up your Notebook environment, open up the Guided Hunting: Base64-Encoded Linux Commands notebook.
If you are unfamiliar with using a Jupyter notebook, you may want to take a look at the Getting Started with Azure Sentinel Notebooks notebook first. This notebook will guide you through the basics of Jupyter Notebook features and shortcuts, as well as some configuration tips and uses of notebooks in threat hunting.
The top of the notebook describes its purpose: to find and rank malicious command line data that has been encoded in Base64, with the hope that this will launch further investigation.
It also lists the Python edition and libraries that will be used and the other data sources that will be included in the investigation. Running the first cell in the notebook will confirm that all of the technical configurations are in place. If not, it lists options for troubleshooting.

We also recommend that at this point you fill out the msticpyconfig.yaml file found in the Azure Sentinel Notebooks folder. See the MSTICpy documentation if you need help.

At minimum, the notebook will require you to fill out the Azure Sentinel default workspace WorkspaceId and TenantId.
- The WorkspaceId can be found on the Workplace Settings tab of Azure Sentinel.

- The WorkspaceID will be on the first page once you’re there.

- The TenantID can be found on Azure Active Directory
- Search for Azure Active Directory in the Azure Portal and press enter.

- Your Tenant ID will be in the information box on the first page.

Threat Intelligence Configuration
To utilize Threat Intelligence in the notebook, you will also need to fill out TI Providers Section with at least one provider. In this blog’s examples, we show how to use AlienVault OTX and IBM XForce, as they accept many queries at once. VirusTotal is also shown since it is commonly used for TI investigations. Note, however, that it may not process multiple queries as quickly so results will be varied.
You can create free accounts on the following sites if you don’t have an account already.
To find your AuthKey, navigate to the API page sections/settings on these websites once you’ve made an account.
Connecting to Azure Sentinel
The next two cells will authenticate you with Azure Sentinel using MSTICpy’s data connector features. If you haven’t included your workplace ID and tenant ID in the msticpyconfig.yaml file, it will prompt you for them when you run the first cell. With this information, it will authenticate you with Log Analytics.
The second cell will authenticate you with your Workspace. Running it will load a feature called KQLMagic that will give you a code to paste into a separate browser window that will open. You can then log in with the appropriate Workspace credentials.

Set Time Parameters
After running the cell in the Set Time Parameters section following your authentication, you will be prompted to enter a time range using a slider and some input boxes. This is the time range the KQL query will use to search for Base64 commands so set it to the range you are investigating. Consider how many machines and how much data you will be querying when you set the time range, as that will affect performance.

Get Base64 Commands
In this section, the cell will run a query using the MSTICpy KQL functionalities and return a Python Pandas data frame you will be able to explore, similar to what you would see if you ran the same query in Log Analytics in your workspace on Sentinel.
You can edit this KQL query as if you were in Log Analytics if you want to specify a type of Base64 command or if you choose not to use AUOMS but have another equivalent data source. Note that the rest of the notebook relies upon the projected columns in their current format so if you make any changes, try not to change these columns. If you do, you will have to edit much of the rest of the notebook as well to accommodate those changes.

Categorize Decoded Base64 Commands
The cell in this section will tag all the commands pulled from the query with its relevant categories. These categories are based on the bash commands and files present in the decoded commands and what they tend to be used for.
- Network connections/downloading: wget, curl, urllib.urlopen
- File manipulation: chmod, chattr, touch, cp, mv, ln, sed, awk, echo
- Host enumeration: uname, grep, /proc/cpuinfo
- File/process deletion/killing: rm, pkill
- Archive/compression programs: tar, zip, gzip, bzip2, lzma, xz
Consider this a basic list of categories and commands to get started. If there are other categories or commands/file names/processes you want to look for and categorize here, feel free to add them to the code. This can be especially useful if you are looking for a specific type of command as you can create your own standards.
After the cell is run, it will display all unique decoded commands found and a list of their categories. This can help you focus your investigation if you’re looking for a certain pattern of behavior.

GTFOBins Classification
This is similar to the “Categorize Decoded Commands” section above, but uses the open source GTFOBins. GTFOBins is a vetted collection of bash commands frequently exploited by attackers as well as a reference as to how those commands may be used. We are using it to find potentially exploited commands in the dataset and tag those with their corresponding functionalities.
The first cell in this section will print out GTFO Functions and what they mean if you are unfamiliar. It may also help to take a look at the GTFOBins website itself.
Running the second cell will create two new columns in the data frame, “GTFO Bins” and “GTFO Functions,” and display these. The GTFO Bins column will consist of links to more information on the GTFOBins website.

Be aware that retrieving GTFO Functions may take a bit longer to run.
Generating Scores and Rankings
The cells under this section generate scores for each unique Base64 command based on criteria such as frequency of the command, severity of TI lookup results, and related commands run. Each score is added to the data frame at the end, so you can view and rank each score individually or by the aggregate score.
These scores are not intended to be an exact scoring of whether a command is malicious. Rather, they provide a guide to analysts as to which commands to prioritize for investigation. They do not represent any mathematical value and are not calculated in comparison to any particular number other than each other. In general, higher scores are more likely to be malicious commands.
If you have your own ideas for how you want to score or rank, you can adjust the code in the following sections to do so.
Frequency Analysis
This cell creates a frequency score for each command based on its frequency within the workspace and within its host.
This is calculated as follows: [(1 / frequency in workspace) + (1 / frequency in its host)] / 2.
1 divided by the frequency numbers results in bigger numbers for commands that occur fewer times, which gives rare commands higher scores. Dividing by 2 normalizes this score to be under 1.
The data frame is shown again at the bottom, with frequency score added to the total score count.

IoC Extraction
This section extracts Indicators of Compromise (IoCs) from the command lines using MSTICPy’s IoC extraction features. It will display the observables found (IPv4, IPv6, DNS, URL, Windows path, Linux path, MD5 hash, SHA1 hash, and SHA256 hash), the IoC types, and the original source indices of the rows in the previous data frame it was found in.
If you are interested in an observable pattern that is not being matched, see the MSTICpy IoC Extraction documentation for more information on how to add your own.
You can use this data frame to get a quick glimpse of the unique IoCs found. This can be helpful if you are looking for something specific or to give another clue as to what the encoded command was doing.
This data will also be merged with the original data frame so you will be able to see which IoCs came from which commands.

Threat Intel Lookup
This section allows you to use outside TI data to take in the IoCs you want to look up and get TI information on them.
The first cell in this section will print out your current TI configurations, which you can set up in msticpyconfig.yaml. This was covered earlier in the blog in the “Configuring the Notebook” section. Once you have this set up, run the second cell and use the select tool to choose which providers you want to use.
Then, use the select widget created by the third cell to pick the IoCs you want to look up. Run the next cell in this section for a data frame of TI results from different providers.
The last cell will calculate severity scores based on how the providers ranked each IoC. Scores are calculated by looking up each unique IoC in each command, and adding the score corresponding to the highest severity rating given out of the providers you used. Commands with more high severity IoCs will score higher on this.

Related Alerts
This section scores related Azure Sentinel alerts that took place in the given time frame.
If you know of a time frame that you’re interested in, whether from perusing the data or from prior knowledge, you can use the time selector to focus in on this.
Run the first cell to select a time in the widget. The second cell will display a list of alert types found, their names, and how many times they occurred in that time frame for each host. There will also be a data frame with in-depth information on each of the alerts found in each host. Finally, there will be a timeline that illustrates when alerts occurred within the time frame. This is done through the use of MSTICpy’s related alerts feature.
The final cell in this section will return a further revised Base64 command data frame with Alert Scores, as well as the previous TI Severity Scores and Frequency Scores, both individually and added to Total Scores.
Scoring will be done based on the presence of high severity alerts found: each unique alert will add points to the score corresponding to severity, with high severity alerts scoring higher.

Final Scores and Ranking
The final section of the notebook brings together all the previous scoring and provides you with a final ranking of Base64 encoded commands that are most likely to be malicious.
Customizing Your Data Frame
You can use the selector widget from the first cell to choose which columns you’d like to view. The second cell will show those columns with the highest total scoring commands at the top. The widgets generated here allow you to choose a cutoff score for any of the scores displayed. The data frame also shows the relative makeup of each total score.
The bar chart created underneath further enhances this perception and allows you to see which factors led commands to score the way they did. The x-axis highlights the indices, so you can view the rest of the information by finding that index in the data frame.
Overall Timeline
The final cell in the section creates a timeline out of all the base 64 command data retrieved. Mouse over each dot on the timeline for information on which command it referred to and its categories. This may be helpful in gaining a better understanding of possible attacker behavior and noting anomalies.

Summary
Base64 commands are increasingly used by attackers on Linux hosts and are often uncaught by traditional detections. It can be helpful, when hunting or investigating, to take a deeper look at Base64-encoded commands.
This notebook creates a method for investigators to understand Base64 encoded activity in their workspaces by providing an accessible way to rank encoded commands that are most likely to be malicious and multiple avenues through which to view and explore this data. Other notebooks and methodologies can be helpful for deeper explorations. You can find more blogs on these here.
If you are interested in building your own notebooks in the TI space, you may also want to take a look at MSTICpy, which offers plenty of tools and features for you to easily explore your datasets. Feel free to let the MSTIC team know if you encounter any issues or have any suggestions and contributions to make to our notebooks and MSTICpy.
Additional Reading and References
by Scott Muniz | Aug 10, 2020 | Azure, Microsoft, Technology, Uncategorized
This article is contributed. See the original author and article here.
Azure Active Directory B2C (Azure AD B2C) is a great way to enable secure authentication for your users across mobile and web — from basic sign-in and sign-out, to profile management and more.
While Azure AD B2C is designed to work well on any iOS or Android phone or tablet, integrating with any auth provider can be particularly tricky on a mobile device, particularly if you’re building a “hybrid” mobile app using something like Cordova or Capacitor. Issues like secure token storage, Man-In-The-Middle attacks, and timely security updates can be troublesome, and create risks if not handled properly.
That’s why the Ionic team designed Auth Connect. Ionic Auth Connect makes it easy to add secure authentication to any hybrid mobile app running on iOS, Android, or the web. Using a simple, powerful API, it handles logging in and/or registering a user with an authentication provider (such as Azure Active Directory) using industry-standard OAuth/OpenId Connect.
Getting Started
In this tutorial, we’ll add login/logout functionality to a basic Ionic app by integrating Ionic Auth Connect. There’s only a few steps required to implement Auth Connect with Azure AD B2C in an Ionic app: configure Azure AD B2C, install Auth Connect in an Ionic app, and configure Auth Connect to use Azure AD B2C.
To begin, clone this repository and follow along. The “start” folder contains the basic structure of the app that we’ll make changes to and the “completed” folder contains the finished app as a reference point if needed.
NOTE: An Ionic Native Enterprise Edition key is required in order to install and use the Ionic Auth Connect plugin. Ionic Native Enterprise features a library of Premier plugins and solutions that are fully supported and maintained by the Ionic team, with access to Ionic experts and a guaranteed response SLA to mission-critical app development. If you are interested in acquiring a key or learning more, please contact us here.
To see what Ionic Auth Connect looks like in action, view this short video.
After cloning the code, do the following:
1. Install the Ionic CLI:
npm install -g @ionic/cli
2. In a terminal, change directory into the “start” folder in the repository:
cd demo-authconnect-azureb2c/start
3. Run npm install. NOTE: This will fail if an Ionic Native key hasn’t been registered.
4. Run ionic serve to build and serve the app locally in a web browser.
The Reference App
The Ionic app is a modified version of a blank Angular starter project. It consists of two pages: the Home page displays the signed-in user’s details (which will be retrieved from Azure AD B2C) and the Login page protects the Home page from unauthorized access.
Azure Active Directory B2C Configuration
Before integrating Auth Connect into the Ionic app, you’ll need to get Azure Active Directory (AD) B2C up and running.
Note: For complete information on configuring Azure AD, consult the official B2C documentation which includes tutorials on creating a B2C tenant, registering applications, and more.
Create an Azure AD B2C Tenant
If you don’t have one, create a new B2C tenant.
Register an Application
Sign into the Azure Portal then navigate to the Azure AD B2C service page.
Begin by creating a new Application under Manage – App registrations – New registration.

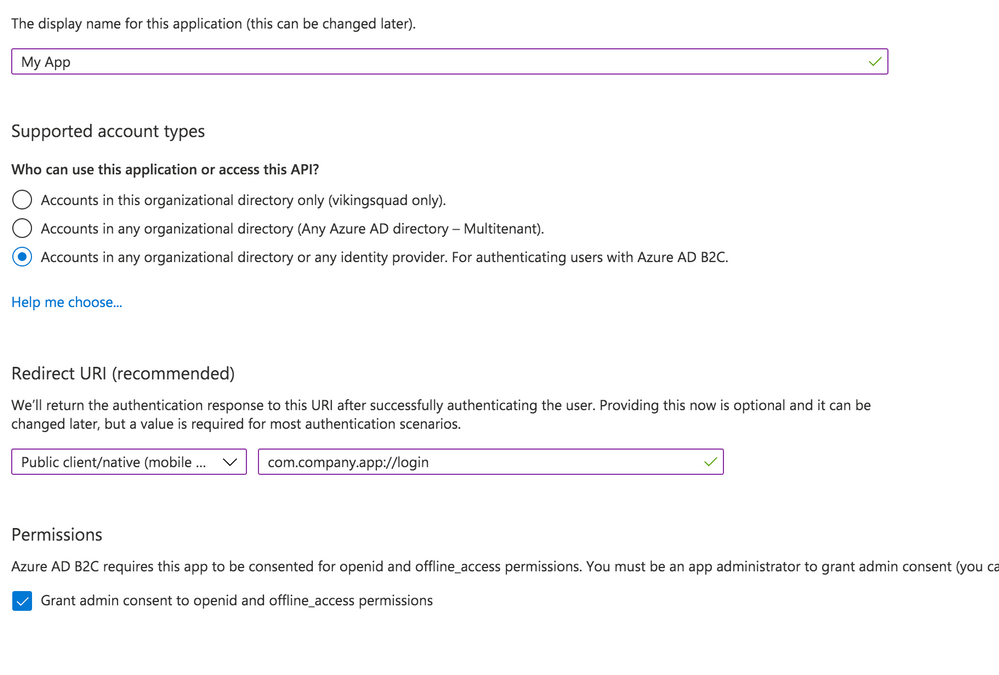
Give your app a new name, then select the Supported Account Types.
With that in hand, set the Redirect URI. Choose “Public client/native (mobile & desktop)” – we’ll add web support in a separate step. Then, fill in the text field value with your globally unique App Id, which is used both in the Azure configuration as well as the native mobile app’s configuration. Typically, this takes the form of company-AppName or reverse DNS style – com.company.app. Use the formula “uniqueId://page”. After the app user signs into Azure AD, this tells Auth Connect which page to redirect to in your app. While any page can be used, in this example we’ll use the Login page, such as com.company.app://login. Click the register button to create the app.
Add Web Platform
With the app created, navigate to Manage – Authentication. Click the “Add a Platform” button. Under Web applications, choose “single-page application.”
Under Redirect URIs, specify a web URL. In this example, for local testing, we’ll use http://localhost:8100/ along with the name of your app’s core login page (typically, login).
Next, under Logout URL, specify a web URL to redirect to once the user has logged out of your app. Again, for local testing, specify https://localhost:8100/ along with the name of the logout page (typically logout).
Finally, under Implicit Grant, toggle “Access tokens.” Click the Configure button to save.

Back on the Authentication page, look under the Single-page application settings. Click the “Add URI” button to add additional Redirect URIs, including those for other environments like staging or production. Click Save when ready.

Expose an API
Navigate to the “Expose an API” page. Click “Add a scope”, then for the Scope name, provide a value such as “user_impersonation.” For the display name and description fields, add details describing that this is for authenticating your users. Set the state to enabled then click the “Add scope” button.
Configure API Permissions
Next, we need to authorize our app so it can connect to Azure B2C and retrieve user profile information alongside login credentials. Navigate to the API Permissions page then click the “Add a permission” button. Under “Select an API”, choose “My APIs” then click the name of the B2C app we’re currently configuring. Next, select the “user_impersonation” permission (or whatever name you labeled it in the previous step) then click the “Add permissions” button.
Save the application, then click on the newly added permission row. Click the “Grant admin consent for [your organization name]” button then choose “Yes.”

Click on the “user_impersonation” permission row again to open the modal window, then click to copy the link that is displayed. Note this URL, because it will be used as part of Auth Connect’s “scopes” property later.

Create User Flows (Policies)
Create at least one User Flow, the series of pages that define the entire authentication experience for your app. At a minimum, create a Sign up and sign in flow. Once the User Flow has been created, select it from the User Flow list, then click “Run user flow” from the Overview tab. Note the URL at the top of the page, used to configure Auth Connect’s Discovery URL property.
Azure AD B2C is now ready to use with Auth Connect.
Install Auth Connect
Auth Connect works on the web or on mobile. For deploying to mobile, we’ll use Capacitor, Ionic’s cross-platform native runtime for building native mobile and web apps, using JavaScript, HTML, and CSS, with one shared codebase. Learn more about the project and how to deploy this Ionic app to mobile here.
Adding Capacitor is easy:
ionic integrations enable capacitor
Run the following command to install the Auth Connect plugin. For the AUTH_URL_SCHEME variable, use the globally unique App Id (ex: com.company.app) you decided on when configuring the Azure AD app above.
npm install @ionic-enterprise/auth --variable AUTH_URL_SCHEME=com.company.app
npx cap sync
Configure Auth Connect
Configuring Auth Connect involves two steps: adding configuration details into the app from your Azure AD tenant and implementing login/logout functionality.
Azure Configuration Details
Since the Azure AD B2C app will support different values per environment (typically staging, QA, production, etc.) we can support that in the Ionic app using Angular’s environments. Open src/environments/environment.ts then add the following. We’ll begin with a web-based configuration since it’s easier to build and test locally in a browser:
import { IonicAuthOptions } from '@ionic-enterprise/auth';

export const azureWebConfig : IonicAuthOptions = {
  // the auth provider
  authConfig: 'azure',
  // The platform which we are running on
  platform: 'web',
  // client or application id for provider
  clientID: 'FILL_IN',
  // the discovery url for the provider
  // OpenID configuration
  discoveryUrl: 'FILL_IN',
  // the URI to redirect to after log in
  redirectUri: 'http://localhost:8100/login',
  // requested scopes from provider
  scope: 'openid offline_access email profile FILL_IN',
  // the URL to redirect to after log out
  logoutUrl: 'http://localhost:8100/login',
  // Show provider login in either current window or new tab
  implicitLogin: "CURRENT"
};
Some of these `IonicAuthOptions` values are unique and must be set based on the Azure AD app that we just created above:
* platform: Use “web” if running as a PWA or “capacitor” when the app is deployed as an iOS or Android app.
* clientID: Your app’s _Application (client) ID_, found on the Overview page. Example: cebbb0be-d578-4bbd-9712-4b0fe05c06aa
* redirectUri: The URI to redirect to after the user has logged in. Since we’re testing locally in a browser, use “http://localhost:8100/login” since this is what `ionic serve` runs on.
* logoutUrl: The URI to redirect to after the user has logged out. Again, use “http://localhost:8100/”.
The scope property is used to unlock access to protected resources, such as read/write permissions. There’s a variety of attributes available; an example looks like: “openid offline_access email profile”.
In addition to the values above, add the Full Scope Value link created earlier to the `scope` property. To find it in the Azure AD B2C portal, navigate to the “Expose an API” page then click on the Scope you defined earlier. In the modal window, copy the link that appears under “Scope name.” All together, it will look similar to this:
scope: 'openid offline_access email profile https://orgname.onmicrosoft.com/api/user_impersonation',
The discoveryUrl can be found by navigating to the main Azure AD B2C page -> Policies -> User flows -> [Select User Flow] -> Overview tab -> Run user flow button. The discovery link is at the top of the page and will look like the following format:
https://B2C-TENANT-NAME.b2clogin.com/B2C-TENANT-NAME.onmicrosoft.com/v2.0/.well-known/openid-configuration?p=POLICY-NAME
Where B2C-TENANT-NAME is your tenant name and the POLICY-NAME is the name of the User Flow created earlier.
The native mobile configuration is almost the same as the web. Make a copy of the web configuration then change the redirect and logout urls. Use the same AUTH_URL_SCHEME variable value (App Id) from when the Auth Connect plugin was installed. For example, “com.company.app://” plus the name of the Login page. Change the platform to “capacitor”:
export const azureNativeConfig : IonicAuthOptions = {
  platform: 'capacitor',
  redirectUrl: 'com.company.app://login',
  logoutUrl: 'com.company.app://logout'

  // snip - other variables
}
Create an Authentication Service for Login Functionality
With Azure AD environment configurations added to the Ionic app, we can now leverage them in an AuthenticationService class that encapsulates Azure AD and Ionic Auth Connect’s login functionality.
Generate this class using the ionic generate command:
ionic generate service services/authentication
Open up src/app/services/authentication.service.ts and import Auth Connect, RxJs (for tracking login status changes), and the Azure AD configuration objects we just created:
import { Injectable } from '@angular/core';
import { Platform } from '@ionic/angular';
import { IonicAuth } from '@ionic-enterprise/auth';
import { Subject, Observable } from 'rxjs';
import { azureNativeConfig, azureWebConfig } from '../../environments/environment';
Next, extend the IonicAuth class in order to gain access to Auth Connect’s functionality, and in the constructor, instantiate it with the proper Azure configuration object. Using Ionic’s Platform API, we can dynamically choose which configuration to use based on whether the app is running on the web or a mobile device.
export class AuthenticationService extends IonicAuth {
  constructor(platform: Platform) {
    // Determine whether to run on mobile or the web
    const selectedConfig = platform.is('hybrid') ? azureNativeConfig : azureWebConfig;
    super(selectedConfig);
}
Implementing login functionality is quite simple – we define our own login method then call Auth Connect’s login method.
async login(): Promise<void> {
  await super.login();
}
Upon successful login, Auth Connect calls the `onLoginSuccess` event, which we can override here to run any additional logic we need. In this case, we can emit an RxJs event when the login status changes (either logged in or logged out) then react accordingly (direct the user into the app or back to the Login page).
onLoginSuccess() {
    this._loginStatusChanged.next(true);
}
Define the status change observable right below the class definition:
 // Emit event when login status changes
  private _loginStatusChanged: Subject<boolean>;

  get loginStatusChanged(): Observable<boolean> {
    return this._loginStatusChanged.asObservable();
  }
To detect and act on the login status changing, head over to `app.component.ts` in `src/app`. Import the AuthenticationService class, then subscribe to the status change observable:
import { AuthenticationService } from './services/authentication.service';

// snip

constructor(

    private auth: AuthenticationService,
    private navController: NavController,
    private platform: Platform
  ) {

    this.initializeApp();

    this.auth.loginStatusChanged.subscribe(authenticated =>
         this.handleAuthChange(authenticated));
  }
Next, add a method that inspects the status of the login attempt. If successful, redirect the user to the Home page, otherwise, remain on the Login page:
private handleAuthChange(authenticated: boolean) {
    if (authenticated) {
      this.navController.navigateRoot(['home']);
    } else {
      this.navController.navigateRoot(['login']);
    }
  }
The last step is easy: leveraging the AuthenticationService from the Login page (`src/app/login/login.page.ts`). First, add a click handler to the Login button:
<ion-button (click)="login()" strong shape="round">
   Log in
</ion-button>
Next, add a new method to call the AuthenticationService’s login method:
async login() {
  await this.authService.login();
}
Just one last step required. When running as a web app, the user will be redirected to the Azure AD sign-in page. After successful sign-in, they’ll be sent back to the Ionic app and since this is a “fresh” load of the page, we need to pass the access token along to Auth Connect. To do so, pass the browser’s url to Auth Connect’s `handleCallback` function:
async ngOnInit() {
    if (window.location.hash) {
        await this.authService.handleCallback(window.location.href);
    }
}
Once handleCallback completes, Auth Connect will call `onLoginSuccess()` in the AuthenticationService class, which triggers the login status change event, ultimately permitting the user access to the Home page.
That’s it! Click the Login button in the browser, sign in using your Azure AD B2C credentials, then you should be redirected to the Home app.
View Azure AD User Details
Logging in is nice, but what if we took it one step further by displaying some of the Azure AD user’s profile details on the Home page?
Back over in the AuthenticationService, declare a new method to retrieve the user’s profile info from Azure. Access all information via Auth Connect’s `getIdToken` function:
async getUserInfo() {
    const idToken = await this.getIdToken();
    if (!idToken) {
      return;
    }

    let email = idToken.email;

    if (idToken.emails instanceof Array) {
      email = idToken.emails[0];
    }

    return {
      id: idToken.sub,
      email: email,
      firstName: idToken.given_name,
      lastName: idToken.family_name,
      picture: "assets/user-placeholder.jpg"
    };
  }
Next, over in the Home page (`src/app/home/home.page.ts`), make the call to `getUserInfo` when the page loads:
user: any;

constructor(private authService: AuthenticationService) { }

async ngOnInit() {
    this.user = await this.authService.getUserInfo();
}
To complete this, update the Home page’s HTML template so that it now displays the user’s profile info:
<ion-content>
  <div class="ion-padding">
    <div align="center" *ngIf="user">
      <ion-avatar>
        <img src="{{ user.picture }}">
      </ion-avatar>

      <p>{{ user.firstName}} {{ user.lastName }}</p>
      <p>{{ user.email }}</p>
    </div>

    <ion-button expand="block" (click)="logout();" style="margin-top: 50px">Log out</ion-button>
  </div>
</ion-content>
If you’re still running `ionic serve`, save all files, then the page should reload, displaying your Azure AD user profile details.
Implementing Log Out
The last step is to add logout functionality. Since we’re already in the Home page code, add a new function that calls Auth Connect’s `logout` function directly:
async logout() {
    await this.authService.logout();
  }
Back over in AuthenticationService, implement Auth Connect’s “onLogout” event, which fires once it has successfully logged out the current user. All the app needs to do is fire the login status changed event, passing “false” to indicate that the user is no longer logged in:
onLogout() {
    this._loginStatusChanged.next(false);
  }
Recall that this event will be caught over in `app.component.ts`, and since “authenticated” is now false, the user will be redirected to the Login page:
private handleAuthChange(authenticated: boolean) {
    if (authenticated) {
      this.navController.navigateRoot(['home']);
    } else {
      this.navController.navigateRoot(['login']);
    }
  }
Reload the page, click the Logout button, and you should be signed out then redirected to the Login page.
What’s Next?
In just a few steps, we added Azure AD B2C authentication to an Ionic app, with complete login and logout functionality. With Auth Connect now in place, there are many paths to go from here. You can further tweak the Azure AD user experience (such as customizing the user interface) or begin testing Auth Connect in a native app right away.
About Ionic Auth Connect
Auth Connect is built and maintained by the Ionic team. Ionic makes tools and services that empower web developers to deliver stunning native mobile and web applications, using the web tools, libraries, and frameworks that they know and love. Our cross-platform native runtime, Capacitor, provides a secure way to deliver web-based applications on a mobile device. When coupled with Ionic’s Auth Connect solution, implementing single sign-on in web applications is even easier.
Happy app building!

Recent Comments